Deck 5: Demand Forecasting
Full screen (f)
Question
Question
Question
Question
Question
Question
Question
Question
Question
Question
Question
Question
Question
Question
Question
Question
Question
Question
Question
Question
Question
Question
Question
Question
Question
Question
Question
Question
Question
Question
Question
Question
Question
Question
Question
Question
Question
Question
Question
Question
Question
Question
Question
Question
Question
Question
Question
Question
Question
Use the data set below (Data Set E3)to answer the questions that follow.Data Set E3 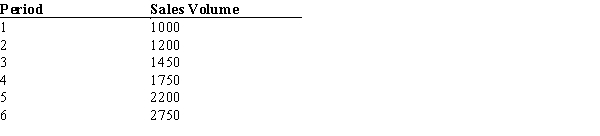
a.Find the four-period simple moving average forecasts for Periods 5 and 6.
b.Find the four-period weighted moving average forecasts for Periods 5 and 6 using weights of 0.05, 0.15, 0.30, and 0.50 from the earliest period to the latest period, respectively.
c.Which set of forecasts is more accurate, the simple moving average forecasts or the weighted moving average forecasts? Why is that set of forecasts more accurate in this particular case (using Data Set E3)?
d.Will that type of forecast always be more accurate? Why or why not?
Question
Question
Question

Unlock Deck
Sign up to unlock the cards in this deck!
Unlock Deck
Unlock Deck
1/52
Play
Full screen (f)
Deck 5: Demand Forecasting
1
Quantitative forecasting methods are based on opinions and intuition,whereas qualitative forecasting methods use mathematical models and relevant historical data to generate forecasts.
False
2
CPFR is more likely to succeed if companies educate their employees on the benefits of the process changes and the disadvantages of maintaining the status quo.
True
3
One of the goals of an effective CPFR system is to minimize the negative impacts of the bullwhip effect on supply chains.
True
4
Examples of forecasting accuracy measures are Mean Absolute Deviation,Mean Absolute Percentage Error,and Mean Square Error.
Unlock Deck
Unlock for access to all 52 flashcards in this deck.
Unlock Deck
k this deck
5
If you felt that recent demand trends were more significant,and thus should be emphasized more in formulating a forecast,then in forecasting demand for the upcoming demand period,you would probably favor using a simple moving average over the conventional weighted moving average.
Unlock Deck
Unlock for access to all 52 flashcards in this deck.
Unlock Deck
k this deck
6
Given the following information,the forecast for period two using exponential smoothing and = 0.3 is 61.5.
Unlock Deck
Unlock for access to all 52 flashcards in this deck.
Unlock Deck
k this deck
7
Cause-and-Effect Models can have multiple independent variables.
Unlock Deck
Unlock for access to all 52 flashcards in this deck.
Unlock Deck
k this deck
8
Some important steps involved in implementation of a CPFR process model include,seeking long-term holistic solutions,creating clear accountabilities,and reducing decision cycle time.
Unlock Deck
Unlock for access to all 52 flashcards in this deck.
Unlock Deck
k this deck
9
Some of the benefits of CPFR include strengthening partner relationships,providing an analysis of sales and order forecasts,and allowing collaboration on future requirements and planning.
Unlock Deck
Unlock for access to all 52 flashcards in this deck.
Unlock Deck
k this deck
10
Trends representing either increasing or decreasing movements over many years due to factors such as population growth,population shifts,cultural changes and income shifts are a component of a time series called "Random Variations".
Unlock Deck
Unlock for access to all 52 flashcards in this deck.
Unlock Deck
k this deck
11
The true value of CPFR comes from the sophisticated forecasting algorithms that provide companies with highly accurate forecasts,not from the exchange of forecasting information.
Unlock Deck
Unlock for access to all 52 flashcards in this deck.
Unlock Deck
k this deck
12
The difference between a simple regression forecast and a multiple regression forecast is that simple regression is used when there is only one explanatory (or independent)variable,while multiple regression is used when there are numerous explanatory variables.
Unlock Deck
Unlock for access to all 52 flashcards in this deck.
Unlock Deck
k this deck
13
As tighter control limits are instituted for the tracking signal,there is a greater probability of finding exceptions that require no action,but it also means catching changes in demand earlier.
Unlock Deck
Unlock for access to all 52 flashcards in this deck.
Unlock Deck
k this deck
14
If you were calculating a forecast using an exponential smoothing model,a calculation using α = 0.2 would be putting a greater emphasis on recent data,while a calculation using α = 0.8 would be putting a greater emphasis on past data.Thus a lower α is more responsive to changes in demand in the most recent periods.
Unlock Deck
Unlock for access to all 52 flashcards in this deck.
Unlock Deck
k this deck
15
The modern day business environment must deal with a more homogenous consumer base,which has caused the evolution of a more "push" oriented environment where suppliers must focus on manufacturing high volumes of standardized goods and convince consumers to buy their products.
Unlock Deck
Unlock for access to all 52 flashcards in this deck.
Unlock Deck
k this deck
16
According to the text,the ultimate goal of any forecasting endeavor is to have an accurate and unbiased forecast.
Unlock Deck
Unlock for access to all 52 flashcards in this deck.
Unlock Deck
k this deck
17
The goal of a good forecasting technique is to achieve 98.7% accuracy between the forecast and actual demand.
Unlock Deck
Unlock for access to all 52 flashcards in this deck.
Unlock Deck
k this deck
18
In the Delphi forecasting method,a group of internal and external experts are surveyed during several rounds in terms of future events and long-term forecasts of demand but the group members do not physically meet.
Unlock Deck
Unlock for access to all 52 flashcards in this deck.
Unlock Deck
k this deck
19
The goal of a good forecasting technique is to minimize the deviation between actual demand and the forecast.
Unlock Deck
Unlock for access to all 52 flashcards in this deck.
Unlock Deck
k this deck
20
Associative forecasting methods are based on opinions and intuition.
Unlock Deck
Unlock for access to all 52 flashcards in this deck.
Unlock Deck
k this deck
21
The exponential smoothing forecast has the same value as the naïve forecast when α in the exponential smoothing model is equal to:
A)0
B)0.5
C)1
D)Insufficient information provided to determine answer
A)0
B)0.5
C)1
D)Insufficient information provided to determine answer
Unlock Deck
Unlock for access to all 52 flashcards in this deck.
Unlock Deck
k this deck
22
Which of the following statements is FALSE:
A)Time Series forecasting is based on the assumption that the future is an extension of the past
B)Cause-and-Effect forecasting assumes that one or more factors are related to demand and, therefore, can be used to predict future demand
C)All quantitative methods become less accurate as the forecast's time horizon increases
D)It is generally not recommended to use a combination of both quantitative and qualitative methods
Unlock Deck
Unlock for access to all 52 flashcards in this deck.
Unlock Deck
k this deck
23
Inaccurate forecasts can result in negative outcomes like:
A)Stockouts and poor responsiveness to market dynamics
B)High inventory costs of inventory and increased profits
C)Material shortages and decreased costs of obsolescence
D)Low inventory costs of inventory and stockouts
A)Stockouts and poor responsiveness to market dynamics
B)High inventory costs of inventory and increased profits
C)Material shortages and decreased costs of obsolescence
D)Low inventory costs of inventory and stockouts
Unlock Deck
Unlock for access to all 52 flashcards in this deck.
Unlock Deck
k this deck
24
Given the following information,calculate the forecast (accurate to 2 decimals)for period three using exponential smoothing and ? = 0.3.
A)36.90
B)57.50
C)61.50
D)63.35
A)36.90
B)57.50
C)61.50
D)63.35
Unlock Deck
Unlock for access to all 52 flashcards in this deck.
Unlock Deck
k this deck
25
-A forecasting method has produced the following data over the past 5 months shown in Data Set E2.What is the mean absolute deviation (accurate to 2 decimals)?
A)?0.60
B)?1.20
C)1.00
D)1.25
Unlock Deck
Unlock for access to all 52 flashcards in this deck.
Unlock Deck
k this deck
26
-Using Data Set E1,what would be the forecast for period 6 using a five period weighted moving average? The weights for each period are 0.05,0.10,0.20,0.30,and 0.35 from the oldest period to the most recent period,respectively.(Choose the closest answer.)
A)16490
B)17825
C)14575
D)16275
Unlock Deck
Unlock for access to all 52 flashcards in this deck.
Unlock Deck
k this deck
27
Which one of the following is not a type of qualitative forecasting?
A)Sales force composite
B)Consumer survey
C)Jury of executive opinion
D)Naïve method
A)Sales force composite
B)Consumer survey
C)Jury of executive opinion
D)Naïve method
Unlock Deck
Unlock for access to all 52 flashcards in this deck.
Unlock Deck
k this deck
28
If a tracking signal is positive,which one of the following is true?
A)Actual value is higher than forecast
B)Actual value is less than forecast
C)Actual value is equal to forecast
D)Unable to draw any conclusion
A)Actual value is higher than forecast
B)Actual value is less than forecast
C)Actual value is equal to forecast
D)Unable to draw any conclusion
Unlock Deck
Unlock for access to all 52 flashcards in this deck.
Unlock Deck
k this deck
29
The following time-series approach to forecasting uses historical data to generate a forecast and works well when demand is fairly stable over time:
A)Naïve Forecast
B)Weighted Moving Average
C)Simple Moving Average
D)Exponential Smoothing
A)Naïve Forecast
B)Weighted Moving Average
C)Simple Moving Average
D)Exponential Smoothing
Unlock Deck
Unlock for access to all 52 flashcards in this deck.
Unlock Deck
k this deck
30
The impact of poor communication and inaccurate forecasts resonates along the supply chain and results in the:
A)Bullwhip effect
B)Delphi method
C)CPFR effect
D)Mean deviation
A)Bullwhip effect
B)Delphi method
C)CPFR effect
D)Mean deviation
Unlock Deck
Unlock for access to all 52 flashcards in this deck.
Unlock Deck
k this deck
31
The equation for a simple linear regression that saw sales averaging $225,000 over the last ten periods,and advertising budgets averaging $3,000 over the last 10 periods is:Y = 3250 + 120xThis indicates that a $1 increase in advertising will increase sales by:
A)$3370
B)$250
C)$120
D)$1875
A)$3370
B)$250
C)$120
D)$1875
Unlock Deck
Unlock for access to all 52 flashcards in this deck.
Unlock Deck
k this deck
32
Which of the following indices provided by the Institute for Supply Management (ISM)is considered the most important by economists because it is a composite of five weighted,seasonally adjusted indices?
A)Purchasing Managers Index
B)Export Orders Index
C)Production and Inventory Index
D)New Orders Index
A)Purchasing Managers Index
B)Export Orders Index
C)Production and Inventory Index
D)New Orders Index
Unlock Deck
Unlock for access to all 52 flashcards in this deck.
Unlock Deck
k this deck
33
According to the textbook,which of the following is NOT a way to closely match supply and demand?
A)Holding high amounts of inventory
B)Maintaining a rigid pricing system
C)Utilizing overtime
D)Hiring temporary workers
A)Holding high amounts of inventory
B)Maintaining a rigid pricing system
C)Utilizing overtime
D)Hiring temporary workers
Unlock Deck
Unlock for access to all 52 flashcards in this deck.
Unlock Deck
k this deck
34
Using the actual demand shown in the table below,what is the forecast for May (accurate to 1 decimal)using a 4-month weighted moving average and the weights 0.1,0.2,0.3,0.4 (with the heaviest weight applied to the most recent period)?
A)44.4
B)43.0
C)42.5
D)41.6
A)44.4
B)43.0
C)42.5
D)41.6
Unlock Deck
Unlock for access to all 52 flashcards in this deck.
Unlock Deck
k this deck
35
-Using Data Set E1,what would be the forecast for period 7 using a four period moving average: (Choose the closest answer.)
A)17625
B)15225
C)15300
D)17250
Unlock Deck
Unlock for access to all 52 flashcards in this deck.
Unlock Deck
k this deck
36
-Using Data Set E1,what would be the forecast for period 6 using the exponential smoothing method? Assume the forecast for period 5 is 14000.Use a smoothing constant of ? = 0.4 (Choose the closest answer.)
A)14575
B)26100
C)16600
D)19700
Unlock Deck
Unlock for access to all 52 flashcards in this deck.
Unlock Deck
k this deck
37
Some measures of forecasting accuracy include mean absolute deviation,mean absolute percentage error,and mean squared error.The formula for each is dependent on the forecast error,which is calculated by using the equation:
A)Actual demand for period t divided by the forecasted demand for period t
B)Actual demand for period t plus the forecasted demand for period t
C)Actual demand for period t minus the forecasted demand for period t
D)The average of Actual demand for period t and forecasted demand for period t
A)Actual demand for period t divided by the forecasted demand for period t
B)Actual demand for period t plus the forecasted demand for period t
C)Actual demand for period t minus the forecasted demand for period t
D)The average of Actual demand for period t and forecasted demand for period t
Unlock Deck
Unlock for access to all 52 flashcards in this deck.
Unlock Deck
k this deck
38
The following are all common qualitative forecasting models EXCEPT:
A)Jury of Executive Opinion
B)Trend Variation
C)Delphi Method
D)Sales Force Composite
A)Jury of Executive Opinion
B)Trend Variation
C)Delphi Method
D)Sales Force Composite
Unlock Deck
Unlock for access to all 52 flashcards in this deck.
Unlock Deck
k this deck
39
One common Cause-and-Effect Model used is:
A)Regression analysis
B)Linear Trend Forecast
C)Moving Average Forecast
D)Mean Absolute Deviation
A)Regression analysis
B)Linear Trend Forecast
C)Moving Average Forecast
D)Mean Absolute Deviation
Unlock Deck
Unlock for access to all 52 flashcards in this deck.
Unlock Deck
k this deck
40
Your company is conducting forecasting that revolves around the current recession and expansion of the U.S.economy.This type of forecasting can be referred to as what component of a time series?
A)Trend Variations
B)Cyclical Variations
C)Seasonal Variations
D)Random Variations
A)Trend Variations
B)Cyclical Variations
C)Seasonal Variations
D)Random Variations
Unlock Deck
Unlock for access to all 52 flashcards in this deck.
Unlock Deck
k this deck
41
Answer the following questions regarding quantitative and qualitative forecasting:
a.Define quantitative forecasting.
b.Explain the naïve forecasting method and give an example.
c.What are the benefits of using the naïve forecasting method?
d.Under which circumstances would one utilize a combination of both quantitative and qualitative forecasting?
a.Define quantitative forecasting.
b.Explain the naïve forecasting method and give an example.
c.What are the benefits of using the naïve forecasting method?
d.Under which circumstances would one utilize a combination of both quantitative and qualitative forecasting?
Unlock Deck
Unlock for access to all 52 flashcards in this deck.
Unlock Deck
k this deck
42
Explain the key challenges of CPFR implementation.
Unlock Deck
Unlock for access to all 52 flashcards in this deck.
Unlock Deck
k this deck
43
Which of the following is NOT a benefit of CPFR?
A)Improved corporate image among regulators
B)Integrates planning, forecasting and logistics activities
C)Provides analysis of sales and order forecasts
D)Provide an analysis of key performance metrics
A)Improved corporate image among regulators
B)Integrates planning, forecasting and logistics activities
C)Provides analysis of sales and order forecasts
D)Provide an analysis of key performance metrics
Unlock Deck
Unlock for access to all 52 flashcards in this deck.
Unlock Deck
k this deck
44
What does the acronym CPFR represent?
A)Coordinated planning and forecasting relationships
B)Collaborative planning, forecasting, and replenishment
C)Centralized purchasing and forecasting relationships
D)Collaborative purchasing, forecasting, and receivables
A)Coordinated planning and forecasting relationships
B)Collaborative planning, forecasting, and replenishment
C)Centralized purchasing and forecasting relationships
D)Collaborative purchasing, forecasting, and receivables
Unlock Deck
Unlock for access to all 52 flashcards in this deck.
Unlock Deck
k this deck
45
The four components of time series data are: trend variations,cyclical variations,seasonal variations,and random variations.Briefly describe each type of variation.
Unlock Deck
Unlock for access to all 52 flashcards in this deck.
Unlock Deck
k this deck
46
What is a tracking signal? How can managers use the information provided by the tracking signal to improve the quality of forecasts?
Unlock Deck
Unlock for access to all 52 flashcards in this deck.
Unlock Deck
k this deck
47
Qualitative methods of forecasting include which of the following:
A)Sales Force Composite
B)Customer Surveys
C)Jury of Executive Opinion
D)All of these
A)Sales Force Composite
B)Customer Surveys
C)Jury of Executive Opinion
D)All of these
Unlock Deck
Unlock for access to all 52 flashcards in this deck.
Unlock Deck
k this deck
48
According to textbook,the top three challenges for CPFR implementation include all of the following except:
A)Making organizational and procedural changes
B)Trust between supply chain partners
C)Cost
D)Supplier lead times
A)Making organizational and procedural changes
B)Trust between supply chain partners
C)Cost
D)Supplier lead times
Unlock Deck
Unlock for access to all 52 flashcards in this deck.
Unlock Deck
k this deck
49
Use the data set below (Data Set E3)to answer the questions that follow.Data Set E3
a.Find the four-period simple moving average forecasts for Periods 5 and 6.
b.Find the four-period weighted moving average forecasts for Periods 5 and 6 using weights of 0.05, 0.15, 0.30, and 0.50 from the earliest period to the latest period, respectively.
c.Which set of forecasts is more accurate, the simple moving average forecasts or the weighted moving average forecasts? Why is that set of forecasts more accurate in this particular case (using Data Set E3)?
d.Will that type of forecast always be more accurate? Why or why not?
Unlock Deck
Unlock for access to all 52 flashcards in this deck.
Unlock Deck
k this deck
50
List and describe two types of qualitative forecasting methods.
Unlock Deck
Unlock for access to all 52 flashcards in this deck.
Unlock Deck
k this deck
51
List FOUR benefits that can be achieved by implementing a successful CPFR program.
Unlock Deck
Unlock for access to all 52 flashcards in this deck.
Unlock Deck
k this deck
52
-Based on the information in Data Set E2,what is the mean squared error (accurate to 2 decimals)?
A)7.00
B)1.40
C)1.00
D)0.80
Unlock Deck
Unlock for access to all 52 flashcards in this deck.
Unlock Deck
k this deck
Unlock Deck
Unlock for access to all 52 flashcards in this deck.


