Deck 10: Time Series Analysis
Full screen (f)
Question
Question
Question
Question
Suppose you wish to estimate the marginal effect that income has on consumption for in a time-series for a given country.The static time-series model would be specified as
A)
B)
C)
D)
A)
B)
C)
D)
Question
Question
Question
Question
Question
Suppose you regress Ice Cream Sales on the number of children under age 10 and on binary dummy variables indicating the 2nd,3rd,and 4th quarters of the year and you get (p-values in parentheses) 
You should conclude that,holding all other independent variables constant,ice cream sales are statistically greater in
A)Q1 than in Q4.
B)Q1 than in Q3.
C)Q2 than in Q1.
D)Q1 than in Q2.
You should conclude that,holding all other independent variables constant,ice cream sales are statistically greater in
A)Q1 than in Q4.
B)Q1 than in Q3.
C)Q2 than in Q1.
D)Q1 than in Q2.
Question
Suppose you estimate the following the degree to which HDTV sales (in millions of units)are related to price,consumer income,and a time-trend as (p-values in parentheses) 
You should conclude that the data do
A)not exhibit a time-trend because the estimated coefficient for Price is not statistically significant.
B)exhibit a time-trend because the estimated coefficient for Income is positive and statistically significant.
C)not exhibit a time-trend because the estimated coefficient for the Time Trend is positive.
D)exhibit a time-trend because the estimated coefficient for the Time Trend is statistically significant.
Question
Suppose that you regress obesity rates on smoking rates for the years 1928-2011 by the model 
)You have just estimated a _______ model.
A)distributed lagged
B)time-trend
C)seasonality
D)static time-series
)You have just estimated a _______ model.
A)distributed lagged
B)time-trend
C)seasonality
D)static time-series
Question
Question
Question
Question
Question
Suppose you wish to estimate the marginal effect that income has on consumption.The distributed lag model would be specified as
A)
B)
C)
D)
A)
B)
C)
D)
Question
Question
Question
Question
Question
Question
Question
Question
Question
Question
Suppose you include a time trend in your model of U.S.Personal Consumption Expenditures (billions)on U.S.Personal Income (billions)using quarterly data for the period 1969Q1-2013Q3 and you get 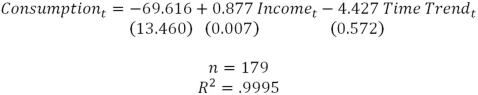
a)Explain how to create the time trend variable.
b)Interpret the time trend variable and comment if it is statistically significant.
c)Explain how to detrend both the dependent and independent variable.
a)Explain how to create the time trend variable.
b)Interpret the time trend variable and comment if it is statistically significant.
c)Explain how to detrend both the dependent and independent variable.
Question
Suppose you estimate a distributed lag model of U.S.Personal Consumption Expenditures (billions)on U.S.Personal Income (billions)using quarterly data for the period 1969Q1-2013Q3 and you get 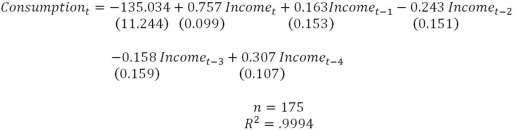
a)What is this model called? Why would you estimate this type of function?
b)Are the lags individually significant at the 5% level?
c)What do your results in part b imply about your preferred model?
a)What is this model called? Why would you estimate this type of function?
b)Are the lags individually significant at the 5% level?
c)What do your results in part b imply about your preferred model?
Question
Suppose you include seasonality controls in your model of U.S.Personal Consumption Expenditures (billions)on U.S.Personal Income (billions)using quarterly data for the period 1969Q1-2013Q3 and you get 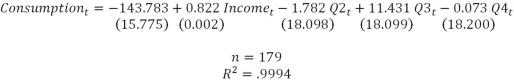
d)Explain how you would create Q2t,Q3t,and Q4t.
e)Interpret the coefficients on Q2t,Q3t,and Q4t and comment on their statistical significance.
d)Explain how you would create Q2t,Q3t,and Q4t.
e)Interpret the coefficients on Q2t,Q3t,and Q4t and comment on their statistical significance.
Question
Question
Question
Question
Question
Question
Suppose you estimate a static time-series model of U.S.Personal Consumption Expenditures (billions)on U.S.Personal Income (billions)using quarterly data for the period 1969Q1-2013Q3 and you get 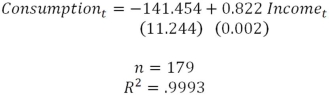
a)How do you interpret the estimated sample regression function? Explain.
b)You wonder if previous values of income affect consumption.Explain how you would estimate a distributed lag model of order 2.
c)Using the model in part c,how would you test for a statistical relationship between past values of income and consumption?
d)If you thought there was a structural break in these data in 2006Q1,how would you control and test for it?
Question
Question
Question
Question

Unlock Deck
Sign up to unlock the cards in this deck!
Unlock Deck
Unlock Deck
1/38
Play
Full screen (f)
Deck 10: Time Series Analysis
1
A structural break occurs when we see
A)an unexpected shift in time-series data.
B)a number of outliers in cross-section data.
C)a general upward trend over time in time-series data.
D)an independent variable is correlated with the dependent variable but there is no theoretical justification on for the relationship.
A)an unexpected shift in time-series data.
B)a number of outliers in cross-section data.
C)a general upward trend over time in time-series data.
D)an independent variable is correlated with the dependent variable but there is no theoretical justification on for the relationship.
A
2
You can test for a structural break in time-series data by
A)including a dummy variable for data after the suspected break and interaction terms between that variable and the remaining independent variables and testing for the joint significance of those terms.
B)including dummy variables for three of the four quarters and testing for the joint significance of those variables.
C)estimating the regression both with and without the suspect independent variable and comparing the R-squared for the two regressions.
D)including a time-trend and testing for the individual significance of that term.
A
3
A stationary time-series is one for which
A)the probability of distribution of the dependent variable changes over time.
B)the probability of distribution of the dependent variable does not change over time.
C)the probability of distribution of the independent variables changes over time.
D)the probability of distribution of the independent variables does not change over time.
B
4
Suppose you wish to estimate the marginal effect that income has on consumption for in a time-series for a given country.The static time-series model would be specified as
A)
B)
C)
D)
A)
B)
C)
D)
Unlock Deck
Unlock for access to all 38 flashcards in this deck.
Unlock Deck
k this deck
5
You can control for quarterly seasonality in your data by
A)de-trending your time-series data.
B)including a time-trend in your regression.
C)including binary dummy variables for all four quarters in your regression.
D)including binary dummy variables for three of the four quarters in your regression.
A)de-trending your time-series data.
B)including a time-trend in your regression.
C)including binary dummy variables for all four quarters in your regression.
D)including binary dummy variables for three of the four quarters in your regression.
Unlock Deck
Unlock for access to all 38 flashcards in this deck.
Unlock Deck
k this deck
6
Spurious regression occurs
A)an unexpected shift in time-series data.
B)a number of outliers in cross-section data.
C)a general upward trend over time in time-series data.
D)an independent variable is correlated with the dependent variable but there is no theoretical justification for the relationship.
A)an unexpected shift in time-series data.
B)a number of outliers in cross-section data.
C)a general upward trend over time in time-series data.
D)an independent variable is correlated with the dependent variable but there is no theoretical justification for the relationship.
Unlock Deck
Unlock for access to all 38 flashcards in this deck.
Unlock Deck
k this deck
7
Time-series data are data collected for a
A)given individual or individuals for a number of different time-periods.
B)given individual for one time-period.
C)number of individuals for one time-period.
D)number of individuals for a number of different time-periods.
A)given individual or individuals for a number of different time-periods.
B)given individual for one time-period.
C)number of individuals for one time-period.
D)number of individuals for a number of different time-periods.
Unlock Deck
Unlock for access to all 38 flashcards in this deck.
Unlock Deck
k this deck
8
Distributed lag models control for differences across time periods by
A)estimating the sample regression function by OLS.
B)including lagged dependent variables in the estimated sample regression function.
C)including lagged independent variables in the estimated sample regression function.
D)including both lagged dependent and lagged independent variables in the estimated sample regression function.
Unlock Deck
Unlock for access to all 38 flashcards in this deck.
Unlock Deck
k this deck
9
Suppose you regress Ice Cream Sales on the number of children under age 10 and on binary dummy variables indicating the 2nd,3rd,and 4th quarters of the year and you get (p-values in parentheses)
You should conclude that,holding all other independent variables constant,ice cream sales are statistically greater in
A)Q1 than in Q4.
B)Q1 than in Q3.
C)Q2 than in Q1.
D)Q1 than in Q2.
You should conclude that,holding all other independent variables constant,ice cream sales are statistically greater in
A)Q1 than in Q4.
B)Q1 than in Q3.
C)Q2 than in Q1.
D)Q1 than in Q2.
Unlock Deck
Unlock for access to all 38 flashcards in this deck.
Unlock Deck
k this deck
10
Suppose you estimate the following the degree to which HDTV sales (in millions of units)are related to price,consumer income,and a time-trend as (p-values in parentheses)
You should conclude that the data do
A)not exhibit a time-trend because the estimated coefficient for Price is not statistically significant.
B)exhibit a time-trend because the estimated coefficient for Income is positive and statistically significant.
C)not exhibit a time-trend because the estimated coefficient for the Time Trend is positive.
D)exhibit a time-trend because the estimated coefficient for the Time Trend is statistically significant.
Unlock Deck
Unlock for access to all 38 flashcards in this deck.
Unlock Deck
k this deck
11
Suppose that you regress obesity rates on smoking rates for the years 1928-2011 by the model
)You have just estimated a _______ model.
A)distributed lagged
B)time-trend
C)seasonality
D)static time-series
)You have just estimated a _______ model.
A)distributed lagged
B)time-trend
C)seasonality
D)static time-series
Unlock Deck
Unlock for access to all 38 flashcards in this deck.
Unlock Deck
k this deck
12
A weakly dependent time series is one for which
A)the observations for a given variable become more closely related over time.
B)the probability of distribution of the dependent variable changes over time.
C)the probability of distribution of the dependent variable does not changes over time.
D)the observations for a given variable become less closely related over time.
Unlock Deck
Unlock for access to all 38 flashcards in this deck.
Unlock Deck
k this deck
13
You can de-trend your data by
A)performing OLS on the de-trended data.
B)performing weighted least squares on the initial data by diving the initial data by the estimate coefficient on the time-trend variable.
C)separately regressing the dependent variable and each of the independent on the time trend and subtracting the estimated residuals from the initial data.
D)including a time trend in your OLS regression.
Unlock Deck
Unlock for access to all 38 flashcards in this deck.
Unlock Deck
k this deck
14
You can limit the problem of potential spurious correlation by
A)estimating the regression both with and without the suspect independent variable and comparing the R-squared for the two regressions.
B)thinking carefully about the chose model specification to rule out potential spurious correlations.
C)including interaction terms between the suspect independent variable and the remaining independent variables and testing for the joint significance of those terms.
D)including a dummy variable for the suspect independent variable and testing for the individual significance of that term.
Unlock Deck
Unlock for access to all 38 flashcards in this deck.
Unlock Deck
k this deck
15
You can control for a potential time-trend in your data by
A)not including spuriously correlated variables in your regression.
B)including dummy variables for three of the four quarters in your regression.
C)de-trending the data before performing OLS.
D)performing weighted least squares by diving the initial data by the estimate coefficient on the time-trend variable.
Unlock Deck
Unlock for access to all 38 flashcards in this deck.
Unlock Deck
k this deck
16
Suppose you wish to estimate the marginal effect that income has on consumption.The distributed lag model would be specified as
A)
B)
C)
D)
A)
B)
C)
D)
Unlock Deck
Unlock for access to all 38 flashcards in this deck.
Unlock Deck
k this deck
17
Seasonality occurs when
A)time-series data move upward or downward over time.
B)time-series data follows similar patterns during specific seasons of the year.
C)an unexpected shift occurs in time-series data.
D)an independent variable is correlated with the dependent variable but there is no theoretical justification for the relationship.
Unlock Deck
Unlock for access to all 38 flashcards in this deck.
Unlock Deck
k this deck
18
You can control for a potential time-trend in your data by including a _____ in your regression.
A)variable that increases by 1 for each successive time-period
B)binary dummy variable indicating a time-trend
C)lagged dependent variable
D)variable indicating the current time-period
A)variable that increases by 1 for each successive time-period
B)binary dummy variable indicating a time-trend
C)lagged dependent variable
D)variable indicating the current time-period
Unlock Deck
Unlock for access to all 38 flashcards in this deck.
Unlock Deck
k this deck
19
A given time-series is said to have a time-trend if
A)an unexpected shift in time-series data.
B)the data trend upward or downward over time.
C)a number of outliers in cross-section data.
D)an independent variable is correlated with the dependent variable but there is no theoretical justification for the relationship.
A)an unexpected shift in time-series data.
B)the data trend upward or downward over time.
C)a number of outliers in cross-section data.
D)an independent variable is correlated with the dependent variable but there is no theoretical justification for the relationship.
Unlock Deck
Unlock for access to all 38 flashcards in this deck.
Unlock Deck
k this deck
20
A static time-series model _______ for the time dependence of the data.
A)is estimated by OLS with no controls
B)includes lagged dependent variables to control
C)includes lagged independent variables to control
D)includes weighted residuals to control
A)is estimated by OLS with no controls
B)includes lagged dependent variables to control
C)includes lagged independent variables to control
D)includes weighted residuals to control
Unlock Deck
Unlock for access to all 38 flashcards in this deck.
Unlock Deck
k this deck
21
What does it mean to de-trend your data? How can you do so? Explain.
Unlock Deck
Unlock for access to all 38 flashcards in this deck.
Unlock Deck
k this deck
22
What is a time-trend? Why is it important to control for a time-trend if it is present in the data? How can you test and control for a time-trend in your data? Explain.
Unlock Deck
Unlock for access to all 38 flashcards in this deck.
Unlock Deck
k this deck
23
What is a static time-series model? Why might you prefer to estimate a more-advanced time-series model? Explain.
Unlock Deck
Unlock for access to all 38 flashcards in this deck.
Unlock Deck
k this deck
24
What is spurious correlation? Why is it important to consider whether spurious correlation exists? How can you do so? Explain.
Unlock Deck
Unlock for access to all 38 flashcards in this deck.
Unlock Deck
k this deck
25
What does it mean for a time-series to be weakly dependent? Why is this desirable? Explain.
Unlock Deck
Unlock for access to all 38 flashcards in this deck.
Unlock Deck
k this deck
26
Suppose you include a time trend in your model of U.S.Personal Consumption Expenditures (billions)on U.S.Personal Income (billions)using quarterly data for the period 1969Q1-2013Q3 and you get
a)Explain how to create the time trend variable.
b)Interpret the time trend variable and comment if it is statistically significant.
c)Explain how to detrend both the dependent and independent variable.
a)Explain how to create the time trend variable.
b)Interpret the time trend variable and comment if it is statistically significant.
c)Explain how to detrend both the dependent and independent variable.
Unlock Deck
Unlock for access to all 38 flashcards in this deck.
Unlock Deck
k this deck
27
Suppose you estimate a distributed lag model of U.S.Personal Consumption Expenditures (billions)on U.S.Personal Income (billions)using quarterly data for the period 1969Q1-2013Q3 and you get
a)What is this model called? Why would you estimate this type of function?
b)Are the lags individually significant at the 5% level?
c)What do your results in part b imply about your preferred model?
a)What is this model called? Why would you estimate this type of function?
b)Are the lags individually significant at the 5% level?
c)What do your results in part b imply about your preferred model?
Unlock Deck
Unlock for access to all 38 flashcards in this deck.
Unlock Deck
k this deck
28
Suppose you include seasonality controls in your model of U.S.Personal Consumption Expenditures (billions)on U.S.Personal Income (billions)using quarterly data for the period 1969Q1-2013Q3 and you get
d)Explain how you would create Q2t,Q3t,and Q4t.
e)Interpret the coefficients on Q2t,Q3t,and Q4t and comment on their statistical significance.
d)Explain how you would create Q2t,Q3t,and Q4t.
e)Interpret the coefficients on Q2t,Q3t,and Q4t and comment on their statistical significance.
Unlock Deck
Unlock for access to all 38 flashcards in this deck.
Unlock Deck
k this deck
29
What is forecasting? How do you perform it? How can you test the potential validity of your forecasts? Explain.
Unlock Deck
Unlock for access to all 38 flashcards in this deck.
Unlock Deck
k this deck
30
How does time-series data differ from cross-section data? Why is this difference important? Explain.
Unlock Deck
Unlock for access to all 38 flashcards in this deck.
Unlock Deck
k this deck
31
What is a distributed lag model? Why is it preferable to a static time-series model? Explain.
Unlock Deck
Unlock for access to all 38 flashcards in this deck.
Unlock Deck
k this deck
32
What are the assumptions required for OLS to be BLUE for time-series data? Write out and explain each.
Unlock Deck
Unlock for access to all 38 flashcards in this deck.
Unlock Deck
k this deck
33
What is a structural break in the data? Why is it important to control for a structural break if one occurs? How can you test and control for a structural break in your data? Explain.
Unlock Deck
Unlock for access to all 38 flashcards in this deck.
Unlock Deck
k this deck
34
Suppose you estimate a static time-series model of U.S.Personal Consumption Expenditures (billions)on U.S.Personal Income (billions)using quarterly data for the period 1969Q1-2013Q3 and you get
a)How do you interpret the estimated sample regression function? Explain.
b)You wonder if previous values of income affect consumption.Explain how you would estimate a distributed lag model of order 2.
c)Using the model in part c,how would you test for a statistical relationship between past values of income and consumption?
d)If you thought there was a structural break in these data in 2006Q1,how would you control and test for it?
Unlock Deck
Unlock for access to all 38 flashcards in this deck.
Unlock Deck
k this deck
35
What does it mean for a time-series to be stationary? Why is this desirable? Explain.
Unlock Deck
Unlock for access to all 38 flashcards in this deck.
Unlock Deck
k this deck
36
What is seasonality? When might you expect seasonality to occur? Why is it important to control for a seasonality if it is present in the data? How can you test and control for a seasonality in your data? Explain.
Unlock Deck
Unlock for access to all 38 flashcards in this deck.
Unlock Deck
k this deck
37
You can perform forecasting by
A)making an educated guess as to what the value of the dependent variable will be at some point in the future.
B)regression future dependent variables of future independent variables.
C)using the results of regression analysis to predict the value of the dependent variable will be at some point in the future.
D)using the results of regression analysis to predict the value of the dependent variable in a past period and comparing the predicted value to the actual value.
Unlock Deck
Unlock for access to all 38 flashcards in this deck.
Unlock Deck
k this deck
38
You can perform out-of-sample prediction by estimating the sample regression function for
A)all of the data,using the results to predict outcomes for all of the data,and comparing the predicted outcomes to the actual outcomes.
B)a subset of the data,using the results to predict outcomes for all of the data,and comparing the predicted outcomes to the actual outcomes.
C)all of the data,using the results to predict outcomes for a subset of the data,and comparing the predicted outcomes to the actual outcomes.
D)a subset of the data,using the results to predict outcomes for the subset not included in the regression,and comparing the predicted outcomes to the actual outcomes.
Unlock Deck
Unlock for access to all 38 flashcards in this deck.
Unlock Deck
k this deck
Unlock Deck
Unlock for access to all 38 flashcards in this deck.


