Deck 7: Qualitative Variables and Non-Linearities in Multiple Linear Regression Analysis
Full screen (f)
Question
Suppose you estimate the sample regression function 
You would conclude that,holding age constant,the average test score for juniors is _____ than the average test score for seniors.
A)4.82 less
B)4.82 more
C)56.78 less
D)56.78 more
You would conclude that,holding age constant,the average test score for juniors is _____ than the average test score for seniors.
A)4.82 less
B)4.82 more
C)56.78 less
D)56.78 more
Question
Suppose you estimate the sample regression function 
You should conclude that the marginal effect of unemployment on violent crime is
A)the same in cities and suburbs.
B)higher in cities than in suburbs.
C)lower in cities than in suburbs.
D)possibly different in cities and suburbs but we cannot tell from this regression.
You should conclude that the marginal effect of unemployment on violent crime is
A)the same in cities and suburbs.
B)higher in cities than in suburbs.
C)lower in cities than in suburbs.
D)possibly different in cities and suburbs but we cannot tell from this regression.
Question
Question
Suppose you estimate the sample regression function 
You should conclude that the marginal effect of time taken on midterm score reaches its maximum at _____ minutes taken.
A)62.33
B)60.79
C)121.58
D)4.582
You should conclude that the marginal effect of time taken on midterm score reaches its maximum at _____ minutes taken.
A)62.33
B)60.79
C)121.58
D)4.582
Question
Suppose you estimate the sample regression function 
You should conclude that,holding age constant,students with brown eyes average
A)6.32 points less than students with blue eyes.
B)6.32 points more than students with blue eyes.
C)6.32 points less than other students.
D)6.32 points more than other students.
You should conclude that,holding age constant,students with brown eyes average
A)6.32 points less than students with blue eyes.
B)6.32 points more than students with blue eyes.
C)6.32 points less than other students.
D)6.32 points more than other students.
Question
Suppose you estimate the sample regression function 
You would conclude that,holding age constant,the average test score for seniors is
A)4.82.
B)56.78.
C)61.60.
D)69.14.
You would conclude that,holding age constant,the average test score for seniors is
A)4.82.
B)56.78.
C)61.60.
D)69.14.
Question
Suppose you estimate the sample regression function 
You should conclude that the marginal effect of unemployment on violent crime in suburbs is
A)-4.87.
B)6.11.
C)-1.30.
D)4.81.
You should conclude that the marginal effect of unemployment on violent crime in suburbs is
A)-4.87.
B)6.11.
C)-1.30.
D)4.81.
Question
Suppose you estimate the sample regression function 
You should conclude that the marginal effect of time taken on midterm score is
A)4.62.
B)-0.038.
C)4.62 - 0.038.
D)4.62 - 0.076 ∙ Time Taken.
You should conclude that the marginal effect of time taken on midterm score is
A)4.62.
B)-0.038.
C)4.62 - 0.038.
D)4.62 - 0.076 ∙ Time Taken.
Question
Question
Suppose you estimate the sample regression function 
You would conclude that,holding age constant,the average test score for juniors is
A)4.82.
B)56.78.
C)61.60.
D)69.14.
You would conclude that,holding age constant,the average test score for juniors is
A)4.82.
B)56.78.
C)61.60.
D)69.14.
Question
Question
Question
Question
Question
Suppose you estimate the sample regression function 
You should conclude that the marginal effect of time taken on midterm score is _____ for a student going from 48 minutes to 49 minutes to complete the exam.
A)0.972
B)4.582
C)4.62
D)221.76
You should conclude that the marginal effect of time taken on midterm score is _____ for a student going from 48 minutes to 49 minutes to complete the exam.
A)0.972
B)4.582
C)4.62
D)221.76
Question
Question
Suppose you estimate the sample regression function 
You should conclude that,when age is equal to zero,students with blue eyes average
A)6.32 points less than students with brown eyes.
B)61.13 points.
C)2.57 points more than students with green eyes.
D)1.48 points more than students with other-colored eyes.
You should conclude that,when age is equal to zero,students with blue eyes average
A)6.32 points less than students with brown eyes.
B)61.13 points.
C)2.57 points more than students with green eyes.
D)1.48 points more than students with other-colored eyes.
Question
Suppose you estimate the sample regression function 
You should conclude that,when age is equal to zero,students with other eye colors average
A)61.13 points.
B)1.48 points.
C)62.61 points.
D)59.65 points.
You should conclude that,when age is equal to zero,students with other eye colors average
A)61.13 points.
B)1.48 points.
C)62.61 points.
D)59.65 points.
Question
Question
Question
Suppose you estimate the sample multiple linear regression function 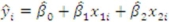
where x2i is a binary dummy variable equal to 1 if the individual possess a given characteristic and 0 if he or she does not.Demonstrate and explain how to interpret
.
where x2i is a binary dummy variable equal to 1 if the individual possess a given characteristic and 0 if he or she does not.Demonstrate and explain how to interpret
.
Question
Suppose you are a human resources manager at a large corporation and that you are interested in determining whether a specific training program increases the worker productivity enough to justify its implementation.In an effort to test your theory,you collect data on 672 workers,284 who participated in the training program and 388 who did not,with the dependent variable being measured worker productivity and independent variables being AGE,EXPERIENCE,EXPERIENCE SQUARED,EDUCATION,HOURS WORKED,and whether the individual PARTICIPATED in the training program.Suppose that you estimate the sample regression function (standard errors in parentheses) 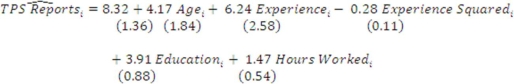
a)Draw a graph with TPS Reports on the y-axis and EXPERIENCE in the x-axis assuming that experience goes from 0 to 22.
b)What is the marginal effect of experience in general? What is the marginal effect of experience for an employee going from 2 to 3 years? How about the marginal effect going from 15 to 16 years?
c)Where does experience reach a maximum?
Question
Suppose you are a potential college student that is interested in determining whether it is worthwhile to declare a certain major.In an effort to find the answer,you collect data on 1,247 college who majored in HUMANITIES,SCIENCE,ENGINEERING,or ENGLISH and you estimate the sample regression function (standard errors in parentheses) 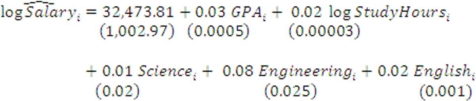
a)Interpret the coefficient estimate on GPA.Is this estimate statistically significant at a 5% level? Economically significant?
b)Interpret the coefficient estimate on Study Hours.Is this estimate statistically significant at the 5% level? Economically significant?
c)Interpret the coefficient estimates on SCIENCE,ENGINEERING,and ENGLISH.Are these estimates statistically significant at the 5% level? Economically significant?
d)Do you believe this is a reasonable model if you are interested in how GPA and Study hours affect Salaries? Why or why not?
Question
Question
Suppose you estimate the sample regression function 
You should conclude that
A)a $1 increase in the solar system tax rate is associated with 0.112 fewer solar system sales.
B)a 1 percent increase in the solar system tax rate is associated with a 0.112 percent decrease in solar system sales.
C)a 1 dollar increase in the solar system tax rate is associated with 11.2 fewer solar system sales.
D)a $1 increase in the solar system tax rate is associated with a 0.112 percent decrease in solar system sales.
Question
Question
Question
Suppose you estimate the sample multiple linear regression function 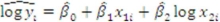
.
Explain how to interpret
.
.
Explain how to interpret
.
Question
Suppose you estimate the sample multiple linear regression function 
.
What is the estimated marginal effect of x1? x2? Explain.
.
What is the estimated marginal effect of x1? x2? Explain.
Question
Suppose you estimate the sample regression function 
You should conclude that a
A)$1 increase in the solar system tax rate is associated with 3.78 fewer solar system sales.
B)1 percent increase in the solar system tax rate is associated with a 3.78 percent decrease in solar system sales.
C)1 percent increase in the solar system tax rate is associated with 3.78 fewer solar system sales.
D)$1 increase in the solar system tax rate is associated with a 3.78 percent decrease in solar system sales.
Question
Question
Question
Suppose you estimate the sample multiple linear regression function 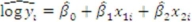
.
Explain how to interpret each of the estimated coefficients.
.
Explain how to interpret each of the estimated coefficients.
Question
Question
Suppose you estimate the sample multiple linear regression function 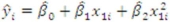
.
What is the estimated marginal effect of x1? Explain.
.
What is the estimated marginal effect of x1? Explain.
Question
Question
Suppose you are a human resources manager at a large corporation and that you are interested in determining whether a specific training program increases worker productivity (as measured by the number of TPS reports completed)enough to justify its implementation.In an effort to test your theory,you collect data on 672 workers,284 who participated in the training program and 388 who did not,with the dependent variable being measured worker productivity and independent variables being HOURS WORKED,and whether the individual PARTICIPATED in the training program (PARTICIPATED = 1 if the worker participated and 0 if they didn't).Suppose that you estimate the sample regression function (standard errors in parentheses) 
a)How should you interpret the estimated coefficient for PARTICIPATED? Draw a graph and explain.
b)Comment on the statistical significance of the coefficients.
c)How would you change the regression model to account for the possibility that the marginal effect of HOURS WORKED differs for those who participated in the training program and those who don't.Write down the model and explain how to interpret the slope coefficients.
d)How would the coefficient estimates change if you coded PARTICIPATED as 0 and DON'T PARTICIPATE as a 1?
Question
Suppose you are a potential college student that is interested in determining whether it is worthwhile to declare a certain major.In an effort to find the answer,you collect data on 1,247 college graduates who majored in HUMANITIES,SCIENCE,ENGINEERING,or ENGLISH and you estimate the sample regression function (standard errors in parentheses) 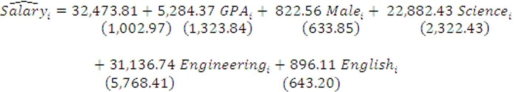
a)How should you interpret the estimated coefficients for SCIENCE,ENGINEERING,and ENGLISH? Draw a graph and explain.
b)How should you interpret the estimated coefficient for MALE?
c)Are the variables statistical significant at a 5% level?
d)Explain,in as much detail as possible,why the following model is not preferred to the original model.
Question
Question

Unlock Deck
Sign up to unlock the cards in this deck!
Unlock Deck
Unlock Deck
1/40
Play
Full screen (f)
Deck 7: Qualitative Variables and Non-Linearities in Multiple Linear Regression Analysis
1
Suppose you estimate the sample regression function
You would conclude that,holding age constant,the average test score for juniors is _____ than the average test score for seniors.
A)4.82 less
B)4.82 more
C)56.78 less
D)56.78 more
You would conclude that,holding age constant,the average test score for juniors is _____ than the average test score for seniors.
A)4.82 less
B)4.82 more
C)56.78 less
D)56.78 more
A
2
Suppose you estimate the sample regression function
You should conclude that the marginal effect of unemployment on violent crime is
A)the same in cities and suburbs.
B)higher in cities than in suburbs.
C)lower in cities than in suburbs.
D)possibly different in cities and suburbs but we cannot tell from this regression.
You should conclude that the marginal effect of unemployment on violent crime is
A)the same in cities and suburbs.
B)higher in cities than in suburbs.
C)lower in cities than in suburbs.
D)possibly different in cities and suburbs but we cannot tell from this regression.
B
3
Suppose you have data on standardized test scores for a sample of high school juniors and seniors.You could test for the possibility that senior outperform juniors,holding all other independent variables constant,by
A)directly entering junior and senior into your regression.
B)including a binary dummy variable that is equal to 1 for seniors and 0 for juniors in your regression.
C)including quadratic terms for junior and senior in your regression.
D)estimating separate regressions for juniors and seniors.
A)directly entering junior and senior into your regression.
B)including a binary dummy variable that is equal to 1 for seniors and 0 for juniors in your regression.
C)including quadratic terms for junior and senior in your regression.
D)estimating separate regressions for juniors and seniors.
B
4
Suppose you estimate the sample regression function
You should conclude that the marginal effect of time taken on midterm score reaches its maximum at _____ minutes taken.
A)62.33
B)60.79
C)121.58
D)4.582
You should conclude that the marginal effect of time taken on midterm score reaches its maximum at _____ minutes taken.
A)62.33
B)60.79
C)121.58
D)4.582
Unlock Deck
Unlock for access to all 40 flashcards in this deck.
Unlock Deck
k this deck
5
Suppose you estimate the sample regression function
You should conclude that,holding age constant,students with brown eyes average
A)6.32 points less than students with blue eyes.
B)6.32 points more than students with blue eyes.
C)6.32 points less than other students.
D)6.32 points more than other students.
You should conclude that,holding age constant,students with brown eyes average
A)6.32 points less than students with blue eyes.
B)6.32 points more than students with blue eyes.
C)6.32 points less than other students.
D)6.32 points more than other students.
Unlock Deck
Unlock for access to all 40 flashcards in this deck.
Unlock Deck
k this deck
6
Suppose you estimate the sample regression function
You would conclude that,holding age constant,the average test score for seniors is
A)4.82.
B)56.78.
C)61.60.
D)69.14.
You would conclude that,holding age constant,the average test score for seniors is
A)4.82.
B)56.78.
C)61.60.
D)69.14.
Unlock Deck
Unlock for access to all 40 flashcards in this deck.
Unlock Deck
k this deck
7
Suppose you estimate the sample regression function
You should conclude that the marginal effect of unemployment on violent crime in suburbs is
A)-4.87.
B)6.11.
C)-1.30.
D)4.81.
You should conclude that the marginal effect of unemployment on violent crime in suburbs is
A)-4.87.
B)6.11.
C)-1.30.
D)4.81.
Unlock Deck
Unlock for access to all 40 flashcards in this deck.
Unlock Deck
k this deck
8
Suppose you estimate the sample regression function
You should conclude that the marginal effect of time taken on midterm score is
A)4.62.
B)-0.038.
C)4.62 - 0.038.
D)4.62 - 0.076 ∙ Time Taken.
You should conclude that the marginal effect of time taken on midterm score is
A)4.62.
B)-0.038.
C)4.62 - 0.038.
D)4.62 - 0.076 ∙ Time Taken.
Unlock Deck
Unlock for access to all 40 flashcards in this deck.
Unlock Deck
k this deck
9
Suppose you wish to explain student midterm scores by time taken to complete the exam and you are concerned that the marginal effect of time taken differs depending on the amount of time taken in a quadratic manner.You could control for this possibility by estimating the population regression function
A)Midterm Score = β0 + β1 ∙ Time Taken + ε.
B)Midterm Score = β0 + β1 ∙ Time Taken2 + ε.
C)Midterm Score = β0 + β1 ∙ Time Taken + β2 ∙ Time Taken2 + ε.
D)Midterm Score = β0 + β1 ∙ Time Taken + β2 ∙ Time Taken2 + β3 ∙ Time Taken3 + ε.
A)Midterm Score = β0 + β1 ∙ Time Taken + ε.
B)Midterm Score = β0 + β1 ∙ Time Taken2 + ε.
C)Midterm Score = β0 + β1 ∙ Time Taken + β2 ∙ Time Taken2 + ε.
D)Midterm Score = β0 + β1 ∙ Time Taken + β2 ∙ Time Taken2 + β3 ∙ Time Taken3 + ε.
Unlock Deck
Unlock for access to all 40 flashcards in this deck.
Unlock Deck
k this deck
10
Suppose you estimate the sample regression function
You would conclude that,holding age constant,the average test score for juniors is
A)4.82.
B)56.78.
C)61.60.
D)69.14.
You would conclude that,holding age constant,the average test score for juniors is
A)4.82.
B)56.78.
C)61.60.
D)69.14.
Unlock Deck
Unlock for access to all 40 flashcards in this deck.
Unlock Deck
k this deck
11
Interaction terms between dummy variables and quantitative variables allow the estimated _____ to differ for different groups.
A)slope
B)intercept
C)quadratic effect
D)parameter
A)slope
B)intercept
C)quadratic effect
D)parameter
Unlock Deck
Unlock for access to all 40 flashcards in this deck.
Unlock Deck
k this deck
12
Suppose you are interested in controlling for a student's eye color in a regression explaining variation in standardized test scores.If eye color is defined as Blue,Green,Brown,or Other then how many dummy variables should you include in your analysis?
A)1.
B)2.
C)3.
D)4.
A)1.
B)2.
C)3.
D)4.
Unlock Deck
Unlock for access to all 40 flashcards in this deck.
Unlock Deck
k this deck
13
Log-linear regressions
A)allow the estimated marginal effect to differ at different values of the dependent variable.
B)estimate the marginal effect as an elasticity.
C)estimate the marginal effect in terms of a unit change in the independent variable yielding a percentage change in the dependent variable.
D)estimate the marginal effect in terms of a percent change in the independent variable yielding a percentage change in the dependent variable.
Unlock Deck
Unlock for access to all 40 flashcards in this deck.
Unlock Deck
k this deck
14
Binary dummy variables allow the estimated _____ to differ for different groups.
A)slope
B)intercept
C)marginal effect
D)interaction effect
A)slope
B)intercept
C)marginal effect
D)interaction effect
Unlock Deck
Unlock for access to all 40 flashcards in this deck.
Unlock Deck
k this deck
15
Suppose you estimate the sample regression function
You should conclude that the marginal effect of time taken on midterm score is _____ for a student going from 48 minutes to 49 minutes to complete the exam.
A)0.972
B)4.582
C)4.62
D)221.76
You should conclude that the marginal effect of time taken on midterm score is _____ for a student going from 48 minutes to 49 minutes to complete the exam.
A)0.972
B)4.582
C)4.62
D)221.76
Unlock Deck
Unlock for access to all 40 flashcards in this deck.
Unlock Deck
k this deck
16
Suppose wish to explain violent crime as a function of city type and unemployment rate and you are concerned that the marginal effect of the unemployment rate might differ for cities and suburbs.You could control for this possibility by
A)including the binary dummy variable Suburb in you regression.
B)interacting the binary dummy variable with the unemployment rate in you regression.
C)including the square of the unemployment rate in you regression.
D)including the binary dummy variable City in your regression.
A)including the binary dummy variable Suburb in you regression.
B)interacting the binary dummy variable with the unemployment rate in you regression.
C)including the square of the unemployment rate in you regression.
D)including the binary dummy variable City in your regression.
Unlock Deck
Unlock for access to all 40 flashcards in this deck.
Unlock Deck
k this deck
17
Suppose you estimate the sample regression function
You should conclude that,when age is equal to zero,students with blue eyes average
A)6.32 points less than students with brown eyes.
B)61.13 points.
C)2.57 points more than students with green eyes.
D)1.48 points more than students with other-colored eyes.
You should conclude that,when age is equal to zero,students with blue eyes average
A)6.32 points less than students with brown eyes.
B)61.13 points.
C)2.57 points more than students with green eyes.
D)1.48 points more than students with other-colored eyes.
Unlock Deck
Unlock for access to all 40 flashcards in this deck.
Unlock Deck
k this deck
18
Suppose you estimate the sample regression function
You should conclude that,when age is equal to zero,students with other eye colors average
A)61.13 points.
B)1.48 points.
C)62.61 points.
D)59.65 points.
You should conclude that,when age is equal to zero,students with other eye colors average
A)61.13 points.
B)1.48 points.
C)62.61 points.
D)59.65 points.
Unlock Deck
Unlock for access to all 40 flashcards in this deck.
Unlock Deck
k this deck
19
Quadratic terms allow the estimated
A)slope to differ for different values of the independent variable.
B)slope to differ for different groups.
C)intercept to differ for different groups.
D)intercept to differ for different values of the independent variable.
A)slope to differ for different values of the independent variable.
B)slope to differ for different groups.
C)intercept to differ for different groups.
D)intercept to differ for different values of the independent variable.
Unlock Deck
Unlock for access to all 40 flashcards in this deck.
Unlock Deck
k this deck
20
Binary dummy variables are used when dealing with
A)quadratic independent variables.
B)quantitative independent variables.
C)qualitative independent variables.
D)continuous independent variables.
A)quadratic independent variables.
B)quantitative independent variables.
C)qualitative independent variables.
D)continuous independent variables.
Unlock Deck
Unlock for access to all 40 flashcards in this deck.
Unlock Deck
k this deck
21
Suppose you estimate the sample multiple linear regression function
where x2i is a binary dummy variable equal to 1 if the individual possess a given characteristic and 0 if he or she does not.Demonstrate and explain how to interpret
.
where x2i is a binary dummy variable equal to 1 if the individual possess a given characteristic and 0 if he or she does not.Demonstrate and explain how to interpret
.
Unlock Deck
Unlock for access to all 40 flashcards in this deck.
Unlock Deck
k this deck
22
Suppose you are a human resources manager at a large corporation and that you are interested in determining whether a specific training program increases the worker productivity enough to justify its implementation.In an effort to test your theory,you collect data on 672 workers,284 who participated in the training program and 388 who did not,with the dependent variable being measured worker productivity and independent variables being AGE,EXPERIENCE,EXPERIENCE SQUARED,EDUCATION,HOURS WORKED,and whether the individual PARTICIPATED in the training program.Suppose that you estimate the sample regression function (standard errors in parentheses)
a)Draw a graph with TPS Reports on the y-axis and EXPERIENCE in the x-axis assuming that experience goes from 0 to 22.
b)What is the marginal effect of experience in general? What is the marginal effect of experience for an employee going from 2 to 3 years? How about the marginal effect going from 15 to 16 years?
c)Where does experience reach a maximum?
Unlock Deck
Unlock for access to all 40 flashcards in this deck.
Unlock Deck
k this deck
23
Suppose you are a potential college student that is interested in determining whether it is worthwhile to declare a certain major.In an effort to find the answer,you collect data on 1,247 college who majored in HUMANITIES,SCIENCE,ENGINEERING,or ENGLISH and you estimate the sample regression function (standard errors in parentheses)
a)Interpret the coefficient estimate on GPA.Is this estimate statistically significant at a 5% level? Economically significant?
b)Interpret the coefficient estimate on Study Hours.Is this estimate statistically significant at the 5% level? Economically significant?
c)Interpret the coefficient estimates on SCIENCE,ENGINEERING,and ENGLISH.Are these estimates statistically significant at the 5% level? Economically significant?
d)Do you believe this is a reasonable model if you are interested in how GPA and Study hours affect Salaries? Why or why not?
Unlock Deck
Unlock for access to all 40 flashcards in this deck.
Unlock Deck
k this deck
24
Log-log regressions
A)allow the estimated marginal effect to differ at different values of the dependent variable.
B)estimate the marginal effect as an elasticity.
C)estimate the marginal effect in terms of the percent change in the independent variable.
D)estimate the marginal effect in terms of the percent change in the dependent variable.
Unlock Deck
Unlock for access to all 40 flashcards in this deck.
Unlock Deck
k this deck
25
Suppose you estimate the sample regression function
You should conclude that
A)a $1 increase in the solar system tax rate is associated with 0.112 fewer solar system sales.
B)a 1 percent increase in the solar system tax rate is associated with a 0.112 percent decrease in solar system sales.
C)a 1 dollar increase in the solar system tax rate is associated with 11.2 fewer solar system sales.
D)a $1 increase in the solar system tax rate is associated with a 0.112 percent decrease in solar system sales.
Unlock Deck
Unlock for access to all 40 flashcards in this deck.
Unlock Deck
k this deck
26
Semi-log regressions
A)allow the estimated marginal effect to differ at different values of the dependent variable.
B)estimate the marginal effect as an elasticity.
C)estimate the marginal effect in terms of the percent change in the independent variable.
D)estimate the marginal effect in terms of the percent change in the dependent variable.
Unlock Deck
Unlock for access to all 40 flashcards in this deck.
Unlock Deck
k this deck
27
When is it appropriate to estimate log-log multiple linear regression models? Provide an example and discuss how the relevant estimates would be correctly interpreted.
Unlock Deck
Unlock for access to all 40 flashcards in this deck.
Unlock Deck
k this deck
28
Suppose you estimate the sample multiple linear regression function
.
Explain how to interpret
.
.
Explain how to interpret
.
Unlock Deck
Unlock for access to all 40 flashcards in this deck.
Unlock Deck
k this deck
29
Suppose you estimate the sample multiple linear regression function
.
What is the estimated marginal effect of x1? x2? Explain.
.
What is the estimated marginal effect of x1? x2? Explain.
Unlock Deck
Unlock for access to all 40 flashcards in this deck.
Unlock Deck
k this deck
30
Suppose you estimate the sample regression function
You should conclude that a
A)$1 increase in the solar system tax rate is associated with 3.78 fewer solar system sales.
B)1 percent increase in the solar system tax rate is associated with a 3.78 percent decrease in solar system sales.
C)1 percent increase in the solar system tax rate is associated with 3.78 fewer solar system sales.
D)$1 increase in the solar system tax rate is associated with a 3.78 percent decrease in solar system sales.
Unlock Deck
Unlock for access to all 40 flashcards in this deck.
Unlock Deck
k this deck
31
Suppose you wish to estimate the degree to which a one dollar increase in the tax on solar power systems affects the percentage of solar power systems sold using state-level data on solar system sales and solar system taxes.You could estimate this effect by regressing the
A)total number of solar systems sold on solar system tax rates.
B)log of total number of solar systems sold on solar system tax rates.
C)log of the total number of solar systems sold on the log of solar system tax rates.
D)log of the total number of solar systems sold on the solar system tax rate.
A)total number of solar systems sold on solar system tax rates.
B)log of total number of solar systems sold on solar system tax rates.
C)log of the total number of solar systems sold on the log of solar system tax rates.
D)log of the total number of solar systems sold on the solar system tax rate.
Unlock Deck
Unlock for access to all 40 flashcards in this deck.
Unlock Deck
k this deck
32
When is it appropriate to include interaction terms in a multiple linear regression? Explain.Provide an example and discuss the interaction term that you would include and how the relevant estimates would be correctly interpreted.
Unlock Deck
Unlock for access to all 40 flashcards in this deck.
Unlock Deck
k this deck
33
Suppose you estimate the sample multiple linear regression function
.
Explain how to interpret each of the estimated coefficients.
.
Explain how to interpret each of the estimated coefficients.
Unlock Deck
Unlock for access to all 40 flashcards in this deck.
Unlock Deck
k this deck
34
When is it appropriate to include binary dummy variables in a multiple linear regression? Explain.Provide an example and discuss the binary dummy variable that you would include and how the relevant estimates would be correctly interpreted.
Unlock Deck
Unlock for access to all 40 flashcards in this deck.
Unlock Deck
k this deck
35
Suppose you estimate the sample multiple linear regression function
.
What is the estimated marginal effect of x1? Explain.
.
What is the estimated marginal effect of x1? Explain.
Unlock Deck
Unlock for access to all 40 flashcards in this deck.
Unlock Deck
k this deck
36
Suppose you wish to estimate the elasticity between solar power systems sales and the tax on solar power systems using state-level data on solar system sales and solar system taxes.You could estimate this effect by regressing the
A)total number of solar systems sold on solar system tax rates.
B)total number of solar systems sold on the log of solar system tax rates.
C)log of the total number of solar systems sold on the log of solar system tax rates.
D)log of the total number of solar systems sold on the solar system tax rate.
Unlock Deck
Unlock for access to all 40 flashcards in this deck.
Unlock Deck
k this deck
37
Suppose you are a human resources manager at a large corporation and that you are interested in determining whether a specific training program increases worker productivity (as measured by the number of TPS reports completed)enough to justify its implementation.In an effort to test your theory,you collect data on 672 workers,284 who participated in the training program and 388 who did not,with the dependent variable being measured worker productivity and independent variables being HOURS WORKED,and whether the individual PARTICIPATED in the training program (PARTICIPATED = 1 if the worker participated and 0 if they didn't).Suppose that you estimate the sample regression function (standard errors in parentheses)
a)How should you interpret the estimated coefficient for PARTICIPATED? Draw a graph and explain.
b)Comment on the statistical significance of the coefficients.
c)How would you change the regression model to account for the possibility that the marginal effect of HOURS WORKED differs for those who participated in the training program and those who don't.Write down the model and explain how to interpret the slope coefficients.
d)How would the coefficient estimates change if you coded PARTICIPATED as 0 and DON'T PARTICIPATE as a 1?
Unlock Deck
Unlock for access to all 40 flashcards in this deck.
Unlock Deck
k this deck
38
Suppose you are a potential college student that is interested in determining whether it is worthwhile to declare a certain major.In an effort to find the answer,you collect data on 1,247 college graduates who majored in HUMANITIES,SCIENCE,ENGINEERING,or ENGLISH and you estimate the sample regression function (standard errors in parentheses)
a)How should you interpret the estimated coefficients for SCIENCE,ENGINEERING,and ENGLISH? Draw a graph and explain.
b)How should you interpret the estimated coefficient for MALE?
c)Are the variables statistical significant at a 5% level?
d)Explain,in as much detail as possible,why the following model is not preferred to the original model.
Unlock Deck
Unlock for access to all 40 flashcards in this deck.
Unlock Deck
k this deck
39
When is it appropriate to include quadratic terms in a multiple linear regression? Provide an example and discuss the quadratic term that you would include and how the relevant estimates would be correctly interpreted.
Unlock Deck
Unlock for access to all 40 flashcards in this deck.
Unlock Deck
k this deck
40
When is it appropriate to estimate log-linear multiple linear regression models? Provide an example and discuss how the relevant estimates would be correctly interpreted.
Unlock Deck
Unlock for access to all 40 flashcards in this deck.
Unlock Deck
k this deck
Unlock Deck
Unlock for access to all 40 flashcards in this deck.


