Deck 13: Pearson Correlation and Regression: Inferential Aspects
Full screen (f)
Question
Question
Question
Question
Question
Imagine you are interested in researching the relationship between job experience and income among early-career working professionals.You take a random sample of 32 professionals from the nearest city,and you ask them to report their annual income and submit a resumé outlining their professional experience.You later calculate their years of experience from their resumés.You compute the following information: 
What is the observed t-value for testing the null hypothesis?
A)6.96
B)2.78
C)2.86
D)1.87
What is the observed t-value for testing the null hypothesis?
A)6.96
B)2.78
C)2.86
D)1.87
Question
Question
Question
Question
Question
Imagine you are interested in researching the relationship between job experience and income among early-career working professionals.You take a random sample of 32 professionals from the nearest city,and you ask them to report their annual income and submit a resumé outlining their professional experience.You later calculate their years of experience from their resumés.You compute the following information: 
If you were to calculate a 95% confidence interval for this correlation coefficient,you would find that it ranges from .11 to .70.How should this interval be interpreted?
A)There is A.95 probability that r falls between .11 and .70
B)There is a .95 probability that r falls outside the range of .11 to .70
C)There is a.95 probability that r falls between .11 and .70.
D)There is a .95 probability that r falls outside the range of .11 to .70.
Question
Question
Question
Question
Question
Question
Question
Imagine you are interested in researching the relationship between job experience and income among early-career working professionals.You take a random sample of 32 professionals from the nearest city,and you ask them to report their annual income and submit a resumé outlining their professional experience.You later calculate their years of experience from their resumés.You compute the following information: 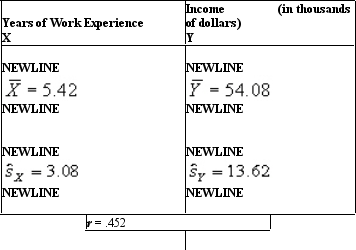
Assume,for the above example,that you calculated the estimated standard error of the estimate to be,11.20.How should this standard error of the estimate be interpreted?
A)It gives you an indication of the inaccuracy in predicting income from years of experience.
B)It gives you an indication of the inaccuracy in predicting years of experience from income.
C)Both a and b
D)Neither a nor b
Question
Imagine you are interested in researching the relationship between job experience and income among early-career working professionals.You take a random sample of 32 professionals from the nearest city,and you ask them to report their annual income and submit a resumé outlining their professional experience.You later calculate their years of experience from their resumés.You compute the following information: 
How would you state the null hypothesis for this test?
A)r ¹ 0
B)r = 0
C)r = r
D)r1 = r2
How would you state the null hypothesis for this test?
A)r ¹ 0
B)r = 0
C)r = r
D)r1 = r2
Question
Imagine you are interested in researching the relationship between job experience and income among early-career working professionals.You take a random sample of 32 professionals from the nearest city,and you ask them to report their annual income and submit a resumé outlining their professional experience.You later calculate their years of experience from their resumés.You compute the following information: 
After comparing the observed correlation to the critical values of 2.042,what would your conclusion be regarding the "true" correlation in the population (r)?
A)r most likely differed from zero because of sampling error
B)You are confident that r does not equal zero
C)It is likely that r1 ¹ r2
D)There is a weak relationship between work experience and income
Question
Question
Question
Question
Question
Question
Question
Question
Question
Question
Question
When ñ 
0,the sampling distribution of the correlation coefficient is skewed.
0,the sampling distribution of the correlation coefficient is skewed.
Question
Question
The estimated standard error of estimate ( 
XY)differs from the standard error of estimate (sXY)in that
A)
XY has N - 2 in the denominator,while sXY has N - 1 in the denominator
B)
XY has N in the denominator,while sXY has N - 2 in the denominator
C)
XY has N - 2 in the denominator,while sXY has N in the denominator
D)
XY has N - 1 in the denominator,while sXY has N - 2 in the denominator
Question
Question
Question
Question
Question
Question
Question
Question
Question
Question
Question
Question
Question
Question
Question
Question
Question
Question
Question
Question
Question
Question
Question
Question
Question
Question
Question
Question
Question
Question
Question
Question
Question
Question
Question
Question
Question
Question
Question
Question
Question
Question
Question
Question
Question
Question
Question
Question

Unlock Deck
Sign up to unlock the cards in this deck!
Unlock Deck
Unlock Deck
1/143
Play
Full screen (f)
Deck 13: Pearson Correlation and Regression: Inferential Aspects
1
The assumption of bivariate normality refers to
A)the variances of the Y scores being equal at every value of X in the population.
B)the sample being independently and randomly selected from the population.
C)the population distributions of X and Y each being normal in shape.
D)the requirement that the distribution of Y scores be normal in the population at every value of X.
the requirement that the distribution of Y scores be normal in the population at every value of X.
2
An important characteristic of regression is that _____ can be extended to individuals who were not included in the original data set.
A)correlated errors
B)missing data
C)sample means
D)predictions
A)correlated errors
B)missing data
C)sample means
D)predictions
predictions
3
If you compute a statistically significant negative r between two variables (X and Y),this tells you that _____.
A)higher scores on X are associated with higher scores on Y
B)X and Y are unrelated to each other in the population
C)higher scores on X are associated with lower scores on Y
D)you have made a computational error
A)higher scores on X are associated with higher scores on Y
B)X and Y are unrelated to each other in the population
C)higher scores on X are associated with lower scores on Y
D)you have made a computational error
higher scores on X are associated with higher scores on Y
4
If you compute a statistically significant negative r between two variables (X and Y),this tells you that _____.
A)higher scores on X are associated with higher scores on Y
B)X and Y are unrelated to each other in the population
C)higher scores on X are associated with lower scores on Y
D)you have made a computational error
A)higher scores on X are associated with higher scores on Y
B)X and Y are unrelated to each other in the population
C)higher scores on X are associated with lower scores on Y
D)you have made a computational error
Unlock Deck
Unlock for access to all 143 flashcards in this deck.
Unlock Deck
k this deck
5
Imagine you are interested in researching the relationship between job experience and income among early-career working professionals.You take a random sample of 32 professionals from the nearest city,and you ask them to report their annual income and submit a resumé outlining their professional experience.You later calculate their years of experience from their resumés.You compute the following information:
What is the observed t-value for testing the null hypothesis?
A)6.96
B)2.78
C)2.86
D)1.87
What is the observed t-value for testing the null hypothesis?
A)6.96
B)2.78
C)2.86
D)1.87
Unlock Deck
Unlock for access to all 143 flashcards in this deck.
Unlock Deck
k this deck
6
In the context of regression,the variable being predicted,Y,is formally known as the dependent or _____ variable;the variable from which predictions are made,X ,is formally known as the independent or _____ variable.
A)confounding;disturbance
B)exogenous;predictor
C)criterion;predictor
D)predictor;criterion
A)confounding;disturbance
B)exogenous;predictor
C)criterion;predictor
D)predictor;criterion
Unlock Deck
Unlock for access to all 143 flashcards in this deck.
Unlock Deck
k this deck
7
What is the technical term/phrase that is used to describe the problem in the previous question?
A)Presence of outliers
B)Restriction of range
C)Measurement error
D)Standard deviation envy
A)Presence of outliers
B)Restriction of range
C)Measurement error
D)Standard deviation envy
Unlock Deck
Unlock for access to all 143 flashcards in this deck.
Unlock Deck
k this deck
8
The traditional null hypothesis for the inferential test of a correlation coefficient states that the correlation in the population (r)_____.
A)does not equal 0
B)equals 0
C)is greater than 0
D)equals 1.00
A)does not equal 0
B)equals 0
C)is greater than 0
D)equals 1.00
Unlock Deck
Unlock for access to all 143 flashcards in this deck.
Unlock Deck
k this deck
9
What does the estimated standard error of the estimate represent?
A)The standard deviation of the cross products for X and Y
B)The degree to which outliers are influencing your correlation coefficient
C)The degree to which restricted range has influenced your prediction of Y from X
D)Average error when using the regression equation to predict Y from X
A)The standard deviation of the cross products for X and Y
B)The degree to which outliers are influencing your correlation coefficient
C)The degree to which restricted range has influenced your prediction of Y from X
D)Average error when using the regression equation to predict Y from X
Unlock Deck
Unlock for access to all 143 flashcards in this deck.
Unlock Deck
k this deck
10
Imagine you are interested in researching the relationship between job experience and income among early-career working professionals.You take a random sample of 32 professionals from the nearest city,and you ask them to report their annual income and submit a resumé outlining their professional experience.You later calculate their years of experience from their resumés.You compute the following information:
If you were to calculate a 95% confidence interval for this correlation coefficient,you would find that it ranges from .11 to .70.How should this interval be interpreted?
A)There is A.95 probability that r falls between .11 and .70
B)There is a .95 probability that r falls outside the range of .11 to .70
C)There is a.95 probability that r falls between .11 and .70.
D)There is a .95 probability that r falls outside the range of .11 to .70.
Unlock Deck
Unlock for access to all 143 flashcards in this deck.
Unlock Deck
k this deck
11
Which of the following is NOT one of the assumptions of the Pearson correlation?
A)The sample is independently and randomly selected from the population.
B)The variances of the Y scores are equal at every value of X in the population.
C)The variables X and Y are qualitative in nature.
D)The joint distribution (or scatterplot)of X and Y represent a bivariate normal distribution.
A)The sample is independently and randomly selected from the population.
B)The variances of the Y scores are equal at every value of X in the population.
C)The variables X and Y are qualitative in nature.
D)The joint distribution (or scatterplot)of X and Y represent a bivariate normal distribution.
Unlock Deck
Unlock for access to all 143 flashcards in this deck.
Unlock Deck
k this deck
12
In general,if you find a statistically significant r,what can you directly conclude about the regression line?
A)The intercept of the regression line is large.
B)The slope of the regression line is positive.
C)The slope of the regression line is negative.
D)The slope of the regression line is not zero.
A)The intercept of the regression line is large.
B)The slope of the regression line is positive.
C)The slope of the regression line is negative.
D)The slope of the regression line is not zero.
Unlock Deck
Unlock for access to all 143 flashcards in this deck.
Unlock Deck
k this deck
13
The Pearson correlation technique may be used to measure _____ relationships when both X and Y are _____ in nature.
A)curvilinear;qualitative
B)linear;qualitative
C)linear;quantitative
D)curvilinear;quantitative
A)curvilinear;qualitative
B)linear;qualitative
C)linear;quantitative
D)curvilinear;quantitative
Unlock Deck
Unlock for access to all 143 flashcards in this deck.
Unlock Deck
k this deck
14
If we found a correlation of +.32,the calculation of the strength of the relationship (h2)would indicate that we observed a _____ relationship between the two variables.
A)weak
B)moderate
C)strong
D)insufficient information to determine
A)weak
B)moderate
C)strong
D)insufficient information to determine
Unlock Deck
Unlock for access to all 143 flashcards in this deck.
Unlock Deck
k this deck
15
If grade point average (GPA.and number of hours partying per week were related according to the following linear model: GPA = 4.00 - .40(Hours of partying),what GPA would you predict if you partied for 8 hours a week?
A)0.80
B)2.20
C)1.00
D)3.60
A)0.80
B)2.20
C)1.00
D)3.60
Unlock Deck
Unlock for access to all 143 flashcards in this deck.
Unlock Deck
k this deck
16
If you realized that a set of sample data had a lower standard deviation on variable X than is typical for the population,this would create the problem of _____ the apparent strength of association between X and Y for correlation/regression analyses.
A)having an unpredictable effect on
B)increasing/accentuating
C)reducing/attenuating
D)reducing about 95% of the time,and increasing about 5% of the time
A)having an unpredictable effect on
B)increasing/accentuating
C)reducing/attenuating
D)reducing about 95% of the time,and increasing about 5% of the time
Unlock Deck
Unlock for access to all 143 flashcards in this deck.
Unlock Deck
k this deck
17
Imagine you are interested in researching the relationship between job experience and income among early-career working professionals.You take a random sample of 32 professionals from the nearest city,and you ask them to report their annual income and submit a resumé outlining their professional experience.You later calculate their years of experience from their resumés.You compute the following information:
Assume,for the above example,that you calculated the estimated standard error of the estimate to be,11.20.How should this standard error of the estimate be interpreted?
A)It gives you an indication of the inaccuracy in predicting income from years of experience.
B)It gives you an indication of the inaccuracy in predicting years of experience from income.
C)Both a and b
D)Neither a nor b
Unlock Deck
Unlock for access to all 143 flashcards in this deck.
Unlock Deck
k this deck
18
Imagine you are interested in researching the relationship between job experience and income among early-career working professionals.You take a random sample of 32 professionals from the nearest city,and you ask them to report their annual income and submit a resumé outlining their professional experience.You later calculate their years of experience from their resumés.You compute the following information:
How would you state the null hypothesis for this test?
A)r ¹ 0
B)r = 0
C)r = r
D)r1 = r2
How would you state the null hypothesis for this test?
A)r ¹ 0
B)r = 0
C)r = r
D)r1 = r2
Unlock Deck
Unlock for access to all 143 flashcards in this deck.
Unlock Deck
k this deck
19
Imagine you are interested in researching the relationship between job experience and income among early-career working professionals.You take a random sample of 32 professionals from the nearest city,and you ask them to report their annual income and submit a resumé outlining their professional experience.You later calculate their years of experience from their resumés.You compute the following information:
After comparing the observed correlation to the critical values of 2.042,what would your conclusion be regarding the "true" correlation in the population (r)?
A)r most likely differed from zero because of sampling error
B)You are confident that r does not equal zero
C)It is likely that r1 ¹ r2
D)There is a weak relationship between work experience and income
Unlock Deck
Unlock for access to all 143 flashcards in this deck.
Unlock Deck
k this deck
20
A statistically significant direct relationship between self-esteem and optimism would indicate that
A)the higher a person's self-esteem is,the more optimistic he/she is likely to be
B)the higher a person's self-esteem is,the less optimistic he/she is likely to be
C)self-esteem and optimism are unrelated in the population
D)self-esteem causes a person to be more optimistic
A)the higher a person's self-esteem is,the more optimistic he/she is likely to be
B)the higher a person's self-esteem is,the less optimistic he/she is likely to be
C)self-esteem and optimism are unrelated in the population
D)self-esteem causes a person to be more optimistic
Unlock Deck
Unlock for access to all 143 flashcards in this deck.
Unlock Deck
k this deck
21
Which one of the following is NOT a condition under which the Pearson correlation is typically used?
A)Both variables are quantitative in nature and measured on a level that at least approximates interval characteristics.
B)The two variables have been measured on the same individuals.
C)The observations on each variable are within-subjects in nature.
D)All of these are conditions under which the Pearson correlation is typically useD.
Unlock Deck
Unlock for access to all 143 flashcards in this deck.
Unlock Deck
k this deck
22
Based on the Applications to the Analysis of Social Problems section of Chapter 14,a smoothing technique
A)changes the slope of the regression equation to better fit the datA.
B)removes much of the noise from the scatterplot.
C)reduces the intercept of the regression line.
D)increases the absolute value of the correlation coefficient.
E)will increase the probability that the r value will be significant.
Unlock Deck
Unlock for access to all 143 flashcards in this deck.
Unlock Deck
k this deck
23
The Pearson correlation cannot be used to determine the relationship between two variables when _____.
A)both variables are quantitative and on an interval level
B)both variables are measured on the same individuals and are on a ratio level
C)one variable is quantitative and the other is qualitative in nature with three or more levels
D)none of these are exceptions,it can be used in all of these cases
Unlock Deck
Unlock for access to all 143 flashcards in this deck.
Unlock Deck
k this deck
24
A researcher was interested in whether testosterone was related to aggression.Testing 18 male subjects,he found a correlation coefficient of .62.If the standard deviation estimate for Y was 13.2,what is the estimated standard error of estimate?
A)2.94
B)5.17
C)8.63
D)10.68
A)2.94
B)5.17
C)8.63
D)10.68
Unlock Deck
Unlock for access to all 143 flashcards in this deck.
Unlock Deck
k this deck
25
A social psychologist is interested in whether education level is related the number of desired children.She obtains an r value of -.24 with 62 subjects.What can we conclude from this study? Base your answer on whether the correlation is significant or not,using an alpha level of .05,nondirectional test.
A)A higher education level is significantly related to a larger number of desired children.
B)A higher education level is significantly related to a smaller number of desired children.
C)Education level is not significantly related to number of desired children.
D)Cannot be determined
A)A higher education level is significantly related to a larger number of desired children.
B)A higher education level is significantly related to a smaller number of desired children.
C)Education level is not significantly related to number of desired children.
D)Cannot be determined
Unlock Deck
Unlock for access to all 143 flashcards in this deck.
Unlock Deck
k this deck
26
A psychologist believes that arousal level is related to quality of performance.He obtains measures of arousal and performance on a group of 20 people,and finds a correlation coefficient of .430.If the alpha level is .05,nondirectional test,how would this result be reported in a psychological journal?
A)r(18)= .430,p > .05
B)r(19)= .430,p > .05
C)r(20)= .430,p < .05
D)r(20)= .430,p > .05
A)r(18)= .430,p > .05
B)r(19)= .430,p > .05
C)r(20)= .430,p < .05
D)r(20)= .430,p > .05
Unlock Deck
Unlock for access to all 143 flashcards in this deck.
Unlock Deck
k this deck
27
In terms of regression,the criterion variable is ____ while the predictor variable is _____.
A)the variable being predicted;the variable from which predictions are made
B)the variable from which predictions are made;the variable being predicted
C)X;Y
D)both a and c
E)both b and c
A)the variable being predicted;the variable from which predictions are made
B)the variable from which predictions are made;the variable being predicted
C)X;Y
D)both a and c
E)both b and c
Unlock Deck
Unlock for access to all 143 flashcards in this deck.
Unlock Deck
k this deck
28
In the regression equation of a population,the symbol ?
A)is the error score.
B)is the slope.
C)reflects all factors that are uncorrelated with X that influence Y.
D)both a and b
E)both a and c
A)is the error score.
B)is the slope.
C)reflects all factors that are uncorrelated with X that influence Y.
D)both a and b
E)both a and c
Unlock Deck
Unlock for access to all 143 flashcards in this deck.
Unlock Deck
k this deck
29
The nature of the relationship between two correlated variables is determined by
A)calculating r2.
B)examining the slope of the correlation coefficient.
C)examining the sign of the correlation coefficient.
D)calculating Tukey's HSD.
A)calculating r2.
B)examining the slope of the correlation coefficient.
C)examining the sign of the correlation coefficient.
D)calculating Tukey's HSD.
Unlock Deck
Unlock for access to all 143 flashcards in this deck.
Unlock Deck
k this deck
30
When ñ
0,the sampling distribution of the correlation coefficient is skewed.
0,the sampling distribution of the correlation coefficient is skewed.
Unlock Deck
Unlock for access to all 143 flashcards in this deck.
Unlock Deck
k this deck
31
The strength of the relationship in a correlational analysis can be calculated with
A)a ratio of explained variability to total variability.
B)r2
C)the coefficient of determination
D)both a and b
E)all of these
A)a ratio of explained variability to total variability.
B)r2
C)the coefficient of determination
D)both a and b
E)all of these
Unlock Deck
Unlock for access to all 143 flashcards in this deck.
Unlock Deck
k this deck
32
The estimated standard error of estimate (
XY)differs from the standard error of estimate (sXY)in that
A)
XY has N - 2 in the denominator,while sXY has N - 1 in the denominator
B)
XY has N in the denominator,while sXY has N - 2 in the denominator
C)
XY has N - 2 in the denominator,while sXY has N in the denominator
D)
XY has N - 1 in the denominator,while sXY has N - 2 in the denominator
Unlock Deck
Unlock for access to all 143 flashcards in this deck.
Unlock Deck
k this deck
33
If the researcher suspects that the strength of the relationship between two variables in the population is .15,as indexed by the correlation coefficient squared,what sample size should he use in a study involving an alpha level of .05,nondirectional test,in order to achieve a power of .99?
A)97
B)111
C)131
D)145
A)97
B)111
C)131
D)145
Unlock Deck
Unlock for access to all 143 flashcards in this deck.
Unlock Deck
k this deck
34
A researcher was interested in whether testosterone was related to aggression.Testing 18 male subjects,he found a correlation coefficient of .62.What is the coefficient of determination?
A).15
B).38
C).3844
D).62
A).15
B).38
C).3844
D).62
Unlock Deck
Unlock for access to all 143 flashcards in this deck.
Unlock Deck
k this deck
35
The null hypothesis that ñ = 0 can be tested by converting the sample correlation coefficient to a statistic that has a sampling distribution that closely approximates the
A)normal distribution.
B)t distribution.
C)F distribution.
D)r distribution.
A)normal distribution.
B)t distribution.
C)F distribution.
D)r distribution.
Unlock Deck
Unlock for access to all 143 flashcards in this deck.
Unlock Deck
k this deck
36
A social psychologist is interested in whether education level is related the number of desired children.She obtains an r value of -.24 with 62 subjects.If the sum of squares for Y is 634,what is the estimated standard error of estimate?
A)3.16
B)3.34
C)9.96
D)11.18
A)3.16
B)3.34
C)9.96
D)11.18
Unlock Deck
Unlock for access to all 143 flashcards in this deck.
Unlock Deck
k this deck
37
To test the null hypothesis that ñ = 0,the scatterplot of X and Y scores should represent a bivariate normal distribution,which means that
A)the distribution of Y scores at any value of X is normal in the population
B)the distribution of Y scores is normal in the population
C)the distribution of X scores is normal in the population
D)none of these
A)the distribution of Y scores at any value of X is normal in the population
B)the distribution of Y scores is normal in the population
C)the distribution of X scores is normal in the population
D)none of these
Unlock Deck
Unlock for access to all 143 flashcards in this deck.
Unlock Deck
k this deck
38
If the degrees of freedom of the Pearson correlation is 0,how many pairs of scores are there?
A)0
B)1
C)2
D)cannot be determined
A)0
B)1
C)2
D)cannot be determined
Unlock Deck
Unlock for access to all 143 flashcards in this deck.
Unlock Deck
k this deck
39
A researcher believes that an extroverted personality is positively related to self-esteem.She obtains measures of both variables for 25 people,and calculates a correlation coefficient of .35.If the alpha level is .05,directional test,how would this result be reported in a psychological journal?
A)r(25)= .35,p < .05
B)r(24)= .35,p < .05
C)r(23)= .35,p > .05
D)r(23)= .35,p < .05
A)r(25)= .35,p < .05
B)r(24)= .35,p < .05
C)r(23)= .35,p > .05
D)r(23)= .35,p < .05
Unlock Deck
Unlock for access to all 143 flashcards in this deck.
Unlock Deck
k this deck
40
If the researcher suspects that the strength of the relationship between two variables in the population is .40,as indexed by the correlation coefficient squared,what sample size should she use in a study involving an alpha level of .05,directional test,in order to achieve a power of .80?
A)13
B)16
C)20
D)23
A)13
B)16
C)20
D)23
Unlock Deck
Unlock for access to all 143 flashcards in this deck.
Unlock Deck
k this deck
41
The nature of the relationship in a correlation analysis is determined by examining _______.
A)r2
B)the sign of r
C)a Tukey HSD test
D)inspection of group means
A)r2
B)the sign of r
C)a Tukey HSD test
D)inspection of group means
Unlock Deck
Unlock for access to all 143 flashcards in this deck.
Unlock Deck
k this deck
42
When a relationship is found using the Pearson correlation technique on sample data,this does not mean there is a non-zero correlation in the population,because of _____.
A)sampling error
B)sample size
C)restriction of range
D)none of these,since it will always exist in the population if it is present in the sample
A)sampling error
B)sample size
C)restriction of range
D)none of these,since it will always exist in the population if it is present in the sample
Unlock Deck
Unlock for access to all 143 flashcards in this deck.
Unlock Deck
k this deck
43
When the population correlation is _____ and the scores in the population are (bivariate.normally distributed,then as N increases the distribution of the sample correlation coefficient tends,somewhat slowly,toward a _____.
A)1.00;normal distribution
B)zero;normal distribution
C)-1.00;binomial distribution
D)-1.00;normal distribution
A)1.00;normal distribution
B)zero;normal distribution
C)-1.00;binomial distribution
D)-1.00;normal distribution
Unlock Deck
Unlock for access to all 143 flashcards in this deck.
Unlock Deck
k this deck
44
Nonzero correlation coefficients indicate some approximation to a _____ relationship.
A)linear
B)nonlinear
C)causal
D)bidirectional
A)linear
B)nonlinear
C)causal
D)bidirectional
Unlock Deck
Unlock for access to all 143 flashcards in this deck.
Unlock Deck
k this deck
45
The traditional null hypothesis tested using the Pearson correlation is _____.
A)the correlation in the population equals 0
B)the correlation in the population does not equal 0
C)the correlation in the population is greater than 0
D)the correlation in the population equals 1
A)the correlation in the population equals 0
B)the correlation in the population does not equal 0
C)the correlation in the population is greater than 0
D)the correlation in the population equals 1
Unlock Deck
Unlock for access to all 143 flashcards in this deck.
Unlock Deck
k this deck
46
The test of the null hypothesis that ñ = 0 is based on the assumption that:
A)the sample is independently and randomly selected from the population of interest
B)the distribution of Y scores at any value of X is normal on the population
C)the variability of Y scores is the same at each value of X
D)all of these
A)the sample is independently and randomly selected from the population of interest
B)the distribution of Y scores at any value of X is normal on the population
C)the variability of Y scores is the same at each value of X
D)all of these
Unlock Deck
Unlock for access to all 143 flashcards in this deck.
Unlock Deck
k this deck
47
Which of the following values represents the weakest correlation between variables?
A)+.95
B)-.60
C)+.10
D)-.04
A)+.95
B)-.60
C)+.10
D)-.04
Unlock Deck
Unlock for access to all 143 flashcards in this deck.
Unlock Deck
k this deck
48
When the population correlation coefficient is greater than 0,the sampling distribution is ______.
A)positively skewed
B)negatively skewed
C)symmetrical and approximately normal
D)bimodal
A)positively skewed
B)negatively skewed
C)symmetrical and approximately normal
D)bimodal
Unlock Deck
Unlock for access to all 143 flashcards in this deck.
Unlock Deck
k this deck
49
When testing the significance of a correlation,we use the alpha level and the degrees of freedom value equal to ______.
A)N
B)N-1
C)n
D)N-2
A)N
B)N-1
C)n
D)N-2
Unlock Deck
Unlock for access to all 143 flashcards in this deck.
Unlock Deck
k this deck
50
We can test the null hypothesis that ñ = 0 by transforming the sample correlation coefficient into a statistic that has a sampling distribution that closely approximates the _____ distribution with _____ degrees of freedom.
A)F;N - 1
B)F;N - 2
C)t;N - 1
D)t;N - 2
A)F;N - 1
B)F;N - 2
C)t;N - 1
D)t;N - 2
Unlock Deck
Unlock for access to all 143 flashcards in this deck.
Unlock Deck
k this deck
51
The measure of the strength of the relationship found using the Pearson correlation is _______.
A)r2
B)eta2
C)SSERROR/ SSTOTAL
D)a and b
A)r2
B)eta2
C)SSERROR/ SSTOTAL
D)a and b
Unlock Deck
Unlock for access to all 143 flashcards in this deck.
Unlock Deck
k this deck
52
The mean of a sampling distribution of the correlation coefficient is approximately:
A)ì,the true population mean
B)ñ,the true population correlation
C)ó,the true population correlation
D)none of these
A)ì,the true population mean
B)ñ,the true population correlation
C)ó,the true population correlation
D)none of these
Unlock Deck
Unlock for access to all 143 flashcards in this deck.
Unlock Deck
k this deck
53
The sampling distribution of the population correlation coefficient is ____ when the population coefficient is equal to 0.
A)positively skewed
B)negatively skewed
C)symmetrical and approximately normal
D)bimodal
A)positively skewed
B)negatively skewed
C)symmetrical and approximately normal
D)bimodal
Unlock Deck
Unlock for access to all 143 flashcards in this deck.
Unlock Deck
k this deck
54
If a relationship is observed between two variables in a set of sample data,this _____ that a relationship exists in the corresponding population.
A)does not always mean
B)always means
A)does not always mean
B)always means
Unlock Deck
Unlock for access to all 143 flashcards in this deck.
Unlock Deck
k this deck
55
A relationship might exist in a sample even though it does not exist in the population,because of:
A)idiosyncratic variance
B)incorrect inference
C)confounding variables
D)sampling error
A)idiosyncratic variance
B)incorrect inference
C)confounding variables
D)sampling error
Unlock Deck
Unlock for access to all 143 flashcards in this deck.
Unlock Deck
k this deck
56
The Pearson correlation is typically used to analyze the relationship between two variables when:
A)both variables are qualitative in nature
B)the two variables have been measured on different individuals
C)the observations on each variable are within-subjects in natured.
D)none of these
A)both variables are qualitative in nature
B)the two variables have been measured on different individuals
C)the observations on each variable are within-subjects in natured.
D)none of these
Unlock Deck
Unlock for access to all 143 flashcards in this deck.
Unlock Deck
k this deck
57
Which of the following is formally known as the coefficient of determination?
A)r
B)eta2
C)r2
D)rho
A)r
B)eta2
C)r2
D)rho
Unlock Deck
Unlock for access to all 143 flashcards in this deck.
Unlock Deck
k this deck
58
Which of the following values represents the strongest correlation between variables?
A)0
B)-.80
C)+.75
D)-.15
A)0
B)-.80
C)+.75
D)-.15
Unlock Deck
Unlock for access to all 143 flashcards in this deck.
Unlock Deck
k this deck
59
The value of r2 represents the proportion of variability _____.
A)in the dependent variable that is associated with the independent variable
B)that is due to disturbance variables
C)that is unaccounted for
A)in the dependent variable that is associated with the independent variable
B)that is due to disturbance variables
C)that is unaccounted for
Unlock Deck
Unlock for access to all 143 flashcards in this deck.
Unlock Deck
k this deck
60
If we find a high correlation between variables X and Y,we can conclude _____.
A)X causes Y
B)Y causes X
C)X and Y have the same cause
D)X and Y systematically vary together
A)X causes Y
B)Y causes X
C)X and Y have the same cause
D)X and Y systematically vary together
Unlock Deck
Unlock for access to all 143 flashcards in this deck.
Unlock Deck
k this deck
61
The values of _____ are estimates of _____,respectively.
A)á and â;a and b
B)a and b;á and â
C)a and b;ñ and å
D)ó and ì;a and b
A)á and â;a and b
B)a and b;á and â
C)a and b;ñ and å
D)ó and ì;a and b
Unlock Deck
Unlock for access to all 143 flashcards in this deck.
Unlock Deck
k this deck
62
Suppose a school psychologist found a correlation between SAT scores of students who graduated from her school and their GPAs at the end of the first year in college.The correlation,r = .82,was based on a sample of 55 students whose SAT scores ranged from 450 to 550.The next year,one for her students made a 625 on the SAT and she wants to predict that students future GPA.Which of the following statements is true?
A)her prediction may be incorrect
B)her prediction will definitely be correct
A)her prediction may be incorrect
B)her prediction will definitely be correct
Unlock Deck
Unlock for access to all 143 flashcards in this deck.
Unlock Deck
k this deck
63
If the test of a Pearson correlation yields statistically significant results,researchers will sometimes pursue analysis of the:
A)regression equation
B)sample means
C)group means
D)bivariate normal distribution
A)regression equation
B)sample means
C)group means
D)bivariate normal distribution
Unlock Deck
Unlock for access to all 143 flashcards in this deck.
Unlock Deck
k this deck
64
Variance heterogeneity can be problematic for the t test of the Pearson correlation coefficient,especially if one is going to pursue estimation of the:
A)population variance
B)sample correlation coefficient
C)population regression equation
D)population mean
A)population variance
B)sample correlation coefficient
C)population regression equation
D)population mean
Unlock Deck
Unlock for access to all 143 flashcards in this deck.
Unlock Deck
k this deck
65
In a regression equation,the variable being predicted (or _____)is known as a(n)_______ variable.
A)X;dependent or criterion
B)X;independent or predictor
C)Y;dependent or criterion
D)Y;independent or predictor
A)X;dependent or criterion
B)X;independent or predictor
C)Y;dependent or criterion
D)Y;independent or predictor
Unlock Deck
Unlock for access to all 143 flashcards in this deck.
Unlock Deck
k this deck
66
The use of the slope as an index of effect size only makes sense when the correlation between Y and X is:
A)relatively low
B)relatively high
C)0
D)+1.00 or -1.00
A)relatively low
B)relatively high
C)0
D)+1.00 or -1.00
Unlock Deck
Unlock for access to all 143 flashcards in this deck.
Unlock Deck
k this deck
67
In a regression equation,the variable from which predictions are being made (or_______)is known as a(n)______ variable.
A)X;dependent or criterion
B)X;independent or predictor
C)Y;dependent or criterion
D)Y;independent or predictor
A)X;dependent or criterion
B)X;independent or predictor
C)Y;dependent or criterion
D)Y;independent or predictor
Unlock Deck
Unlock for access to all 143 flashcards in this deck.
Unlock Deck
k this deck
68
An important characteristic of regression is that _____ can be extended to individuals who were not included in the original data set.
A)correlated errors
B)missing data
C)sample means
D)predictions
A)correlated errors
B)missing data
C)sample means
D)predictions
Unlock Deck
Unlock for access to all 143 flashcards in this deck.
Unlock Deck
k this deck
69
The estimated standard error of the estimate is an index of how much error will occur in the population when:
A)predicting Y from X
B)predicting å
C)predicting Y from å
D)predicting á from â
A)predicting Y from X
B)predicting å
C)predicting Y from å
D)predicting á from â
Unlock Deck
Unlock for access to all 143 flashcards in this deck.
Unlock Deck
k this deck
70
Fisher's transformation of r to z permits us to _____.
A)better characterize the size of the correlation
B)estimate the standard error of estimate
C)test the null hypothesis that ñ is equal to any a priori specified value
D)use a test that makes fewer assumptions than the Pearson correlation
A)better characterize the size of the correlation
B)estimate the standard error of estimate
C)test the null hypothesis that ñ is equal to any a priori specified value
D)use a test that makes fewer assumptions than the Pearson correlation
Unlock Deck
Unlock for access to all 143 flashcards in this deck.
Unlock Deck
k this deck
71
The strength of the relationship between two variables in a correlational analysis can be represented by:
A)eta-squared
B)r2
C)eta-squared and r2
D)t2 and F2
A)eta-squared
B)r2
C)eta-squared and r2
D)t2 and F2
Unlock Deck
Unlock for access to all 143 flashcards in this deck.
Unlock Deck
k this deck
72
An investigation of the relationship between years of formal education and IQ that was conducted with a sample size of 100 found a statistically significant correlation of .25.Another investigation of the same relationship had the same r value based on a sample size of 10,but it was not statistically significant.Why might this be?
A)a sample size of 100 has too much sampling error
B)a sample size of 10 is more likely to produce a Type I error
C)as sample size increases so does the power of the statistic
D)the standard error was larger in the sample where N = 100
A)a sample size of 100 has too much sampling error
B)a sample size of 10 is more likely to produce a Type I error
C)as sample size increases so does the power of the statistic
D)the standard error was larger in the sample where N = 100
Unlock Deck
Unlock for access to all 143 flashcards in this deck.
Unlock Deck
k this deck
73
The nature of the relationship between two correlated variables is determined through examination of the _____ of the correlation coefficient observed in the _____.
A)absolute value;population
B)strength;population
C)sign;sample
D)squared value;sample
A)absolute value;population
B)strength;population
C)sign;sample
D)squared value;sample
Unlock Deck
Unlock for access to all 143 flashcards in this deck.
Unlock Deck
k this deck
74
If X helps to predict Y,then the estimated standard error of estimate will be _____ than the estimated standard deviation of _____.
A)larger;X
B)larger;Y
C)smaller;X
D)smaller;Y
A)larger;X
B)larger;Y
C)smaller;X
D)smaller;Y
Unlock Deck
Unlock for access to all 143 flashcards in this deck.
Unlock Deck
k this deck
75
Suppose research conducted at a secretarial school found that reading speed correlated highly with typing speed after training,and that the regression equation based on the data from this school took the form of Y=25+.25X.A new applicant has a reading speed of 400 words per minute.With training in typing,she will probably learn to type at the rate of _____ words per minute.
A)100
B)125
C)75
D)150
A)100
B)125
C)75
D)150
Unlock Deck
Unlock for access to all 143 flashcards in this deck.
Unlock Deck
k this deck
76
The slope indicates the number of units Y is predicted to change given a _____ in X.
A)linear change
B)zero order change
C)two unit reduction
D)one unit change
A)linear change
B)zero order change
C)two unit reduction
D)one unit change
Unlock Deck
Unlock for access to all 143 flashcards in this deck.
Unlock Deck
k this deck
77
A positive correlation between height and weight would indicate that _____.
A)the taller a person is,the more he/she is likely to weigh
B)the taller a person is,the less he/she is likely to weigh
C)height and weight have little to do with each other
A)the taller a person is,the more he/she is likely to weigh
B)the taller a person is,the less he/she is likely to weigh
C)height and weight have little to do with each other
Unlock Deck
Unlock for access to all 143 flashcards in this deck.
Unlock Deck
k this deck
78
Another index of the strength of the effect that one variable has on another is the:
A)slope
B)intercept
C)error score
D)none of these
A)slope
B)intercept
C)error score
D)none of these
Unlock Deck
Unlock for access to all 143 flashcards in this deck.
Unlock Deck
k this deck
79
In the context of regression,the variable being predicted,Y,is formally known as the dependent or _____ variable;the variable from which predictions are made,X,is formally known as the independent or _____ variable.
A)confounding;disturbance
B)exogenous;predictor
C)criterion;predictor
D)predictor;criterion
A)confounding;disturbance
B)exogenous;predictor
C)criterion;predictor
D)predictor;criterion
Unlock Deck
Unlock for access to all 143 flashcards in this deck.
Unlock Deck
k this deck
80
The ability to make a causal inference between two variables is a function of the ______.
A)level of measurement of the variables
B)precision of measurement of the DV
C)research design
D)statistical technique used to analyze the data
A)level of measurement of the variables
B)precision of measurement of the DV
C)research design
D)statistical technique used to analyze the data
Unlock Deck
Unlock for access to all 143 flashcards in this deck.
Unlock Deck
k this deck
Unlock Deck
Unlock for access to all 143 flashcards in this deck.


