Deck 5: Market Outcomes and Tax Incidence
Full screen (f)
Question
Question
Question
Question
Question
Question
Question
Question
Question
Question
Question
Question
Use the following graph to answer the following questions.
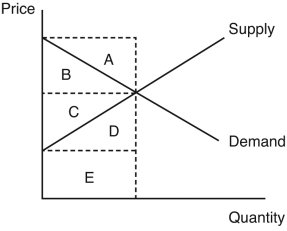
In the figure,which area represents the producer surplus?
A) area A
B) area B
C) area C
D) area D
E) area E
In the figure,which area represents the producer surplus?
A) area A
B) area B
C) area C
D) area D
E) area E
Question
Question
Question
Use the following graph to answer the following questions.
In the figure,which region represents the consumer surplus?
A) area A
B) area B
C) area C
D) area D
E) area E
In the figure,which region represents the consumer surplus?
A) area A
B) area B
C) area C
D) area D
E) area E
Question
Question
Question
Question
Use the following graph to answer the following questions.
-In the figure,which combination of areas represents the social welfare?
A) A + D
B) B + C
C) D + E
D) A + B
E) C + D
-In the figure,which combination of areas represents the social welfare?
A) A + D
B) B + C
C) D + E
D) A + B
E) C + D
Question
Question
Question
Question
Question
Question
Question
Question
Question
Question
Question
Question
Question
Question
Question
Question
Question
Question
Question
Question
Question
Question
Use the following information to answer the following questions.
The following graph depicts a market where a tax has been imposed.Pe was the equilibrium price before the tax was imposed,and Qe was the equilibrium quantity.After the tax,PC is the price that consumers pay,and PS is the price that producers receive.QT units are sold after the tax is imposed.NOTE: The areas B and C are rectangles that are divided by the supply curve ST.Include both sections of those rectangles when choosing your answers.
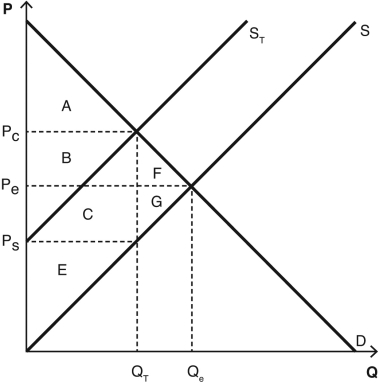
-Which areas represent producer surplus before the tax is imposed?
A) F + G
B) E + C + G
C) A + B + C + E
D) B + C + F + G
E) E
The following graph depicts a market where a tax has been imposed.Pe was the equilibrium price before the tax was imposed,and Qe was the equilibrium quantity.After the tax,PC is the price that consumers pay,and PS is the price that producers receive.QT units are sold after the tax is imposed.NOTE: The areas B and C are rectangles that are divided by the supply curve ST.Include both sections of those rectangles when choosing your answers.
-Which areas represent producer surplus before the tax is imposed?
A) F + G
B) E + C + G
C) A + B + C + E
D) B + C + F + G
E) E
Question
Question
Use the following information to answer the following questions.
The following graph depicts a market where a tax has been imposed.Pe was the equilibrium price before the tax was imposed,and Qe was the equilibrium quantity.After the tax,PC is the price that consumers pay,and PS is the price that producers receive.QT units are sold after the tax is imposed.NOTE: The areas B and C are rectangles that are divided by the supply curve ST.Include both sections of those rectangles when choosing your answers.
-Which areas represent the total tax revenue created as a result of the tax?
A) A + C
B) A + E
C) B + C
D) A + E + F + G
E) A + B + C + D + E + F + G
Question
Question
Use the following information to answer the following questions.
The following graph depicts a market where a tax has been imposed.Pe was the equilibrium price before the tax was imposed,and Qe was the equilibrium quantity.After the tax,PC is the price that consumers pay,and PS is the price that producers receive.QT units are sold after the tax is imposed.NOTE: The areas B and C are rectangles that are divided by the supply curve ST.Include both sections of those rectangles when choosing your answers.
-Which areas represent the deadweight loss created as a result of the tax?
A) A + B + C + E + F + G
B) A + C
C) A + B + C + E
D) F + G
E) B + C + F + G
Question
Use the following information to answer the following questions.
The following graph depicts a market where a tax has been imposed.Pe was the equilibrium price before the tax was imposed,and Qe was the equilibrium quantity.After the tax,PC is the price that consumers pay,and PS is the price that producers receive.QT units are sold after the tax is imposed.NOTE: The areas B and C are rectangles that are divided by the supply curve ST.Include both sections of those rectangles when choosing your answers.
-Which areas represent consumer surplus after the tax is imposed?
A) A
B) A + B
C) A + B + F
D) F + G
E) B + C + F
Question
Use the following information to answer the following questions.
The following graph depicts a market where a tax has been imposed.Pe was the equilibrium price before the tax was imposed,and Qe was the equilibrium quantity.After the tax,PC is the price that consumers pay,and PS is the price that producers receive.QT units are sold after the tax is imposed.NOTE: The areas B and C are rectangles that are divided by the supply curve ST.Include both sections of those rectangles when choosing your answers.
-Which areas represent consumer surplus before the tax is imposed?
A) A + B + F
B) A
C) C + G + E
D) B + C
E) F + G
Question
Use the following information to answer the following questions.
The following graph depicts a market where a tax has been imposed.Pe was the equilibrium price before the tax was imposed,and Qe was the equilibrium quantity.After the tax,PC is the price that consumers pay,and PS is the price that producers receive.QT units are sold after the tax is imposed.NOTE: The areas B and C are rectangles that are divided by the supply curve ST.Include both sections of those rectangles when choosing your answers.
-Which areas represent the amount of consumer surplus lost due to the tax?
A) A + F
B) B + C
C) A
D) A + B + F
E) B + F
Question
Use the following information to answer the following questions.
The following graph depicts a market where a tax has been imposed.Pe was the equilibrium price before the tax was imposed,and Qe was the equilibrium quantity.After the tax,PC is the price that consumers pay,and PS is the price that producers receive.QT units are sold after the tax is imposed.NOTE: The areas B and C are rectangles that are divided by the supply curve ST.Include both sections of those rectangles when choosing your answers.
Which party is responsible for paying this tax out of pocket?
A) consumers
B) producers
C) both consumers and producers
D) some consumers and some producers,but not all consumers and producers
E) some consumers and no producers
Question
Use the following information to answer the following questions.
The following graph depicts a market where a tax has been imposed.Pe was the equilibrium price before the tax was imposed,and Qe was the equilibrium quantity.After the tax,PC is the price that consumers pay,and PS is the price that producers receive.QT units are sold after the tax is imposed.NOTE: The areas B and C are rectangles that are divided by the supply curve ST.Include both sections of those rectangles when choosing your answers.
-Which areas represent the total cost to society,in terms of lost social welfare,created as a result of the tax?
A) B + C + F + G
B) A + B + F
C) C + E + G
D) A + B + C + E
E) F + G
Question
Question
Use the following information to answer the following questions.
The following graph depicts a market where a tax has been imposed.Pe was the equilibrium price before the tax was imposed,and Qe was the equilibrium quantity.After the tax,PC is the price that consumers pay,and PS is the price that producers receive.QT units are sold after the tax is imposed.NOTE: The areas B and C are rectangles that are divided by the supply curve ST.Include both sections of those rectangles when choosing your answers.
-Which areas represent producer surplus after the tax is imposed?
A) E + C + G
B) E + C
C) E + G
D) F + G
E) E
Question
Question
Use the following information to answer the following questions.
The following graph depicts a market where a tax has been imposed.Pe was the equilibrium price before the tax was imposed,and Qe was the equilibrium quantity.After the tax,PC is the price that consumers pay,and PS is the price that producers receive.QT units are sold after the tax is imposed.NOTE: The areas B and C are rectangles that are divided by the supply curve ST.Include both sections of those rectangles when choosing your answers.
-Which areas represent the total lost consumer and producer surplus (i.e. ,social welfare)as a result of the tax?
A) A + B + C + E + F + G
B) A + C
C) A + B + C + E
D) F + G
E) B + C + F + G
Question
Use the following information to answer the following questions.
The following graph depicts a market where a tax has been imposed.Pe was the equilibrium price before the tax was imposed,and Qe was the equilibrium quantity.After the tax,PC is the price that consumers pay,and PS is the price that producers receive.QT units are sold after the tax is imposed.NOTE: The areas B and C are rectangles that are divided by the supply curve ST.Include both sections of those rectangles when choosing your answers.
-What is the total amount of producer and consumer surplus (i.e. ,social welfare)in this market before the tax is imposed?
A) A + B + C + E + F + G
B) A + C
C) A + B + C + E
D) F + G
E) B + C+ F + G
Question
Use the following information to answer the following questions.
The following graph depicts a market where a tax has been imposed.Pe was the equilibrium price before the tax was imposed,and Qe was the equilibrium quantity.After the tax,PC is the price that consumers pay,and PS is the price that producers receive.QT units are sold after the tax is imposed.NOTE: The areas B and C are rectangles that are divided by the supply curve ST.Include both sections of those rectangles when choosing your answers.
-What is the total amount of producer and consumer surplus (i.e. ,social welfare)in this market after the tax is imposed?
A) A + B + C + E + F + G
B) A + E
C) A + B + C + E
D) F + G
E) B + C + F + G
Question
Use the following information to answer the following questions.
The following graph depicts a market where a tax has been imposed.Pe was the equilibrium price before the tax was imposed,and Qe was the equilibrium quantity.After the tax,PC is the price that consumers pay,and PS is the price that producers receive.QT units are sold after the tax is imposed.NOTE: The areas B and C are rectangles that are divided by the supply curve ST.Include both sections of those rectangles when choosing your answers.
-Which areas represent the revenue collected from this tax?
A) A + B + F
B) B + C
C) F + G
D) E
E) A + E
Question
Use the following information to answer the following questions.
The following graph depicts a market where a tax has been imposed.Pe was the equilibrium price before the tax was imposed,and Qe was the equilibrium quantity.After the tax,PC is the price that consumers pay,and PS is the price that producers receive.QT units are sold after the tax is imposed.NOTE: The areas B and C are rectangles that are divided by the supply curve ST.Include both sections of those rectangles when choosing your answers.
-Which areas represent the amount of producer surplus lost due to the tax?
A) G
B) A + B + C + E
C) C
D) C + G
E) B + F
Question
Question
Use the following information to answer the following questions.
The following graph depicts a market where a tax has been imposed.Pe was the equilibrium price before the tax was imposed,and Qe was the equilibrium quantity.After the tax,PC is the price that consumers pay,and PS is the price that producers receive.QT units are sold after the tax is imposed.NOTE: The areas B and C are rectangles that are divided by the supply curve ST.Include both sections of those rectangles when choosing your answers.
-What is the amount of the tax,as measured along the y axis?
A) PC + PS
B) Pe - PS
C) PC - PS
D) PC - Pe
E) Pe + PS
Question
Question
Question
Question
Question
Question
Question
Question
Question
Question
Question
Question
Question
Question
Question
Question
Question
Question
Question
Question

Unlock Deck
Sign up to unlock the cards in this deck!
Unlock Deck
Unlock Deck
1/175
Play
Full screen (f)
Deck 5: Market Outcomes and Tax Incidence
1
When the price of a good decreases and all else is held constant
A) producer surplus increases.
B) both consumer surplus and producer surplus decrease.
C) both consumer surplus and producer surplus increase.
D) producer surplus decreases.
E) consumer surplus decreases.
A) producer surplus increases.
B) both consumer surplus and producer surplus decrease.
C) both consumer surplus and producer surplus increase.
D) producer surplus decreases.
E) consumer surplus decreases.
producer surplus decreases.
2
Consider the market for socks.The current price of a pair of plain white socks is $5.00.Two consumers,Igor and Samir,are willing to pay $7.25 and $8.00,respectively,for a pair of plain white socks.Two sock manufacturers are willing to sell plain white socks for as little as $4.00 and $4.15 per pair.How much is total consumer surplus in this market?
A) $2.25
B) $3.00
C) $0.75
D) $5.25
E) $15.25
A) $2.25
B) $3.00
C) $0.75
D) $5.25
E) $15.25
$5.25
3
Producer surplus is defined as the
A) difference between the willingness to pay for a good and the willingness to sell it.
B) difference between the price the seller receives and the willingness to sell it.
C) difference between the willingness to pay for a good and the price paid to get it.
D) quantity of units that consumers want to buy at the market price.
E) total revenue earned from producing and selling some good.
difference between the price the seller receives and the willingness to sell it.
4
Jung is willing to pay $85 for a new jacket that sells for $70.Eddie is willing to pay $65 for that same jacket.What is the total consumer surplus for Jung and Eddie?
A) $30
B) $15
C) $20
D) $25
E) $155
A) $30
B) $15
C) $20
D) $25
E) $155
Unlock Deck
Unlock for access to all 175 flashcards in this deck.
Unlock Deck
k this deck
5
Consumer surplus is the difference between
A) supply and demand.
B) the price the producer receives and the willingness to sell a good.
C) the willingness to pay for a good and the willingness to sell a good.
D) the willingness to pay for a good and the amount that is paid to get it.
E) the price paid for a good and the amount of the good produced.
Unlock Deck
Unlock for access to all 175 flashcards in this deck.
Unlock Deck
k this deck
6
Priscilla is willing to pay $65 for a new pair of shoes.Pandora is willing to pay $50 for the same shoes.The shoes have a price of $45.What is the total consumer surplus for Priscilla and Pandora?
A) $15
B) $20
C) $5
D) $25
E) $35
A) $15
B) $20
C) $5
D) $25
E) $35
Unlock Deck
Unlock for access to all 175 flashcards in this deck.
Unlock Deck
k this deck
7
The difference between the willingness to sell a good and the price a producer receives is also known as
A) producer profit.
B) producer surplus.
C) consumer waste.
D) tax revenue.
E) producer benefit.
A) producer profit.
B) producer surplus.
C) consumer waste.
D) tax revenue.
E) producer benefit.
Unlock Deck
Unlock for access to all 175 flashcards in this deck.
Unlock Deck
k this deck
8
All else held constant,an increase in the price of a good would necessarily
A) increase social welfare.
B) decrease producer surplus.
C) decrease consumer surplus.
D) increase consumer surplus.
E) increase the supply of the good.
A) increase social welfare.
B) decrease producer surplus.
C) decrease consumer surplus.
D) increase consumer surplus.
E) increase the supply of the good.
Unlock Deck
Unlock for access to all 175 flashcards in this deck.
Unlock Deck
k this deck
9
Holding all else constant,when the price of a good increases
A) consumer surplus increases.
B) producer surplus decreases.
C) both producer surplus and consumer surplus increase.
D) both consumer surplus and producer surplus decrease.
E) consumer surplus decreases.
A) consumer surplus increases.
B) producer surplus decreases.
C) both producer surplus and consumer surplus increase.
D) both consumer surplus and producer surplus decrease.
E) consumer surplus decreases.
Unlock Deck
Unlock for access to all 175 flashcards in this deck.
Unlock Deck
k this deck
10
The difference between the willingness to pay for a good and the amount that is paid to get it is also known as
A) consumer expenditure.
B) surplus spending.
C) consumer benefit.
D) producer profit.
E) consumer surplus.
A) consumer expenditure.
B) surplus spending.
C) consumer benefit.
D) producer profit.
E) consumer surplus.
Unlock Deck
Unlock for access to all 175 flashcards in this deck.
Unlock Deck
k this deck
11
When the price of a good increases and all else is held constant
A) both consumer surplus and producer surplus decrease.
B) both consumer surplus and producer surplus increase.
C) consumer surplus decreases.
D) producer surplus decreases.
E) producer surplus increases.
A) both consumer surplus and producer surplus decrease.
B) both consumer surplus and producer surplus increase.
C) consumer surplus decreases.
D) producer surplus decreases.
E) producer surplus increases.
Unlock Deck
Unlock for access to all 175 flashcards in this deck.
Unlock Deck
k this deck
12
Use the following graph to answer the following questions.
In the figure,which area represents the producer surplus?
A) area A
B) area B
C) area C
D) area D
E) area E
In the figure,which area represents the producer surplus?
A) area A
B) area B
C) area C
D) area D
E) area E
Unlock Deck
Unlock for access to all 175 flashcards in this deck.
Unlock Deck
k this deck
13
Consumer surplus is defined as the
A) difference between the willingness to pay for a good and the willingness to sell it.
B) total revenue earned from producing and selling some good.
C) difference between the willingness to pay for a good and the price paid to get it.
D) quantity of units that consumers want to buy at the market price.
E) difference between the price the seller receives and the willingness to sell it.
Unlock Deck
Unlock for access to all 175 flashcards in this deck.
Unlock Deck
k this deck
14
All else held constant,a decrease in the price of a good would necessarily
A) increase social welfare.
B) decrease producer surplus.
C) decrease consumer surplus.
D) increase demand for the good.
E) increase producer surplus.
A) increase social welfare.
B) decrease producer surplus.
C) decrease consumer surplus.
D) increase demand for the good.
E) increase producer surplus.
Unlock Deck
Unlock for access to all 175 flashcards in this deck.
Unlock Deck
k this deck
15
Use the following graph to answer the following questions.
In the figure,which region represents the consumer surplus?
A) area A
B) area B
C) area C
D) area D
E) area E
In the figure,which region represents the consumer surplus?
A) area A
B) area B
C) area C
D) area D
E) area E
Unlock Deck
Unlock for access to all 175 flashcards in this deck.
Unlock Deck
k this deck
16
Another name for a consumer's willingness to pay is the
A) limiting cost.
B) expense cap.
C) hidden budget.
D) reservation price.
E) maximum outlay.
A) limiting cost.
B) expense cap.
C) hidden budget.
D) reservation price.
E) maximum outlay.
Unlock Deck
Unlock for access to all 175 flashcards in this deck.
Unlock Deck
k this deck
17
Producer surplus is the difference between
A) supply and demand.
B) the price the producer receives and the willingness to sell a good.
C) the willingness to pay for a good and the willingness to sell a good.
D) the willingness to pay for a good and the amount that is paid to get it.
E) the price paid for a good and the amount of the good produced.
Unlock Deck
Unlock for access to all 175 flashcards in this deck.
Unlock Deck
k this deck
18
For a given good,a consumer's willingness to pay is,by definition,the
A) same as the seller's willingness to sell.
B) amount of cash the consumer has on hand for purchase of the good.
C) amount the consumer offers at the start of a negotiation.
D) intensity of the consumer's desire for the good.
E) maximum price the consumer would pay for the good.
A) same as the seller's willingness to sell.
B) amount of cash the consumer has on hand for purchase of the good.
C) amount the consumer offers at the start of a negotiation.
D) intensity of the consumer's desire for the good.
E) maximum price the consumer would pay for the good.
Unlock Deck
Unlock for access to all 175 flashcards in this deck.
Unlock Deck
k this deck
19
Use the following graph to answer the following questions.
-In the figure,which combination of areas represents the social welfare?
A) A + D
B) B + C
C) D + E
D) A + B
E) C + D
-In the figure,which combination of areas represents the social welfare?
A) A + D
B) B + C
C) D + E
D) A + B
E) C + D
Unlock Deck
Unlock for access to all 175 flashcards in this deck.
Unlock Deck
k this deck
20
Holding all else constant,when the price of a good decreases
A) producer surplus increases.
B) consumer surplus increases.
C) both consumer surplus and producer surplus increase.
D) consumer surplus decreases.
E) both consumer surplus and producer surplus decrease.
A) producer surplus increases.
B) consumer surplus increases.
C) both consumer surplus and producer surplus increase.
D) consumer surplus decreases.
E) both consumer surplus and producer surplus decrease.
Unlock Deck
Unlock for access to all 175 flashcards in this deck.
Unlock Deck
k this deck
21
A market has reached an efficient outcome when
A) producers are able to produce and sell as much as they like.
B) total surplus is minimized.
C) producer surplus is greater than consumer surplus.
D) consumers are able to purchase as much as they like.
E) total surplus is maximized.
A) producers are able to produce and sell as much as they like.
B) total surplus is minimized.
C) producer surplus is greater than consumer surplus.
D) consumers are able to purchase as much as they like.
E) total surplus is maximized.
Unlock Deck
Unlock for access to all 175 flashcards in this deck.
Unlock Deck
k this deck
22
Sammy's Bakery and Presley's Sweetshop both sell cupcakes.The market price of one chocolate cupcake is $2.50.Sammy's is willing to sell a cupcake for as little as $1.65; Presley's is willing to sell a cupcake for as little as $1.75.What is the total producer surplus for the two firms?
A) $0.75
B) $1.60
C) $0.85
D) $2.50
E) $3.40
A) $0.75
B) $1.60
C) $0.85
D) $2.50
E) $3.40
Unlock Deck
Unlock for access to all 175 flashcards in this deck.
Unlock Deck
k this deck
23
Consider the market for socks.The current price of a pair of plain white socks is $5.00.Two consumers,Jeff and Samir,are willing to pay $7.25 and $8.00,respectively,for a pair of plain white socks.Two sock manufacturers are willing to sell plain white socks for as little as $4.00 and $4.15 per pair.What is the total producer and consumer surplus (i.e. ,social welfare)in this market?
A) $7.10
B) $5.25
C) $1.85
D) $23.40
E) $4.50
A) $7.10
B) $5.25
C) $1.85
D) $23.40
E) $4.50
Unlock Deck
Unlock for access to all 175 flashcards in this deck.
Unlock Deck
k this deck
24
Social welfare (i.e. ,the sum of producer and consumer surplus)is maximized when
A) the government taxes most goods and services.
B) very few consumers and producers exist within a market.
C) the market reaches its equilibrium price and quantity.
D) supply and demand are perfectly inelastic.
E) the government imposes price controls.
A) the government taxes most goods and services.
B) very few consumers and producers exist within a market.
C) the market reaches its equilibrium price and quantity.
D) supply and demand are perfectly inelastic.
E) the government imposes price controls.
Unlock Deck
Unlock for access to all 175 flashcards in this deck.
Unlock Deck
k this deck
25
Consumer surplus plus producer surplus equals
A) deadweight loss.
B) economic profit.
C) social welfare.
D) tax revenue.
E) market distortions.
A) deadweight loss.
B) economic profit.
C) social welfare.
D) tax revenue.
E) market distortions.
Unlock Deck
Unlock for access to all 175 flashcards in this deck.
Unlock Deck
k this deck
26
Questions about the equity of a tax are concerned mostly with
A) efficiency.
B) tax revenue.
C) fairness.
D) deadweight loss.
E) elasticity.
A) efficiency.
B) tax revenue.
C) fairness.
D) deadweight loss.
E) elasticity.
Unlock Deck
Unlock for access to all 175 flashcards in this deck.
Unlock Deck
k this deck
27
Social welfare is measured as the sum of
A) tax revenue and deadweight loss.
B) deadweight loss and consumer surplus.
C) producer surplus and tax revenue.
D) consumer surplus and tax revenue.
E) consumer surplus and producer surplus.
A) tax revenue and deadweight loss.
B) deadweight loss and consumer surplus.
C) producer surplus and tax revenue.
D) consumer surplus and tax revenue.
E) consumer surplus and producer surplus.
Unlock Deck
Unlock for access to all 175 flashcards in this deck.
Unlock Deck
k this deck
28
Which of the following statements is concerned with efficiency rather than equity?
A) Sales taxes on food are regressive and should be eliminated.
B) Income taxes should be raised on low-income families so that everyone pays.
C) The United States should implement a wealth tax on upper-income households.
D) Excise taxes tend to raise prices for consumers.
E) The overall tax system in the United States should be much more progressive.
Unlock Deck
Unlock for access to all 175 flashcards in this deck.
Unlock Deck
k this deck
29
Which of the following statements is concerned with efficiency rather than equity?
A) It is not fair to tax the income earned by the wealthy at higher rates than the poor.
B) Excise taxes on tobacco products affect low-income families the most and should be reduced.
C) Our income tax system should be more progressive than it is now.
D) Taxes cause distortions in markets and reduce social welfare.
E) The best type of income tax is a flat tax because it treats everyone the same.
Unlock Deck
Unlock for access to all 175 flashcards in this deck.
Unlock Deck
k this deck
30
LDT Products,Inc. ,designs and sells flannel jackets.The company is willing to sell a men's flannel jacket for as little as $45.Its main competitor is MK Outriggers,which is willing to sell the same men's flannel jacket for as little as $40.The current market price of that type of jacket is $57.What is the total producer surplus for the two firms?
A) $95
B) $12
C) $17
D) $29
E) $5
A) $95
B) $12
C) $17
D) $29
E) $5
Unlock Deck
Unlock for access to all 175 flashcards in this deck.
Unlock Deck
k this deck
31
Another name for social welfare is
A) total surplus.
B) combined equity.
C) collective good.
D) common benefit.
E) net per-capita gain.
A) total surplus.
B) combined equity.
C) collective good.
D) common benefit.
E) net per-capita gain.
Unlock Deck
Unlock for access to all 175 flashcards in this deck.
Unlock Deck
k this deck
32
Producer surplus is depicted by the area
A) above market price and below the supply curve.
B) between the supply curve and the demand curve.
C) below market price and above the supply curve.
D) above market price and below the demand curve.
E) above the demand curve and below the supply curve.
A) above market price and below the supply curve.
B) between the supply curve and the demand curve.
C) below market price and above the supply curve.
D) above market price and below the demand curve.
E) above the demand curve and below the supply curve.
Unlock Deck
Unlock for access to all 175 flashcards in this deck.
Unlock Deck
k this deck
33
When looking at a graph,the area under the demand curve and above market price is defined as
A) tax revenue.
B) spending surplus.
C) consumer benefit.
D) producer surplus.
E) consumer surplus.
A) tax revenue.
B) spending surplus.
C) consumer benefit.
D) producer surplus.
E) consumer surplus.
Unlock Deck
Unlock for access to all 175 flashcards in this deck.
Unlock Deck
k this deck
34
When looking at a graph,the area above the supply curve and below market price is defined as
A) consumer surplus.
B) producer surplus.
C) producer benefit.
D) business profit.
E) tax revenue.
A) consumer surplus.
B) producer surplus.
C) producer benefit.
D) business profit.
E) tax revenue.
Unlock Deck
Unlock for access to all 175 flashcards in this deck.
Unlock Deck
k this deck
35
For a given good,a seller's willingness to sell is,by definition,the
A) minimum price the seller would accept for the good.
B) amount of cash the seller needs to cover cash flow requirements.
C) amount the seller asks for at the start of a negotiation.
D) intensity of the seller's personal attachment to the good.
E) same as the consumer's willingness to pay.
A) minimum price the seller would accept for the good.
B) amount of cash the seller needs to cover cash flow requirements.
C) amount the seller asks for at the start of a negotiation.
D) intensity of the seller's personal attachment to the good.
E) same as the consumer's willingness to pay.
Unlock Deck
Unlock for access to all 175 flashcards in this deck.
Unlock Deck
k this deck
36
The price-quantity combination found where the supply and demand curves intersect is a unique combination that is efficient because
A) producers can sell as much as they want.
B) total surplus is maximized.
C) tax revenue is sufficient to pay for government services.
D) consumers can buy as much as they want.
E) new products are being introduced.
A) producers can sell as much as they want.
B) total surplus is maximized.
C) tax revenue is sufficient to pay for government services.
D) consumers can buy as much as they want.
E) new products are being introduced.
Unlock Deck
Unlock for access to all 175 flashcards in this deck.
Unlock Deck
k this deck
37
When looking at a supply and demand graph,you would find producer surplus
A) above the demand curve and below the supply curve.
B) below the demand curve and above market price.
C) to the right of equilibrium quantity and above market price.
D) above the demand curve and above the supply curve.
E) below market price and above the supply curve.
A) above the demand curve and below the supply curve.
B) below the demand curve and above market price.
C) to the right of equilibrium quantity and above market price.
D) above the demand curve and above the supply curve.
E) below market price and above the supply curve.
Unlock Deck
Unlock for access to all 175 flashcards in this deck.
Unlock Deck
k this deck
38
When looking at a supply and demand graph,you would find consumer surplus
A) above the demand curve and below the supply curve.
B) below the demand curve and above market price.
C) to the right of equilibrium quantity and above market price.
D) above the demand curve and above the supply curve.
E) below market price and above the supply curve.
A) above the demand curve and below the supply curve.
B) below the demand curve and above market price.
C) to the right of equilibrium quantity and above market price.
D) above the demand curve and above the supply curve.
E) below market price and above the supply curve.
Unlock Deck
Unlock for access to all 175 flashcards in this deck.
Unlock Deck
k this deck
39
Consider the market for socks.The current price of a pair of plain white socks is $5.00.Two consumers,Igor and Samir,are willing to pay $7.25 and $8.00,respectively,for a pair of plain white socks.Two sock manufacturers are willing to sell plain white socks for as little as $4.00 and $4.15 per pair.What is the total producer surplus in this market?
A) $0.15
B) $8.15
C) $0.85
D) $1.00
E) $1.85
A) $0.15
B) $8.15
C) $0.85
D) $1.00
E) $1.85
Unlock Deck
Unlock for access to all 175 flashcards in this deck.
Unlock Deck
k this deck
40
What happens to the amount of consumer surplus and producer surplus when the supply of scarves suddenly declines (shifts left)?
A) Producer surplus declines and consumer surplus is unchanged.
B) Consumer surplus declines and producer surplus is unchanged.
C) Consumer surplus declines and producer surplus declines.
D) Consumer surplus is unchanged and producer surplus is unchanged.
E) Producer surplus increases and consumer surplus increases.
Unlock Deck
Unlock for access to all 175 flashcards in this deck.
Unlock Deck
k this deck
41
Use the following information to answer the following questions.
The following graph depicts a market where a tax has been imposed.Pe was the equilibrium price before the tax was imposed,and Qe was the equilibrium quantity.After the tax,PC is the price that consumers pay,and PS is the price that producers receive.QT units are sold after the tax is imposed.NOTE: The areas B and C are rectangles that are divided by the supply curve ST.Include both sections of those rectangles when choosing your answers.
-Which areas represent producer surplus before the tax is imposed?
A) F + G
B) E + C + G
C) A + B + C + E
D) B + C + F + G
E) E
Unlock Deck
Unlock for access to all 175 flashcards in this deck.
Unlock Deck
k this deck
42
"When a good is divided up,it is important that none of the good go to waste." This statement emphasizes
A) fairness.
B) zero surplus.
C) efficiency.
D) equity.
E) equal welfare.
A) fairness.
B) zero surplus.
C) efficiency.
D) equity.
E) equal welfare.
Unlock Deck
Unlock for access to all 175 flashcards in this deck.
Unlock Deck
k this deck
43
Use the following information to answer the following questions.
The following graph depicts a market where a tax has been imposed.Pe was the equilibrium price before the tax was imposed,and Qe was the equilibrium quantity.After the tax,PC is the price that consumers pay,and PS is the price that producers receive.QT units are sold after the tax is imposed.NOTE: The areas B and C are rectangles that are divided by the supply curve ST.Include both sections of those rectangles when choosing your answers.
-Which areas represent the total tax revenue created as a result of the tax?
A) A + C
B) A + E
C) B + C
D) A + E + F + G
E) A + B + C + D + E + F + G
Unlock Deck
Unlock for access to all 175 flashcards in this deck.
Unlock Deck
k this deck
44
Which of the following statements is concerned with equity rather than efficiency?
A) Imposing a tax on a good reduces the incentive to buy that good.
B) The burden of a new sales tax typically increases prices.
C) Deadweight loss is the lost social welfare from a tax.
D) Tax rates on middle-class households are too high and should be reduced.
E) Taxes cause producers and consumers to lose surplus.
Unlock Deck
Unlock for access to all 175 flashcards in this deck.
Unlock Deck
k this deck
45
Use the following information to answer the following questions.
The following graph depicts a market where a tax has been imposed.Pe was the equilibrium price before the tax was imposed,and Qe was the equilibrium quantity.After the tax,PC is the price that consumers pay,and PS is the price that producers receive.QT units are sold after the tax is imposed.NOTE: The areas B and C are rectangles that are divided by the supply curve ST.Include both sections of those rectangles when choosing your answers.
-Which areas represent the deadweight loss created as a result of the tax?
A) A + B + C + E + F + G
B) A + C
C) A + B + C + E
D) F + G
E) B + C + F + G
Unlock Deck
Unlock for access to all 175 flashcards in this deck.
Unlock Deck
k this deck
46
Use the following information to answer the following questions.
The following graph depicts a market where a tax has been imposed.Pe was the equilibrium price before the tax was imposed,and Qe was the equilibrium quantity.After the tax,PC is the price that consumers pay,and PS is the price that producers receive.QT units are sold after the tax is imposed.NOTE: The areas B and C are rectangles that are divided by the supply curve ST.Include both sections of those rectangles when choosing your answers.
-Which areas represent consumer surplus after the tax is imposed?
A) A
B) A + B
C) A + B + F
D) F + G
E) B + C + F
Unlock Deck
Unlock for access to all 175 flashcards in this deck.
Unlock Deck
k this deck
47
Use the following information to answer the following questions.
The following graph depicts a market where a tax has been imposed.Pe was the equilibrium price before the tax was imposed,and Qe was the equilibrium quantity.After the tax,PC is the price that consumers pay,and PS is the price that producers receive.QT units are sold after the tax is imposed.NOTE: The areas B and C are rectangles that are divided by the supply curve ST.Include both sections of those rectangles when choosing your answers.
-Which areas represent consumer surplus before the tax is imposed?
A) A + B + F
B) A
C) C + G + E
D) B + C
E) F + G
Unlock Deck
Unlock for access to all 175 flashcards in this deck.
Unlock Deck
k this deck
48
Use the following information to answer the following questions.
The following graph depicts a market where a tax has been imposed.Pe was the equilibrium price before the tax was imposed,and Qe was the equilibrium quantity.After the tax,PC is the price that consumers pay,and PS is the price that producers receive.QT units are sold after the tax is imposed.NOTE: The areas B and C are rectangles that are divided by the supply curve ST.Include both sections of those rectangles when choosing your answers.
-Which areas represent the amount of consumer surplus lost due to the tax?
A) A + F
B) B + C
C) A
D) A + B + F
E) B + F
Unlock Deck
Unlock for access to all 175 flashcards in this deck.
Unlock Deck
k this deck
49
Use the following information to answer the following questions.
The following graph depicts a market where a tax has been imposed.Pe was the equilibrium price before the tax was imposed,and Qe was the equilibrium quantity.After the tax,PC is the price that consumers pay,and PS is the price that producers receive.QT units are sold after the tax is imposed.NOTE: The areas B and C are rectangles that are divided by the supply curve ST.Include both sections of those rectangles when choosing your answers.
Which party is responsible for paying this tax out of pocket?
A) consumers
B) producers
C) both consumers and producers
D) some consumers and some producers,but not all consumers and producers
E) some consumers and no producers
Unlock Deck
Unlock for access to all 175 flashcards in this deck.
Unlock Deck
k this deck
50
Use the following information to answer the following questions.
The following graph depicts a market where a tax has been imposed.Pe was the equilibrium price before the tax was imposed,and Qe was the equilibrium quantity.After the tax,PC is the price that consumers pay,and PS is the price that producers receive.QT units are sold after the tax is imposed.NOTE: The areas B and C are rectangles that are divided by the supply curve ST.Include both sections of those rectangles when choosing your answers.
-Which areas represent the total cost to society,in terms of lost social welfare,created as a result of the tax?
A) B + C + F + G
B) A + B + F
C) C + E + G
D) A + B + C + E
E) F + G
Unlock Deck
Unlock for access to all 175 flashcards in this deck.
Unlock Deck
k this deck
51
Which of the following statements is concerned with equity rather than efficiency?
A) Almost all taxes create some amount of deadweight loss.
B) Excise taxes tend to raise prices for consumers and reduce sales for firms.
C) Tax rates on the wealthy are too low and should be raised.
D) The incidence of a tax does not depend on who actually pays it.
E) Taxes generate revenues that governments spend on services.
Unlock Deck
Unlock for access to all 175 flashcards in this deck.
Unlock Deck
k this deck
52
Use the following information to answer the following questions.
The following graph depicts a market where a tax has been imposed.Pe was the equilibrium price before the tax was imposed,and Qe was the equilibrium quantity.After the tax,PC is the price that consumers pay,and PS is the price that producers receive.QT units are sold after the tax is imposed.NOTE: The areas B and C are rectangles that are divided by the supply curve ST.Include both sections of those rectangles when choosing your answers.
-Which areas represent producer surplus after the tax is imposed?
A) E + C + G
B) E + C
C) E + G
D) F + G
E) E
Unlock Deck
Unlock for access to all 175 flashcards in this deck.
Unlock Deck
k this deck
53
"When a good is divided up,it is important that everyone get an equal share." This statement emphasizes
A) maximum surplus.
B) efficiency.
C) aggregation.
D) equity.
E) total welfare.
A) maximum surplus.
B) efficiency.
C) aggregation.
D) equity.
E) total welfare.
Unlock Deck
Unlock for access to all 175 flashcards in this deck.
Unlock Deck
k this deck
54
Use the following information to answer the following questions.
The following graph depicts a market where a tax has been imposed.Pe was the equilibrium price before the tax was imposed,and Qe was the equilibrium quantity.After the tax,PC is the price that consumers pay,and PS is the price that producers receive.QT units are sold after the tax is imposed.NOTE: The areas B and C are rectangles that are divided by the supply curve ST.Include both sections of those rectangles when choosing your answers.
-Which areas represent the total lost consumer and producer surplus (i.e. ,social welfare)as a result of the tax?
A) A + B + C + E + F + G
B) A + C
C) A + B + C + E
D) F + G
E) B + C + F + G
Unlock Deck
Unlock for access to all 175 flashcards in this deck.
Unlock Deck
k this deck
55
Use the following information to answer the following questions.
The following graph depicts a market where a tax has been imposed.Pe was the equilibrium price before the tax was imposed,and Qe was the equilibrium quantity.After the tax,PC is the price that consumers pay,and PS is the price that producers receive.QT units are sold after the tax is imposed.NOTE: The areas B and C are rectangles that are divided by the supply curve ST.Include both sections of those rectangles when choosing your answers.
-What is the total amount of producer and consumer surplus (i.e. ,social welfare)in this market before the tax is imposed?
A) A + B + C + E + F + G
B) A + C
C) A + B + C + E
D) F + G
E) B + C+ F + G
Unlock Deck
Unlock for access to all 175 flashcards in this deck.
Unlock Deck
k this deck
56
Use the following information to answer the following questions.
The following graph depicts a market where a tax has been imposed.Pe was the equilibrium price before the tax was imposed,and Qe was the equilibrium quantity.After the tax,PC is the price that consumers pay,and PS is the price that producers receive.QT units are sold after the tax is imposed.NOTE: The areas B and C are rectangles that are divided by the supply curve ST.Include both sections of those rectangles when choosing your answers.
-What is the total amount of producer and consumer surplus (i.e. ,social welfare)in this market after the tax is imposed?
A) A + B + C + E + F + G
B) A + E
C) A + B + C + E
D) F + G
E) B + C + F + G
Unlock Deck
Unlock for access to all 175 flashcards in this deck.
Unlock Deck
k this deck
57
Use the following information to answer the following questions.
The following graph depicts a market where a tax has been imposed.Pe was the equilibrium price before the tax was imposed,and Qe was the equilibrium quantity.After the tax,PC is the price that consumers pay,and PS is the price that producers receive.QT units are sold after the tax is imposed.NOTE: The areas B and C are rectangles that are divided by the supply curve ST.Include both sections of those rectangles when choosing your answers.
-Which areas represent the revenue collected from this tax?
A) A + B + F
B) B + C
C) F + G
D) E
E) A + E
Unlock Deck
Unlock for access to all 175 flashcards in this deck.
Unlock Deck
k this deck
58
Use the following information to answer the following questions.
The following graph depicts a market where a tax has been imposed.Pe was the equilibrium price before the tax was imposed,and Qe was the equilibrium quantity.After the tax,PC is the price that consumers pay,and PS is the price that producers receive.QT units are sold after the tax is imposed.NOTE: The areas B and C are rectangles that are divided by the supply curve ST.Include both sections of those rectangles when choosing your answers.
-Which areas represent the amount of producer surplus lost due to the tax?
A) G
B) A + B + C + E
C) C
D) C + G
E) B + F
Unlock Deck
Unlock for access to all 175 flashcards in this deck.
Unlock Deck
k this deck
59
A tax on apples would cause consumers to suffer because
A) consumer surplus would increase.
B) the price of apples would increase and fewer apples would be purchased.
C) revenues for apple growers would decrease.
D) the government would collect revenue from the tax.
E) producer surplus would decrease.
A) consumer surplus would increase.
B) the price of apples would increase and fewer apples would be purchased.
C) revenues for apple growers would decrease.
D) the government would collect revenue from the tax.
E) producer surplus would decrease.
Unlock Deck
Unlock for access to all 175 flashcards in this deck.
Unlock Deck
k this deck
60
Use the following information to answer the following questions.
The following graph depicts a market where a tax has been imposed.Pe was the equilibrium price before the tax was imposed,and Qe was the equilibrium quantity.After the tax,PC is the price that consumers pay,and PS is the price that producers receive.QT units are sold after the tax is imposed.NOTE: The areas B and C are rectangles that are divided by the supply curve ST.Include both sections of those rectangles when choosing your answers.
-What is the amount of the tax,as measured along the y axis?
A) PC + PS
B) Pe - PS
C) PC - PS
D) PC - Pe
E) Pe + PS
Unlock Deck
Unlock for access to all 175 flashcards in this deck.
Unlock Deck
k this deck
61
It is said that taxes drive a wedge between prices.This statement is true because taxes cause
A) both consumer and producer prices to increase.
B) the consumer price to increase but leave producer prices unchanged.
C) both consumer and producer prices to decrease.
D) the consumer price to decrease and the producer price to increase.
E) the consumer price to increase and the producer price to decrease.
Unlock Deck
Unlock for access to all 175 flashcards in this deck.
Unlock Deck
k this deck
62
The incidence of a tax reflects
A) who pays the tax out of pocket.
B) how much tax revenue the tax generates.
C) who bears the burden of the tax.
D) how the tax revenue from the tax is spent.
E) government efficiency in providing goods and services.
A) who pays the tax out of pocket.
B) how much tax revenue the tax generates.
C) who bears the burden of the tax.
D) how the tax revenue from the tax is spent.
E) government efficiency in providing goods and services.
Unlock Deck
Unlock for access to all 175 flashcards in this deck.
Unlock Deck
k this deck
63
Excise taxes are taxes that are
A) applied to all goods and activities.
B) usually applied to inferior goods.
C) usually applied to income and capital gains.
D) never applied to goods or activities.
E) applied to a particular good or activity.
A) applied to all goods and activities.
B) usually applied to inferior goods.
C) usually applied to income and capital gains.
D) never applied to goods or activities.
E) applied to a particular good or activity.
Unlock Deck
Unlock for access to all 175 flashcards in this deck.
Unlock Deck
k this deck
64
When a tax is imposed on some good,what usually happens to consumer and producer surplus?
A) They both increase.
B) They both fall to zero.
C) They both decrease.
D) Consumer surplus increases and producer surplus decreases.
E) Consumer surplus decreases and producer surplus increases.
A) They both increase.
B) They both fall to zero.
C) They both decrease.
D) Consumer surplus increases and producer surplus decreases.
E) Consumer surplus decreases and producer surplus increases.
Unlock Deck
Unlock for access to all 175 flashcards in this deck.
Unlock Deck
k this deck
65
If a tax causes the supply curve to shift,we know that the tax is paid out of pocket by
A) consumers.
B) producers.
C) the government.
D) both producers and consumers.
E) consumer,producers,and the government.
A) consumers.
B) producers.
C) the government.
D) both producers and consumers.
E) consumer,producers,and the government.
Unlock Deck
Unlock for access to all 175 flashcards in this deck.
Unlock Deck
k this deck
66
When a tax is imposed on some good,what tends to happen to consumer prices and producer prices?
A) Consumer prices decrease and producer prices increase.
B) Consumer prices increase and producer prices decrease.
C) Consumer prices increase and producer prices increase.
D) Consumer prices decrease and producer prices decrease.
E) Consumer prices and producer prices converge at the same point.
A) Consumer prices decrease and producer prices increase.
B) Consumer prices increase and producer prices decrease.
C) Consumer prices increase and producer prices increase.
D) Consumer prices decrease and producer prices decrease.
E) Consumer prices and producer prices converge at the same point.
Unlock Deck
Unlock for access to all 175 flashcards in this deck.
Unlock Deck
k this deck
67
After a tax is imposed,the price paid by consumers ________ and the price received by producers ________.
A) increases; increases
B) increases; decreases
C) decreases; increases
D) decreases; decreases
E) is unaffected; is unaffected
A) increases; increases
B) increases; decreases
C) decreases; increases
D) decreases; decreases
E) is unaffected; is unaffected
Unlock Deck
Unlock for access to all 175 flashcards in this deck.
Unlock Deck
k this deck
68
A tax that is applied to one specific good or service is a(n)________ tax.
A) sales
B) general local option sales
C) property
D) excise
E) wealth
A) sales
B) general local option sales
C) property
D) excise
E) wealth
Unlock Deck
Unlock for access to all 175 flashcards in this deck.
Unlock Deck
k this deck
69
When a tax is imposed on some good,what happens to the amount of the good bought and sold?
A) It increases.
B) It decreases.
C) It decreases,but only if the tax is imposed on producers.
D) It decreases,but only if the tax is imposed on consumers.
E) It increases,but only if the tax is imposed on consumers.
A) It increases.
B) It decreases.
C) It decreases,but only if the tax is imposed on producers.
D) It decreases,but only if the tax is imposed on consumers.
E) It increases,but only if the tax is imposed on consumers.
Unlock Deck
Unlock for access to all 175 flashcards in this deck.
Unlock Deck
k this deck
70
The incidence of a tax is unrelated to
A) how responsive producers are to the tax.
B) how responsive consumers are to the tax.
C) the elasticity of supply.
D) the elasticity of demand.
E) who pays the tax out of pocket.
A) how responsive producers are to the tax.
B) how responsive consumers are to the tax.
C) the elasticity of supply.
D) the elasticity of demand.
E) who pays the tax out of pocket.
Unlock Deck
Unlock for access to all 175 flashcards in this deck.
Unlock Deck
k this deck
71
A tax on apples would cause apple growers to suffer because
A) consumer surplus would decrease.
B) the government would collect revenue from the tax.
C) consumers would pay higher prices.
D) producer surplus would increase.
E) revenues and profits from growing apples would decrease.
A) consumer surplus would decrease.
B) the government would collect revenue from the tax.
C) consumers would pay higher prices.
D) producer surplus would increase.
E) revenues and profits from growing apples would decrease.
Unlock Deck
Unlock for access to all 175 flashcards in this deck.
Unlock Deck
k this deck
72
A tax on apples would cause the price paid by consumers to ________ and the price received by producers to ________.
A) increase; increase
B) increase; decrease
C) decrease; increase,then decrease
D) decrease; decrease
E) increase,then decrease; increase
A) increase; increase
B) increase; decrease
C) decrease; increase,then decrease
D) decrease; decrease
E) increase,then decrease; increase
Unlock Deck
Unlock for access to all 175 flashcards in this deck.
Unlock Deck
k this deck
73
A tax on producers would cause the ________ curve(s)to shift to the ________.
A) demand; left
B) supply and demand; left
C) supply; left
D) supply; right
E) supply and demand; right
A) demand; left
B) supply and demand; left
C) supply; left
D) supply; right
E) supply and demand; right
Unlock Deck
Unlock for access to all 175 flashcards in this deck.
Unlock Deck
k this deck
74
A tax on milk would likely cause an increase in the
A) price consumers pay for milk.
B) price producers receive for milk.
C) amount of milk sold.
D) revenues earned from selling milk.
E) profits earned by selling milk.
A) price consumers pay for milk.
B) price producers receive for milk.
C) amount of milk sold.
D) revenues earned from selling milk.
E) profits earned by selling milk.
Unlock Deck
Unlock for access to all 175 flashcards in this deck.
Unlock Deck
k this deck
75
In most cases,taxes reduce economic efficiency because
A) they lower prices for consumers and cause firms to suffer.
B) they increase firms' profits at the expense of consumers.
C) taxes are perceived as unfair by some taxpayers.
D) the government often spends tax revenues on programs that some voters don't like.
E) they reduce consumer surplus and producer surplus.
Unlock Deck
Unlock for access to all 175 flashcards in this deck.
Unlock Deck
k this deck
76
A tax on consumers would cause the ________ curve(s)to shift to the ________.
A) demand; right
B) supply; left
C) supply and demand; left
D) supply and demand; right
E) demand; left
A) demand; right
B) supply; left
C) supply and demand; left
D) supply and demand; right
E) demand; left
Unlock Deck
Unlock for access to all 175 flashcards in this deck.
Unlock Deck
k this deck
77
A tax on consumers of a good would shift the ________ curve down and cause the price paid by consumers to ________.
A) supply; increase
B) demand; decrease,then return to its original level
C) supply; decrease
D) demand; increase
E) supply; increase,then return to its original level
A) supply; increase
B) demand; decrease,then return to its original level
C) supply; decrease
D) demand; increase
E) supply; increase,then return to its original level
Unlock Deck
Unlock for access to all 175 flashcards in this deck.
Unlock Deck
k this deck
78
A tax on milk would likely cause a decrease in the
A) price consumers pay for milk.
B) price of products made from milk.
C) amount of milk sold.
D) revenues from the milk tax.
E) deadweight loss from the milk tax.
A) price consumers pay for milk.
B) price of products made from milk.
C) amount of milk sold.
D) revenues from the milk tax.
E) deadweight loss from the milk tax.
Unlock Deck
Unlock for access to all 175 flashcards in this deck.
Unlock Deck
k this deck
79
Excise taxes are popular sources of revenue for governments because
A) they have very high levels of deadweight loss.
B) they are easy to understand.
C) consumers are rarely aware that they are paying them.
D) they are very stable sources of revenue.
E) they require very little paperwork.
A) they have very high levels of deadweight loss.
B) they are easy to understand.
C) consumers are rarely aware that they are paying them.
D) they are very stable sources of revenue.
E) they require very little paperwork.
Unlock Deck
Unlock for access to all 175 flashcards in this deck.
Unlock Deck
k this deck
80
The difference between the price consumers pay and the price sellers receive after a tax is imposed is equal to the
A) loss of social welfare from the tax.
B) dollar amount of the tax.
C) deadweight loss from the tax.
D) revenue from the tax.
E) lost profit from the tax.
A) loss of social welfare from the tax.
B) dollar amount of the tax.
C) deadweight loss from the tax.
D) revenue from the tax.
E) lost profit from the tax.
Unlock Deck
Unlock for access to all 175 flashcards in this deck.
Unlock Deck
k this deck
Unlock Deck
Unlock for access to all 175 flashcards in this deck.


