Deck 14: The Demand and Supply of Resources
Full screen (f)
Question
Use the following information to answer the following questions:
Mickey L.Douglas,owner of MLD Incorporated,knows that the marginal product of labor (MPL)for his workers can be defined as follows:
MPL = 32 - L
The total output a given level of workers can produce is found as:
Q = 32L - L2
L2
He also knows that the price of his output is $3.His profits can be found as:
Profit = (P * Q)- (W * L)
-What additional amount of output does the thirtieth worker contribute?
A) 150 units
B) 60 units
C) 2 units
D) 14 units
E) 9 units
Mickey L.Douglas,owner of MLD Incorporated,knows that the marginal product of labor (MPL)for his workers can be defined as follows:
MPL = 32 - L
The total output a given level of workers can produce is found as:
Q = 32L -
L2He also knows that the price of his output is $3.His profits can be found as:
Profit = (P * Q)- (W * L)
-What additional amount of output does the thirtieth worker contribute?
A) 150 units
B) 60 units
C) 2 units
D) 14 units
E) 9 units
Question
Use the following graph,which depicts Mighty Max's labor demand for his duffel bag business,to answer the following questions.The labor demand curve shown is calculated based on a duffel bag price of $10.
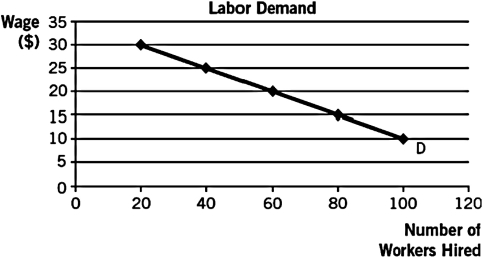
If 80 workers are hired,you know that the wage rate must be
A) $25.
B) $20.
C) $15.
D) $10.
E) $5.
If 80 workers are hired,you know that the wage rate must be
A) $25.
B) $20.
C) $15.
D) $10.
E) $5.
Question
Question
The worker productivity of Cutie Cupcakes is presented in the following table.Use the table to answer the following questions:

Cupcakes previously sold for $3 and now sell for $5.The number of workers that Cutie Cupcakes hires will
A) fall.
B) remain unchanged,but employees will have to work overtime.
C) increase.
D) stay the same.
E) increase indefinitely.
Cupcakes previously sold for $3 and now sell for $5.The number of workers that Cutie Cupcakes hires will
A) fall.
B) remain unchanged,but employees will have to work overtime.
C) increase.
D) stay the same.
E) increase indefinitely.
Question
Question
Question
Refer to the following table to answer the following questions:
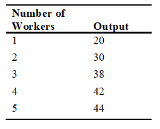
If the price of output is $2 and the wage for workers is $4,how many workers will the firm hire?
A) one
B) two
C) three
D) four
E) five
If the price of output is $2 and the wage for workers is $4,how many workers will the firm hire?
A) one
B) two
C) three
D) four
E) five
Question
The worker productivity of Cutie Cupcakes is presented in the following table.Use the table to answer the following questions:
When Cutie Cupcakes hires its three hundredth worker,what is that worker's marginal product of labor?
A) 300 cupcakes
B) 200 cupcakes
C) 100 cupcakes
D) 2 cupcakes
E) 3 cupcakes
When Cutie Cupcakes hires its three hundredth worker,what is that worker's marginal product of labor?
A) 300 cupcakes
B) 200 cupcakes
C) 100 cupcakes
D) 2 cupcakes
E) 3 cupcakes
Question
The worker productivity of Cutie Cupcakes is presented in the following table.Use the table to answer the following questions:
If the wage is $8 and the price of a cupcake is $4,what are Cutie Cupcakes' profits at the optimal amount of labor?
A) $2,200
B) $2,600
C) $4,600
D) $5,000
E) $7,500
If the wage is $8 and the price of a cupcake is $4,what are Cutie Cupcakes' profits at the optimal amount of labor?
A) $2,200
B) $2,600
C) $4,600
D) $5,000
E) $7,500
Question
Question
Refer to the following table to answer the following questions:
If the price of output falls from $5 to $2,the value of the marginal product of labor of all workers
A) increases.
B) remains unchanged.
C) increases at an increasing rate.
D) decreases at an increasing rate.
E) decreases.
If the price of output falls from $5 to $2,the value of the marginal product of labor of all workers
A) increases.
B) remains unchanged.
C) increases at an increasing rate.
D) decreases at an increasing rate.
E) decreases.
Question
Use the following information to answer the following questions:
Mickey L.Douglas,owner of MLD Incorporated,knows that the marginal product of labor (MPL)for his workers can be defined as follows:
MPL = 32 - L
The total output a given level of workers can produce is found as:
Q = 32L - L2
He also knows that the price of his output is $3.His profits can be found as:
Profit = (P * Q)- (W * L)
-What wage would be required to allow Mickey to hire the twenty-fifth worker?
A) $3
B) $7
C) $21
D) $125
E) $25
Mickey L.Douglas,owner of MLD Incorporated,knows that the marginal product of labor (MPL)for his workers can be defined as follows:
MPL = 32 - L
The total output a given level of workers can produce is found as:
Q = 32L -
L2He also knows that the price of his output is $3.His profits can be found as:
Profit = (P * Q)- (W * L)
-What wage would be required to allow Mickey to hire the twenty-fifth worker?
A) $3
B) $7
C) $21
D) $125
E) $25
Question
Question
Refer to the following table to answer the following questions:
If the price of output is $5,the value of the marginal product of labor of the third worker is
A) $8.
B) $30.
C) $40.
D) $38.
E) $190.
If the price of output is $5,the value of the marginal product of labor of the third worker is
A) $8.
B) $30.
C) $40.
D) $38.
E) $190.
Question
Use the following information to answer the following questions:
Mickey L.Douglas,owner of MLD Incorporated,knows that the marginal product of labor (MPL)for his workers can be defined as follows:
MPL = 32 - L
The total output a given level of workers can produce is found as:
Q = 32L - L2
He also knows that the price of his output is $3.His profits can be found as:
Profit = (P * Q)- (W * L)
-What is the value of additional output produced by the twelfth worker?
A) $20
B) $100
C) $10
D) $60
E) $80
Mickey L.Douglas,owner of MLD Incorporated,knows that the marginal product of labor (MPL)for his workers can be defined as follows:
MPL = 32 - L
The total output a given level of workers can produce is found as:
Q = 32L -
L2He also knows that the price of his output is $3.His profits can be found as:
Profit = (P * Q)- (W * L)
-What is the value of additional output produced by the twelfth worker?
A) $20
B) $100
C) $10
D) $60
E) $80
Question
Question
Question
Use the following graph,which depicts Mighty Max's labor demand for his duffel bag business,to answer the following questions.The labor demand curve shown is calculated based on a duffel bag price of $10.
If the wage is $20,Mighty Max will hire __________ workers.
A) 20
B) 30
C) 40
D) 50
E) 60
If the wage is $20,Mighty Max will hire __________ workers.
A) 20
B) 30
C) 40
D) 50
E) 60
Question
Question
Question
Question
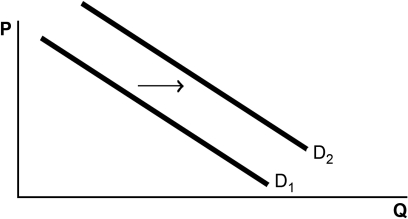
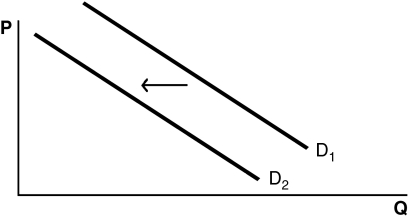
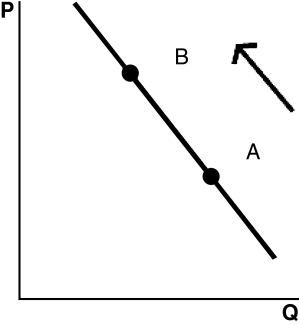
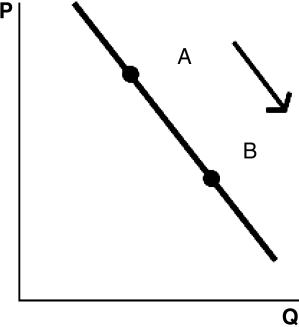
Refer to the following graphs to answer the following questions:
A.
 B.
B.
 C.
C.
 D.
D.
 E.
E.
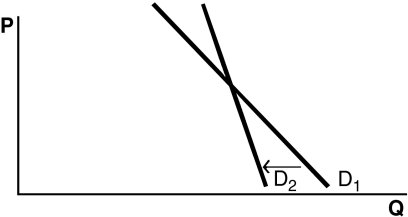
Choose the graph that represents the following situation: The government raises the minimum wage.
A) Graph A
B) Graph B
C) Graph C
D) Graph D
E) Graph E
A.
B. C. D. E.Choose the graph that represents the following situation: The government raises the minimum wage.
A) Graph A
B) Graph B
C) Graph C
D) Graph D
E) Graph E
Question
Question
Question
Question
Question
Question
Question
Refer to the following graphs to answer the following questions:
A.
B.
C.
D.
E.
Choose the graph that represents the following situation: Consumer demand for Princeton Pickles increases as customers find out that pickles are highly nutritious.
A) Graph A
B) Graph B
C) Graph C
D) Graph D
E) Graph E
A.
B. C. D. E.Choose the graph that represents the following situation: Consumer demand for Princeton Pickles increases as customers find out that pickles are highly nutritious.
A) Graph A
B) Graph B
C) Graph C
D) Graph D
E) Graph E
Question
Refer to the following graphs to answer the following questions:
A.
B.
C.
D.
E.
Choose the graph that represents the following situation: A documentary on bottled water demonstrates the high impact this product has on the environment.In response,consumers drastically reduce their consumption of this product.
A) Graph A
B) Graph B
C) Graph C
D) Graph D
E) Graph E
A.
B. C. D. E.Choose the graph that represents the following situation: A documentary on bottled water demonstrates the high impact this product has on the environment.In response,consumers drastically reduce their consumption of this product.
A) Graph A
B) Graph B
C) Graph C
D) Graph D
E) Graph E
Question
Use the following graph,which depicts Mighty Max's labor demand for his duffel bag business,to answer the following questions.The labor demand curve shown is calculated based on a duffel bag price of $10.
If the price increases from $10 to $20 per bag,what happens to the labor demand curve?
A) It shifts to the left.
B) It shifts to the right.
C) It remains unchanged.
D) The firm moves upward along the labor demand curve.
E) The firm moves downward along the labor demand curve.
If the price increases from $10 to $20 per bag,what happens to the labor demand curve?
A) It shifts to the left.
B) It shifts to the right.
C) It remains unchanged.
D) The firm moves upward along the labor demand curve.
E) The firm moves downward along the labor demand curve.
Question
Question
Question
Refer to the following graphs to answer the following questions:
A.
B.
C.
D.
E.
Choose the graph that represents the following situation: Out of fear of losing their jobs in a depressed economic climate,workers increase their rate of production.
A) Graph A
B) Graph B
C) Graph C
D) Graph D
E) Graph E
A.
B. C. D. E.Choose the graph that represents the following situation: Out of fear of losing their jobs in a depressed economic climate,workers increase their rate of production.
A) Graph A
B) Graph B
C) Graph C
D) Graph D
E) Graph E
Question
Question
Use the following graph,which depicts Mighty Max's labor demand for his duffel bag business,to answer the following questions.The labor demand curve shown is calculated based on a duffel bag price of $10.
Assume that the price of duffel bags is $10.If the marginal product of labor of the sixtieth worker drops by half,what is the value of the marginal product of labor of the sixtieth worker now?
A) $10
B) $15
C) $20
D) $25
E) $30
Assume that the price of duffel bags is $10.If the marginal product of labor of the sixtieth worker drops by half,what is the value of the marginal product of labor of the sixtieth worker now?
A) $10
B) $15
C) $20
D) $25
E) $30
Question
Question
Use the following graph,which depicts Mighty Max's labor demand for his duffel bag business,to answer the following questions.The labor demand curve shown is calculated based on a duffel bag price of $10.
If the wage of the fifth worker is $20 and his or her value of the marginal product of labor is $25,the firm
A) benefits by stopping at this level of labor.
B) is likely to fire the fifth worker.
C) asks this fifth worker to work overtime.
D) is likely to benefit by hiring more workers.
E) is likely to lose profit by hiring more workers.
Question
Question
Use the following graph,which depicts Mighty Max's labor demand for his duffel bag business,to answer the following questions.The labor demand curve shown is calculated based on a duffel bag price of $10.
Assume that the price per duffel bag rises from $10 to $20.What is the value of the marginal product of labor of the twentieth worker?
A) $30
B) $40
C) $50
D) $60
E) $70
Assume that the price per duffel bag rises from $10 to $20.What is the value of the marginal product of labor of the twentieth worker?
A) $30
B) $40
C) $50
D) $60
E) $70
Question
Question
Question
Refer to the following graphs to answer the following questions:
A.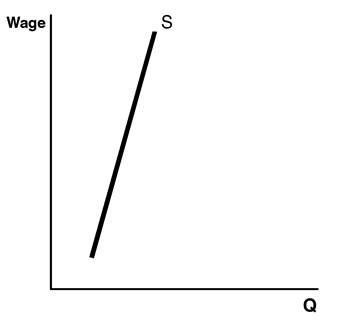
B.11efbc7a_aae2_b1ce_a154_5b2bc6d63cd5_TB4871_00
C.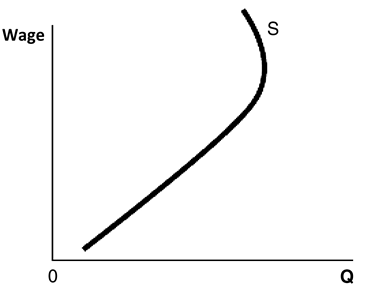
D.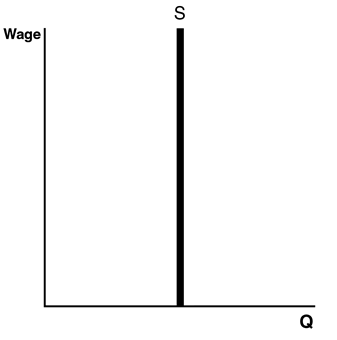
E.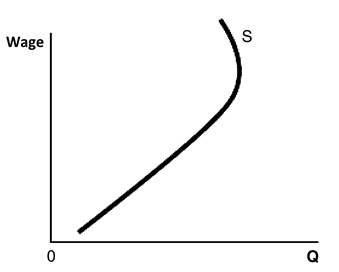
-Which graph shows the income effect dominating the substitution effect of higher wages?
A) Graph A
B) Graph B
C) Graph C
D) Graph D
E) Graph E
A.
B.11efbc7a_aae2_b1ce_a154_5b2bc6d63cd5_TB4871_00
C.
D.
E.
-Which graph shows the income effect dominating the substitution effect of higher wages?
A) Graph A
B) Graph B
C) Graph C
D) Graph D
E) Graph E
Question
Question
Question
Question
Refer to the following graphs to answer the following questions:
A.
B.11efbc7a_aae2_b1ce_a154_5b2bc6d63cd5_TB4871_00
C.
D.
E.
-Choose the graph that reflects this scenario: Roman decides that he values income much more strongly because he uses the money to buy goods he can enjoy more than free time.
A) Graph A
B) Graph B
C) Graph C
D) Graph D
E) Graph E
A.
B.11efbc7a_aae2_b1ce_a154_5b2bc6d63cd5_TB4871_00
C.
D.
E.
-Choose the graph that reflects this scenario: Roman decides that he values income much more strongly because he uses the money to buy goods he can enjoy more than free time.
A) Graph A
B) Graph B
C) Graph C
D) Graph D
E) Graph E
Question
Refer to the following graphs to answer the following questions:
A.
B.11efbc7a_aae2_b1ce_a154_5b2bc6d63cd5_TB4871_00
C.
D.
E.
-Which graph shows the substitution effect dominating the income effect of higher wages?
A) Graph A
B) Graph B
C) Graph C
D) Graph D
E) Graph E
A.
B.11efbc7a_aae2_b1ce_a154_5b2bc6d63cd5_TB4871_00
C.
D.
E.
-Which graph shows the substitution effect dominating the income effect of higher wages?
A) Graph A
B) Graph B
C) Graph C
D) Graph D
E) Graph E
Question
Question
Question
Question
Question
Question
Refer to the following graphs to answer the following questions:
A.
B.11efbc7a_aae2_b1ce_a154_5b2bc6d63cd5_TB4871_00
C.
D.
E.
-Which graph shows a person who has a fixed quantity of hours that he or she is willing to work per week?
A) Graph A
B) Graph B
C) Graph C
D) Graph D
E) Graph E
A.
B.11efbc7a_aae2_b1ce_a154_5b2bc6d63cd5_TB4871_00
C.
D.
E.
-Which graph shows a person who has a fixed quantity of hours that he or she is willing to work per week?
A) Graph A
B) Graph B
C) Graph C
D) Graph D
E) Graph E
Question
Question
Question
Question
Question
Question
Question
Question
Use the following table,which shows the supply and demand schedules for workers in the country of Hovian,to answer the following questions:
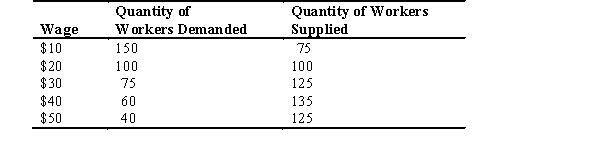
The equilibrium wage is
A) $10.
B) $20.
C) $30.
D) $40.
E) $50.
The equilibrium wage is
A) $10.
B) $20.
C) $30.
D) $40.
E) $50.
Question
Use the following table,which shows the supply and demand schedules for workers in the country of Hovian,to answer the following questions:
There will be a surplus of ________ workers at a wage of ________.
A) 75; $10
B) 100; $20
C) 135; $40
D) 40; $40
E) 50; $30
There will be a surplus of ________ workers at a wage of ________.
A) 75; $10
B) 100; $20
C) 135; $40
D) 40; $40
E) 50; $30
Question
Question
Use the following table,which shows the supply and demand schedules for workers in the country of Hovian,to answer the following questions:
If the wage is set temporarily at $15,it will need to ________ to restore equilibrium.
A) decrease to zero
B) increase to $35
C) fall
D) increase
E) remain unchanged
If the wage is set temporarily at $15,it will need to ________ to restore equilibrium.
A) decrease to zero
B) increase to $35
C) fall
D) increase
E) remain unchanged
Question
Use the following table,which shows the supply and demand schedules for workers in the country of Hovian,to answer the following questions:
If the wage is temporarily set at $25,it will need to ________ to restore equilibrium.
A) rise
B) fall
C) remain unchanged
D) decrease to zero
E) increase to $30
If the wage is temporarily set at $25,it will need to ________ to restore equilibrium.
A) rise
B) fall
C) remain unchanged
D) decrease to zero
E) increase to $30
Question
Use the following table,which shows the supply and demand schedules for workers in the country of Hovian,to answer the following questions:
The supply schedule indicates that the labor supply curve is
A) backward-bending.
B) upward-sloping.
C) downward-sloping.
D) vertical.
E) horizontal.
The supply schedule indicates that the labor supply curve is
A) backward-bending.
B) upward-sloping.
C) downward-sloping.
D) vertical.
E) horizontal.
Question
The following graph represents Zendar's labor market.Use this graph to answer the following questions:
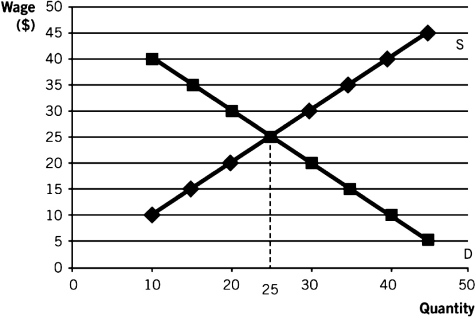
At all wages below ________,there will be ________.
A) $10; a surplus
B) $25; a shortage
C) $40; a surplus
D) $35; no labor supplied
E) $20; no labor demanded
At all wages below ________,there will be ________.
A) $10; a surplus
B) $25; a shortage
C) $40; a surplus
D) $35; no labor supplied
E) $20; no labor demanded
Question
Question
The following graph represents Zendar's labor market.Use this graph to answer the following questions:
What is the equilibrium number of workers in Zendar?
A) 20
B) 25
C) 30
D) 35
E) 40
What is the equilibrium number of workers in Zendar?
A) 20
B) 25
C) 30
D) 35
E) 40
Question
The following graph represents Zendar's labor market.Use this graph to answer the following questions:
At a wage of ________,________ workers are demanded.
A) $5; 10
B) $10; 35
C) $15; 40
D) $40; 10
E) $45; 45
At a wage of ________,________ workers are demanded.
A) $5; 10
B) $10; 35
C) $15; 40
D) $40; 10
E) $45; 45
Question
Question
Question
The following graph represents Zendar's labor market.Use this graph to answer the following questions:
To have no surplus or shortage of workers in Zendar,what does the wage rate have to be?
A) $5
B) $10
C) $15
D) $20
E) $25
To have no surplus or shortage of workers in Zendar,what does the wage rate have to be?
A) $5
B) $10
C) $15
D) $20
E) $25
Question
Use the following table,which shows the supply and demand schedules for workers in the country of Hovian,to answer the following questions:
Wages above ________ will cause a ________.
A) $10; surplus
B) $50; shortage
C) $20; surplus
D) $30; shortage
E) $40; shortage
Wages above ________ will cause a ________.
A) $10; surplus
B) $50; shortage
C) $20; surplus
D) $30; shortage
E) $40; shortage
Question
The following graph represents Zendar's labor market.Use this graph to answer the following questions:
At a wage of ________,there is a ________ of ________ workers.
A) $10; surplus; 30
B) $40; shortage; 30
C) $10; shortage; 30
D) $35; shortage; 20
E) $25; surplus; 10
At a wage of ________,there is a ________ of ________ workers.
A) $10; surplus; 30
B) $40; shortage; 30
C) $10; shortage; 30
D) $35; shortage; 20
E) $25; surplus; 10
Question
Question
Question
Question

Unlock Deck
Sign up to unlock the cards in this deck!
Unlock Deck
Unlock Deck
1/172
Play
Full screen (f)
Deck 14: The Demand and Supply of Resources
1
Use the following information to answer the following questions:
Mickey L.Douglas,owner of MLD Incorporated,knows that the marginal product of labor (MPL)for his workers can be defined as follows:
MPL = 32 - L
The total output a given level of workers can produce is found as:
Q = 32L - L2
He also knows that the price of his output is $3.His profits can be found as:
Profit = (P * Q)- (W * L)
-What additional amount of output does the thirtieth worker contribute?
A) 150 units
B) 60 units
C) 2 units
D) 14 units
E) 9 units
Mickey L.Douglas,owner of MLD Incorporated,knows that the marginal product of labor (MPL)for his workers can be defined as follows:
MPL = 32 - L
The total output a given level of workers can produce is found as:
Q = 32L -
L2He also knows that the price of his output is $3.His profits can be found as:
Profit = (P * Q)- (W * L)
-What additional amount of output does the thirtieth worker contribute?
A) 150 units
B) 60 units
C) 2 units
D) 14 units
E) 9 units
2 units
2
Use the following graph,which depicts Mighty Max's labor demand for his duffel bag business,to answer the following questions.The labor demand curve shown is calculated based on a duffel bag price of $10.
If 80 workers are hired,you know that the wage rate must be
A) $25.
B) $20.
C) $15.
D) $10.
E) $5.
If 80 workers are hired,you know that the wage rate must be
A) $25.
B) $20.
C) $15.
D) $10.
E) $5.
$15.
3
Derived demand is
A) consumer demand for goods and services.
B) based on the prices of factors of production.
C) the demand for factors of production directly by business.
D) the demand for factors of production dependent on consumer demand for output.
E) calculated for firms.
A) consumer demand for goods and services.
B) based on the prices of factors of production.
C) the demand for factors of production directly by business.
D) the demand for factors of production dependent on consumer demand for output.
E) calculated for firms.
the demand for factors of production dependent on consumer demand for output.
4
The worker productivity of Cutie Cupcakes is presented in the following table.Use the table to answer the following questions:
Cupcakes previously sold for $3 and now sell for $5.The number of workers that Cutie Cupcakes hires will
A) fall.
B) remain unchanged,but employees will have to work overtime.
C) increase.
D) stay the same.
E) increase indefinitely.
Cupcakes previously sold for $3 and now sell for $5.The number of workers that Cutie Cupcakes hires will
A) fall.
B) remain unchanged,but employees will have to work overtime.
C) increase.
D) stay the same.
E) increase indefinitely.
Unlock Deck
Unlock for access to all 172 flashcards in this deck.
Unlock Deck
k this deck
5
Factors of production are
A) goods and services.
B) used to make goods and services.
C) purchased by the consumer for personal use.
D) sold by the consumer for income.
E) the property of firms.
A) goods and services.
B) used to make goods and services.
C) purchased by the consumer for personal use.
D) sold by the consumer for income.
E) the property of firms.
Unlock Deck
Unlock for access to all 172 flashcards in this deck.
Unlock Deck
k this deck
6
Which of the following is NOT a factor of production?
A) land
B) output
C) inputs
D) entrepreneurship
E) capital
A) land
B) output
C) inputs
D) entrepreneurship
E) capital
Unlock Deck
Unlock for access to all 172 flashcards in this deck.
Unlock Deck
k this deck
7
Refer to the following table to answer the following questions:
If the price of output is $2 and the wage for workers is $4,how many workers will the firm hire?
A) one
B) two
C) three
D) four
E) five
If the price of output is $2 and the wage for workers is $4,how many workers will the firm hire?
A) one
B) two
C) three
D) four
E) five
Unlock Deck
Unlock for access to all 172 flashcards in this deck.
Unlock Deck
k this deck
8
The worker productivity of Cutie Cupcakes is presented in the following table.Use the table to answer the following questions:
When Cutie Cupcakes hires its three hundredth worker,what is that worker's marginal product of labor?
A) 300 cupcakes
B) 200 cupcakes
C) 100 cupcakes
D) 2 cupcakes
E) 3 cupcakes
When Cutie Cupcakes hires its three hundredth worker,what is that worker's marginal product of labor?
A) 300 cupcakes
B) 200 cupcakes
C) 100 cupcakes
D) 2 cupcakes
E) 3 cupcakes
Unlock Deck
Unlock for access to all 172 flashcards in this deck.
Unlock Deck
k this deck
9
The worker productivity of Cutie Cupcakes is presented in the following table.Use the table to answer the following questions:
If the wage is $8 and the price of a cupcake is $4,what are Cutie Cupcakes' profits at the optimal amount of labor?
A) $2,200
B) $2,600
C) $4,600
D) $5,000
E) $7,500
If the wage is $8 and the price of a cupcake is $4,what are Cutie Cupcakes' profits at the optimal amount of labor?
A) $2,200
B) $2,600
C) $4,600
D) $5,000
E) $7,500
Unlock Deck
Unlock for access to all 172 flashcards in this deck.
Unlock Deck
k this deck
10
Derived demand best describes the demand for which of the following options?
A) cupcakes
B) canned soda
C) computer chips
D) cat food
E) cars
A) cupcakes
B) canned soda
C) computer chips
D) cat food
E) cars
Unlock Deck
Unlock for access to all 172 flashcards in this deck.
Unlock Deck
k this deck
11
Refer to the following table to answer the following questions:
If the price of output falls from $5 to $2,the value of the marginal product of labor of all workers
A) increases.
B) remains unchanged.
C) increases at an increasing rate.
D) decreases at an increasing rate.
E) decreases.
If the price of output falls from $5 to $2,the value of the marginal product of labor of all workers
A) increases.
B) remains unchanged.
C) increases at an increasing rate.
D) decreases at an increasing rate.
E) decreases.
Unlock Deck
Unlock for access to all 172 flashcards in this deck.
Unlock Deck
k this deck
12
Use the following information to answer the following questions:
Mickey L.Douglas,owner of MLD Incorporated,knows that the marginal product of labor (MPL)for his workers can be defined as follows:
MPL = 32 - L
The total output a given level of workers can produce is found as:
Q = 32L - L2
He also knows that the price of his output is $3.His profits can be found as:
Profit = (P * Q)- (W * L)
-What wage would be required to allow Mickey to hire the twenty-fifth worker?
A) $3
B) $7
C) $21
D) $125
E) $25
Mickey L.Douglas,owner of MLD Incorporated,knows that the marginal product of labor (MPL)for his workers can be defined as follows:
MPL = 32 - L
The total output a given level of workers can produce is found as:
Q = 32L -
L2He also knows that the price of his output is $3.His profits can be found as:
Profit = (P * Q)- (W * L)
-What wage would be required to allow Mickey to hire the twenty-fifth worker?
A) $3
B) $7
C) $21
D) $125
E) $25
Unlock Deck
Unlock for access to all 172 flashcards in this deck.
Unlock Deck
k this deck
13
The diminishing marginal product of labor exists when the last worker hired produces ________ the previous worker.
A) more output than
B) more value than
C) less value than
D) the same amount of output as
E) the same amount of value as
A) more output than
B) more value than
C) less value than
D) the same amount of output as
E) the same amount of value as
Unlock Deck
Unlock for access to all 172 flashcards in this deck.
Unlock Deck
k this deck
14
Refer to the following table to answer the following questions:
If the price of output is $5,the value of the marginal product of labor of the third worker is
A) $8.
B) $30.
C) $40.
D) $38.
E) $190.
If the price of output is $5,the value of the marginal product of labor of the third worker is
A) $8.
B) $30.
C) $40.
D) $38.
E) $190.
Unlock Deck
Unlock for access to all 172 flashcards in this deck.
Unlock Deck
k this deck
15
Use the following information to answer the following questions:
Mickey L.Douglas,owner of MLD Incorporated,knows that the marginal product of labor (MPL)for his workers can be defined as follows:
MPL = 32 - L
The total output a given level of workers can produce is found as:
Q = 32L - L2
He also knows that the price of his output is $3.His profits can be found as:
Profit = (P * Q)- (W * L)
-What is the value of additional output produced by the twelfth worker?
A) $20
B) $100
C) $10
D) $60
E) $80
Mickey L.Douglas,owner of MLD Incorporated,knows that the marginal product of labor (MPL)for his workers can be defined as follows:
MPL = 32 - L
The total output a given level of workers can produce is found as:
Q = 32L -
L2He also knows that the price of his output is $3.His profits can be found as:
Profit = (P * Q)- (W * L)
-What is the value of additional output produced by the twelfth worker?
A) $20
B) $100
C) $10
D) $60
E) $80
Unlock Deck
Unlock for access to all 172 flashcards in this deck.
Unlock Deck
k this deck
16
Derived demand is NOT represented by the demand for
A) bakers.
B) home ovens.
C) fast-food fryers.
D) office space.
E) car engines.
A) bakers.
B) home ovens.
C) fast-food fryers.
D) office space.
E) car engines.
Unlock Deck
Unlock for access to all 172 flashcards in this deck.
Unlock Deck
k this deck
17
The area underneath a firm's labor demand curve and above the market wage is the graphical representation of the firm's
A) revenues.
B) costs.
C) profits.
D) losses.
E) hiring decisions.
A) revenues.
B) costs.
C) profits.
D) losses.
E) hiring decisions.
Unlock Deck
Unlock for access to all 172 flashcards in this deck.
Unlock Deck
k this deck
18
Use the following graph,which depicts Mighty Max's labor demand for his duffel bag business,to answer the following questions.The labor demand curve shown is calculated based on a duffel bag price of $10.
If the wage is $20,Mighty Max will hire __________ workers.
A) 20
B) 30
C) 40
D) 50
E) 60
If the wage is $20,Mighty Max will hire __________ workers.
A) 20
B) 30
C) 40
D) 50
E) 60
Unlock Deck
Unlock for access to all 172 flashcards in this deck.
Unlock Deck
k this deck
19
The marginal product of labor is the
A) additional amount of consumer goods that can be bought from an additional hour's worth of work.
B) additional amount of inputs a firm demands based on a change in consumer demand for the output.
C) additional amount of output that can be produced from hiring one more worker.
D) decreasing amount of output that can be produced from hiring one more worker.
E) value of production from the last worker hired.
Unlock Deck
Unlock for access to all 172 flashcards in this deck.
Unlock Deck
k this deck
20
The fact that workers must share a limited amount of space and equipment results in ________ marginal productivity.
A) increasing
B) constant
C) fluctuating
D) unpredictable
E) diminishing
A) increasing
B) constant
C) fluctuating
D) unpredictable
E) diminishing
Unlock Deck
Unlock for access to all 172 flashcards in this deck.
Unlock Deck
k this deck
21
The fundamental decision faced by workers is called
A) labor demand.
B) labor supply.
C) income effect.
D) the labor-leisure trade-off.
E) the substitution effect.
A) labor demand.
B) labor supply.
C) income effect.
D) the labor-leisure trade-off.
E) the substitution effect.
Unlock Deck
Unlock for access to all 172 flashcards in this deck.
Unlock Deck
k this deck
22
Refer to the following graphs to answer the following questions:
A.
B.
C.
D.
E.
Choose the graph that represents the following situation: The government raises the minimum wage.
A) Graph A
B) Graph B
C) Graph C
D) Graph D
E) Graph E
A.
B. C. D. E.Choose the graph that represents the following situation: The government raises the minimum wage.
A) Graph A
B) Graph B
C) Graph C
D) Graph D
E) Graph E
Unlock Deck
Unlock for access to all 172 flashcards in this deck.
Unlock Deck
k this deck
23
Yolanda owns a temp agency.She sees demand for her workers increase because firms prefer a more contingent workforce.The value of the marginal product of labor of her temps
A) stays the same.
B) increases because the temps produce more per hour.
C) decreases because the temps know they are going to get jobs.
D) increases because the price of their services is higher.
E) falls because job uncertainty lowers productivity.
A) stays the same.
B) increases because the temps produce more per hour.
C) decreases because the temps know they are going to get jobs.
D) increases because the price of their services is higher.
E) falls because job uncertainty lowers productivity.
Unlock Deck
Unlock for access to all 172 flashcards in this deck.
Unlock Deck
k this deck
24
If workers become more productive in a given occupation,they will likely see their employment ________.
A) fall
B) double
C) rise
D) stay the same
E) go into overtime
A) fall
B) double
C) rise
D) stay the same
E) go into overtime
Unlock Deck
Unlock for access to all 172 flashcards in this deck.
Unlock Deck
k this deck
25
The income effect describes the
A) incentive to change jobs.
B) decision whether to join the labor force.
C) decision to ask for a raise.
D) incentive to work more when the wage rises.
E) incentive to work less when the wage rises.
A) incentive to change jobs.
B) decision whether to join the labor force.
C) decision to ask for a raise.
D) incentive to work more when the wage rises.
E) incentive to work less when the wage rises.
Unlock Deck
Unlock for access to all 172 flashcards in this deck.
Unlock Deck
k this deck
26
Talia just applied for a position with Rory's firm.Rory knows that Talia will earn $20 an hour and can produce a value of the marginal product of labor (VMPL)of $40.Rory will ________ Talia because her VMPL is ________.
A) hire; positive
B) not hire; positive
C) hire; negative
D) not hire; negative
E) possibly hire; positive
A) hire; positive
B) not hire; positive
C) hire; negative
D) not hire; negative
E) possibly hire; positive
Unlock Deck
Unlock for access to all 172 flashcards in this deck.
Unlock Deck
k this deck
27
The use of farm machinery to plant and harvest crops has increased because it is more productive than the typical farmhand.Demand for farmhands has
A) remained steady.
B) shifted to other areas of the farm.
C) decreased.
D) fallen to zero.
E) increased.
A) remained steady.
B) shifted to other areas of the farm.
C) decreased.
D) fallen to zero.
E) increased.
Unlock Deck
Unlock for access to all 172 flashcards in this deck.
Unlock Deck
k this deck
28
If the price of pencils falls,the marginal product of labor will ________ and the value of the marginal product of labor will ________.
A) fall; fall
B) remain unchanged; increase
C) rise; rise
D) remain unchanged; decrease
E) remain unchanged; remain unchanged
A) fall; fall
B) remain unchanged; increase
C) rise; rise
D) remain unchanged; decrease
E) remain unchanged; remain unchanged
Unlock Deck
Unlock for access to all 172 flashcards in this deck.
Unlock Deck
k this deck
29
Refer to the following graphs to answer the following questions:
A.
B.
C.
D.
E.
Choose the graph that represents the following situation: Consumer demand for Princeton Pickles increases as customers find out that pickles are highly nutritious.
A) Graph A
B) Graph B
C) Graph C
D) Graph D
E) Graph E
A.
B. C. D. E.Choose the graph that represents the following situation: Consumer demand for Princeton Pickles increases as customers find out that pickles are highly nutritious.
A) Graph A
B) Graph B
C) Graph C
D) Graph D
E) Graph E
Unlock Deck
Unlock for access to all 172 flashcards in this deck.
Unlock Deck
k this deck
30
Refer to the following graphs to answer the following questions:
A.
B.
C.
D.
E.
Choose the graph that represents the following situation: A documentary on bottled water demonstrates the high impact this product has on the environment.In response,consumers drastically reduce their consumption of this product.
A) Graph A
B) Graph B
C) Graph C
D) Graph D
E) Graph E
A.
B. C. D. E.Choose the graph that represents the following situation: A documentary on bottled water demonstrates the high impact this product has on the environment.In response,consumers drastically reduce their consumption of this product.
A) Graph A
B) Graph B
C) Graph C
D) Graph D
E) Graph E
Unlock Deck
Unlock for access to all 172 flashcards in this deck.
Unlock Deck
k this deck
31
Use the following graph,which depicts Mighty Max's labor demand for his duffel bag business,to answer the following questions.The labor demand curve shown is calculated based on a duffel bag price of $10.
If the price increases from $10 to $20 per bag,what happens to the labor demand curve?
A) It shifts to the left.
B) It shifts to the right.
C) It remains unchanged.
D) The firm moves upward along the labor demand curve.
E) The firm moves downward along the labor demand curve.
If the price increases from $10 to $20 per bag,what happens to the labor demand curve?
A) It shifts to the left.
B) It shifts to the right.
C) It remains unchanged.
D) The firm moves upward along the labor demand curve.
E) The firm moves downward along the labor demand curve.
Unlock Deck
Unlock for access to all 172 flashcards in this deck.
Unlock Deck
k this deck
32
Bobby knows that she is producing a value just equal to her wage.If the price of what she makes falls,Bobby knows that she
A) will be able to keep her job.
B) is likely to work overtime.
C) will work less.
D) is likely to be fired.
E) will not be able to find work anywhere.
A) will be able to keep her job.
B) is likely to work overtime.
C) will work less.
D) is likely to be fired.
E) will not be able to find work anywhere.
Unlock Deck
Unlock for access to all 172 flashcards in this deck.
Unlock Deck
k this deck
33
As computer usage in companies and in the home has increased,the labor demand for information technology (IT)workers has
A) remained steady.
B) decreased.
C) fallen to zero.
D) infinitely increased.
E) increased.
A) remained steady.
B) decreased.
C) fallen to zero.
D) infinitely increased.
E) increased.
Unlock Deck
Unlock for access to all 172 flashcards in this deck.
Unlock Deck
k this deck
34
Refer to the following graphs to answer the following questions:
A.
B.
C.
D.
E.
Choose the graph that represents the following situation: Out of fear of losing their jobs in a depressed economic climate,workers increase their rate of production.
A) Graph A
B) Graph B
C) Graph C
D) Graph D
E) Graph E
A.
B. C. D. E.Choose the graph that represents the following situation: Out of fear of losing their jobs in a depressed economic climate,workers increase their rate of production.
A) Graph A
B) Graph B
C) Graph C
D) Graph D
E) Graph E
Unlock Deck
Unlock for access to all 172 flashcards in this deck.
Unlock Deck
k this deck
35
The substitution effect describes the
A) incentive to work more when the wage rises.
B) incentive to work less when the wage rises.
C) decision whether to work more or less.
D) decision whether to join the labor force.
E) incentive to change jobs.
A) incentive to work more when the wage rises.
B) incentive to work less when the wage rises.
C) decision whether to work more or less.
D) decision whether to join the labor force.
E) incentive to change jobs.
Unlock Deck
Unlock for access to all 172 flashcards in this deck.
Unlock Deck
k this deck
36
Use the following graph,which depicts Mighty Max's labor demand for his duffel bag business,to answer the following questions.The labor demand curve shown is calculated based on a duffel bag price of $10.
Assume that the price of duffel bags is $10.If the marginal product of labor of the sixtieth worker drops by half,what is the value of the marginal product of labor of the sixtieth worker now?
A) $10
B) $15
C) $20
D) $25
E) $30
Assume that the price of duffel bags is $10.If the marginal product of labor of the sixtieth worker drops by half,what is the value of the marginal product of labor of the sixtieth worker now?
A) $10
B) $15
C) $20
D) $25
E) $30
Unlock Deck
Unlock for access to all 172 flashcards in this deck.
Unlock Deck
k this deck
37
If more of the production process for automobiles were switched over to machines,the demand for auto factory assembly line workers would ________ machine maintenance.
A) decline but increase
B) decline and also decline
C) increase but decline
D) increase and also increase
E) remained unchanged but increase
A) decline but increase
B) decline and also decline
C) increase but decline
D) increase and also increase
E) remained unchanged but increase
Unlock Deck
Unlock for access to all 172 flashcards in this deck.
Unlock Deck
k this deck
38
Use the following graph,which depicts Mighty Max's labor demand for his duffel bag business,to answer the following questions.The labor demand curve shown is calculated based on a duffel bag price of $10.
If the wage of the fifth worker is $20 and his or her value of the marginal product of labor is $25,the firm
A) benefits by stopping at this level of labor.
B) is likely to fire the fifth worker.
C) asks this fifth worker to work overtime.
D) is likely to benefit by hiring more workers.
E) is likely to lose profit by hiring more workers.
Unlock Deck
Unlock for access to all 172 flashcards in this deck.
Unlock Deck
k this deck
39
The backward-bending labor supply curve occurs because workers value leisure
A) and income differently as wages change.
B) consistently more than they do income at all wages.
C) consistently less than they do income at all wages.
D) and income by the same amount at all wages.
E) and income by fluctuating,unpredictable amounts at any wage.
A) and income differently as wages change.
B) consistently more than they do income at all wages.
C) consistently less than they do income at all wages.
D) and income by the same amount at all wages.
E) and income by fluctuating,unpredictable amounts at any wage.
Unlock Deck
Unlock for access to all 172 flashcards in this deck.
Unlock Deck
k this deck
40
Use the following graph,which depicts Mighty Max's labor demand for his duffel bag business,to answer the following questions.The labor demand curve shown is calculated based on a duffel bag price of $10.
Assume that the price per duffel bag rises from $10 to $20.What is the value of the marginal product of labor of the twentieth worker?
A) $30
B) $40
C) $50
D) $60
E) $70
Assume that the price per duffel bag rises from $10 to $20.What is the value of the marginal product of labor of the twentieth worker?
A) $30
B) $40
C) $50
D) $60
E) $70
Unlock Deck
Unlock for access to all 172 flashcards in this deck.
Unlock Deck
k this deck
41
The backward-bending labor supply curve has its shape because,at
A) low wages,the income effect dominates the substitution effect,but the reverse occurs at high wages.
B) high wages,the substitution effect dominates the income effect,but the reverse occurs at low wages.
C) low wages,the substitution effect dominates the income effect,but the reverse occurs at high wages.
D) all wages,the income effect dominates the substitution effect.
E) all wages,the substitution effect dominates the income effect.
Unlock Deck
Unlock for access to all 172 flashcards in this deck.
Unlock Deck
k this deck
42
When Noah's wage rises and he decides to work more hours,we know that the ________ effect has dominated the ________ effect.
A) substitution; income
B) labor; leisure
C) income; substitution
D) leisure; labor
E) substitution; leisure
A) substitution; income
B) labor; leisure
C) income; substitution
D) leisure; labor
E) substitution; leisure
Unlock Deck
Unlock for access to all 172 flashcards in this deck.
Unlock Deck
k this deck
43
Refer to the following graphs to answer the following questions:
A.
B.11efbc7a_aae2_b1ce_a154_5b2bc6d63cd5_TB4871_00
C.
D.
E.
-Which graph shows the income effect dominating the substitution effect of higher wages?
A) Graph A
B) Graph B
C) Graph C
D) Graph D
E) Graph E
A.
B.11efbc7a_aae2_b1ce_a154_5b2bc6d63cd5_TB4871_00
C.
D.
E.
-Which graph shows the income effect dominating the substitution effect of higher wages?
A) Graph A
B) Graph B
C) Graph C
D) Graph D
E) Graph E
Unlock Deck
Unlock for access to all 172 flashcards in this deck.
Unlock Deck
k this deck
44
Labor supply is the relationship between
A) wages and willingness to hire workers.
B) price of output and amount of output for sale.
C) price of capital and amount of capital for sale.
D) wages and willingness to work.
E) wages and amount of output for sale.
A) wages and willingness to hire workers.
B) price of output and amount of output for sale.
C) price of capital and amount of capital for sale.
D) wages and willingness to work.
E) wages and amount of output for sale.
Unlock Deck
Unlock for access to all 172 flashcards in this deck.
Unlock Deck
k this deck
45
No matter how high his wage rises,Johann will always work more.His labor supply curve is
A) downward-sloping.
B) horizontal.
C) vertical.
D) upward-sloping.
E) upward-sloping at an increasing rate.
A) downward-sloping.
B) horizontal.
C) vertical.
D) upward-sloping.
E) upward-sloping at an increasing rate.
Unlock Deck
Unlock for access to all 172 flashcards in this deck.
Unlock Deck
k this deck
46
Immigration is when
A) foreign persons enter another country.
B) foreign persons leave another country.
C) citizens move to another country.
D) citizens move within their own country.
E) foreign persons move within their own country.
A) foreign persons enter another country.
B) foreign persons leave another country.
C) citizens move to another country.
D) citizens move within their own country.
E) foreign persons move within their own country.
Unlock Deck
Unlock for access to all 172 flashcards in this deck.
Unlock Deck
k this deck
47
Refer to the following graphs to answer the following questions:
A.
B.11efbc7a_aae2_b1ce_a154_5b2bc6d63cd5_TB4871_00
C.
D.
E.
-Choose the graph that reflects this scenario: Roman decides that he values income much more strongly because he uses the money to buy goods he can enjoy more than free time.
A) Graph A
B) Graph B
C) Graph C
D) Graph D
E) Graph E
A.
B.11efbc7a_aae2_b1ce_a154_5b2bc6d63cd5_TB4871_00
C.
D.
E.
-Choose the graph that reflects this scenario: Roman decides that he values income much more strongly because he uses the money to buy goods he can enjoy more than free time.
A) Graph A
B) Graph B
C) Graph C
D) Graph D
E) Graph E
Unlock Deck
Unlock for access to all 172 flashcards in this deck.
Unlock Deck
k this deck
48
Refer to the following graphs to answer the following questions:
A.
B.11efbc7a_aae2_b1ce_a154_5b2bc6d63cd5_TB4871_00
C.
D.
E.
-Which graph shows the substitution effect dominating the income effect of higher wages?
A) Graph A
B) Graph B
C) Graph C
D) Graph D
E) Graph E
A.
B.11efbc7a_aae2_b1ce_a154_5b2bc6d63cd5_TB4871_00
C.
D.
E.
-Which graph shows the substitution effect dominating the income effect of higher wages?
A) Graph A
B) Graph B
C) Graph C
D) Graph D
E) Graph E
Unlock Deck
Unlock for access to all 172 flashcards in this deck.
Unlock Deck
k this deck
49
More job opportunities open up in the South,prompting labor supply curves in northern states to ________ and in southern states to ________.
A) remain unchanged; shift right
B) shift right; shift right
C) shift left; shift right
D) shift left; remain unchanged
E) shift left; shift left
A) remain unchanged; shift right
B) shift right; shift right
C) shift left; shift right
D) shift left; remain unchanged
E) shift left; shift left
Unlock Deck
Unlock for access to all 172 flashcards in this deck.
Unlock Deck
k this deck
50
If you know that the substitution effect dominates the income effect when Jasper's wage rises,you can tell that his labor supply curve is
A) upward-sloping.
B) downward-sloping.
C) vertical.
D) upward-sloping at an increasing rate.
E) downward-sloping at an increasing rate.
A) upward-sloping.
B) downward-sloping.
C) vertical.
D) upward-sloping at an increasing rate.
E) downward-sloping at an increasing rate.
Unlock Deck
Unlock for access to all 172 flashcards in this deck.
Unlock Deck
k this deck
51
When people make more money,they sometimes take more vacation time.Based on this information,we can say that leisure is a(n)________ good.
A) substitute
B) complement
C) inferior
D) Giffen
E) normal
A) substitute
B) complement
C) inferior
D) Giffen
E) normal
Unlock Deck
Unlock for access to all 172 flashcards in this deck.
Unlock Deck
k this deck
52
The minimum wage is increased to $15.This higher wage might ________ labor force participation,shifting the labor supply curve to the ________.
A) decrease; right
B) increase; left
C) decrease; left
D) increase; right
E) not change; right
A) decrease; right
B) increase; left
C) decrease; left
D) increase; right
E) not change; right
Unlock Deck
Unlock for access to all 172 flashcards in this deck.
Unlock Deck
k this deck
53
When the opportunity cost of leisure is high,people tend to work ________ hours.When it is low,people tend to work ________ hours.
A) the same; fewer
B) more; fewer
C) fewer; more
D) more; the same
E) fewer; the same
A) the same; fewer
B) more; fewer
C) fewer; more
D) more; the same
E) fewer; the same
Unlock Deck
Unlock for access to all 172 flashcards in this deck.
Unlock Deck
k this deck
54
Refer to the following graphs to answer the following questions:
A.
B.11efbc7a_aae2_b1ce_a154_5b2bc6d63cd5_TB4871_00
C.
D.
E.
-Which graph shows a person who has a fixed quantity of hours that he or she is willing to work per week?
A) Graph A
B) Graph B
C) Graph C
D) Graph D
E) Graph E
A.
B.11efbc7a_aae2_b1ce_a154_5b2bc6d63cd5_TB4871_00
C.
D.
E.
-Which graph shows a person who has a fixed quantity of hours that he or she is willing to work per week?
A) Graph A
B) Graph B
C) Graph C
D) Graph D
E) Graph E
Unlock Deck
Unlock for access to all 172 flashcards in this deck.
Unlock Deck
k this deck
55
Rowan is deciding whether to pick up more hours at work or to take a vacation.This decision best describes
A) her hours decision.
B) her labor force participation decision.
C) the value she places on income.
D) the labor-leisure trade-off.
E) the necessity of income.
A) her hours decision.
B) her labor force participation decision.
C) the value she places on income.
D) the labor-leisure trade-off.
E) the necessity of income.
Unlock Deck
Unlock for access to all 172 flashcards in this deck.
Unlock Deck
k this deck
56
Ummal travels back in time to deposit $100 in a high-interest-bearing savings account.When she returns to the present,she is a billionaire.We can expect Ummal to work ________ hours because of the ________ effect.
A) more; substitution
B) more; income
C) fewer; substitution
D) more; labor-leisure
E) fewer; income
A) more; substitution
B) more; income
C) fewer; substitution
D) more; labor-leisure
E) fewer; income
Unlock Deck
Unlock for access to all 172 flashcards in this deck.
Unlock Deck
k this deck
57
The citizens of Robbinsville notice that their friends and family in the neighboring city of Deville are earning higher wages.We would expect the labor supply in Robbinsville ________ and the labor supply in Deville to ________.
A) shift right; shift right
B) shift left; shift left
C) remain unchanged; shift right
D) shift left; shift right
E) shift right; shift left
A) shift right; shift right
B) shift left; shift left
C) remain unchanged; shift right
D) shift left; shift right
E) shift right; shift left
Unlock Deck
Unlock for access to all 172 flashcards in this deck.
Unlock Deck
k this deck
58
When Franklin earns more income but still works less,leisure is a ________ good for him.
A) substitute
B) complement
C) luxury
D) necessity
E) normal
A) substitute
B) complement
C) luxury
D) necessity
E) normal
Unlock Deck
Unlock for access to all 172 flashcards in this deck.
Unlock Deck
k this deck
59
When their wages rise,Raymond works more and Brandi works less.We can infer that Raymond values income ________ than Brandi.
A) less
B) the same
C) more
D) half as much
E) a third more
A) less
B) the same
C) more
D) half as much
E) a third more
Unlock Deck
Unlock for access to all 172 flashcards in this deck.
Unlock Deck
k this deck
60
Migration is when
A) foreign persons enter a country.
B) foreign persons leave a country.
C) citizens move to another country.
D) citizens move within their own country.
E) foreign persons move within their own country.
A) foreign persons enter a country.
B) foreign persons leave a country.
C) citizens move to another country.
D) citizens move within their own country.
E) foreign persons move within their own country.
Unlock Deck
Unlock for access to all 172 flashcards in this deck.
Unlock Deck
k this deck
61
The government lowers the retirement age to 55.We would expect to see the labor supply curve
A) stay the same.
B) shift left.
C) stay the same but move upward.
D) stay the same but move downward.
E) shift right.
A) stay the same.
B) shift left.
C) stay the same but move upward.
D) stay the same but move downward.
E) shift right.
Unlock Deck
Unlock for access to all 172 flashcards in this deck.
Unlock Deck
k this deck
62
Use the following table,which shows the supply and demand schedules for workers in the country of Hovian,to answer the following questions:
The equilibrium wage is
A) $10.
B) $20.
C) $30.
D) $40.
E) $50.
The equilibrium wage is
A) $10.
B) $20.
C) $30.
D) $40.
E) $50.
Unlock Deck
Unlock for access to all 172 flashcards in this deck.
Unlock Deck
k this deck
63
Use the following table,which shows the supply and demand schedules for workers in the country of Hovian,to answer the following questions:
There will be a surplus of ________ workers at a wage of ________.
A) 75; $10
B) 100; $20
C) 135; $40
D) 40; $40
E) 50; $30
There will be a surplus of ________ workers at a wage of ________.
A) 75; $10
B) 100; $20
C) 135; $40
D) 40; $40
E) 50; $30
Unlock Deck
Unlock for access to all 172 flashcards in this deck.
Unlock Deck
k this deck
64
With a large group of citizens leaving a country,what will happen to the equilibrium wage and quantity of workers employed?
A) Both will fall.
B) Both will rise.
C) The equilibrium number of workers will rise and the wage will fall.
D) The equilibrium number of workers will fall and the wage will fall.
E) The equilibrium number of workers will fall and the wage will rise.
A) Both will fall.
B) Both will rise.
C) The equilibrium number of workers will rise and the wage will fall.
D) The equilibrium number of workers will fall and the wage will fall.
E) The equilibrium number of workers will fall and the wage will rise.
Unlock Deck
Unlock for access to all 172 flashcards in this deck.
Unlock Deck
k this deck
65
Use the following table,which shows the supply and demand schedules for workers in the country of Hovian,to answer the following questions:
If the wage is set temporarily at $15,it will need to ________ to restore equilibrium.
A) decrease to zero
B) increase to $35
C) fall
D) increase
E) remain unchanged
If the wage is set temporarily at $15,it will need to ________ to restore equilibrium.
A) decrease to zero
B) increase to $35
C) fall
D) increase
E) remain unchanged
Unlock Deck
Unlock for access to all 172 flashcards in this deck.
Unlock Deck
k this deck
66
Use the following table,which shows the supply and demand schedules for workers in the country of Hovian,to answer the following questions:
If the wage is temporarily set at $25,it will need to ________ to restore equilibrium.
A) rise
B) fall
C) remain unchanged
D) decrease to zero
E) increase to $30
If the wage is temporarily set at $25,it will need to ________ to restore equilibrium.
A) rise
B) fall
C) remain unchanged
D) decrease to zero
E) increase to $30
Unlock Deck
Unlock for access to all 172 flashcards in this deck.
Unlock Deck
k this deck
67
Use the following table,which shows the supply and demand schedules for workers in the country of Hovian,to answer the following questions:
The supply schedule indicates that the labor supply curve is
A) backward-bending.
B) upward-sloping.
C) downward-sloping.
D) vertical.
E) horizontal.
The supply schedule indicates that the labor supply curve is
A) backward-bending.
B) upward-sloping.
C) downward-sloping.
D) vertical.
E) horizontal.
Unlock Deck
Unlock for access to all 172 flashcards in this deck.
Unlock Deck
k this deck
68
The following graph represents Zendar's labor market.Use this graph to answer the following questions:
At all wages below ________,there will be ________.
A) $10; a surplus
B) $25; a shortage
C) $40; a surplus
D) $35; no labor supplied
E) $20; no labor demanded
At all wages below ________,there will be ________.
A) $10; a surplus
B) $25; a shortage
C) $40; a surplus
D) $35; no labor supplied
E) $20; no labor demanded
Unlock Deck
Unlock for access to all 172 flashcards in this deck.
Unlock Deck
k this deck
69
After World War II,social norms relating to women's participation in the labor force relaxed and women were more likely to be employed outside the home.We would expect to see the labor supply curve
A) stay the same.
B) shift left.
C) stay the same but move upward.
D) stay the same but move downward.
E) shift right.
A) stay the same.
B) shift left.
C) stay the same but move upward.
D) stay the same but move downward.
E) shift right.
Unlock Deck
Unlock for access to all 172 flashcards in this deck.
Unlock Deck
k this deck
70
The following graph represents Zendar's labor market.Use this graph to answer the following questions:
What is the equilibrium number of workers in Zendar?
A) 20
B) 25
C) 30
D) 35
E) 40
What is the equilibrium number of workers in Zendar?
A) 20
B) 25
C) 30
D) 35
E) 40
Unlock Deck
Unlock for access to all 172 flashcards in this deck.
Unlock Deck
k this deck
71
The following graph represents Zendar's labor market.Use this graph to answer the following questions:
At a wage of ________,________ workers are demanded.
A) $5; 10
B) $10; 35
C) $15; 40
D) $40; 10
E) $45; 45
At a wage of ________,________ workers are demanded.
A) $5; 10
B) $10; 35
C) $15; 40
D) $40; 10
E) $45; 45
Unlock Deck
Unlock for access to all 172 flashcards in this deck.
Unlock Deck
k this deck
72
The labor market is said to be in equilibrium when
A) everyone who wants to work is supplying his or her labor.
B) the number of workers is equal to the number of jobs available at a specific wage.
C) firms are unwilling to hire more workers.
D) workers keep their hours constant.
E) the number of available workers is increasing.
A) everyone who wants to work is supplying his or her labor.
B) the number of workers is equal to the number of jobs available at a specific wage.
C) firms are unwilling to hire more workers.
D) workers keep their hours constant.
E) the number of available workers is increasing.
Unlock Deck
Unlock for access to all 172 flashcards in this deck.
Unlock Deck
k this deck
73
There will be a ________ of workers when the wage is ________ the equilibrium wage.
A) surplus; at
B) surplus; below
C) surplus; above
D) shortage; above
E) shortage; at
A) surplus; at
B) surplus; below
C) surplus; above
D) shortage; above
E) shortage; at
Unlock Deck
Unlock for access to all 172 flashcards in this deck.
Unlock Deck
k this deck
74
The following graph represents Zendar's labor market.Use this graph to answer the following questions:
To have no surplus or shortage of workers in Zendar,what does the wage rate have to be?
A) $5
B) $10
C) $15
D) $20
E) $25
To have no surplus or shortage of workers in Zendar,what does the wage rate have to be?
A) $5
B) $10
C) $15
D) $20
E) $25
Unlock Deck
Unlock for access to all 172 flashcards in this deck.
Unlock Deck
k this deck
75
Use the following table,which shows the supply and demand schedules for workers in the country of Hovian,to answer the following questions:
Wages above ________ will cause a ________.
A) $10; surplus
B) $50; shortage
C) $20; surplus
D) $30; shortage
E) $40; shortage
Wages above ________ will cause a ________.
A) $10; surplus
B) $50; shortage
C) $20; surplus
D) $30; shortage
E) $40; shortage
Unlock Deck
Unlock for access to all 172 flashcards in this deck.
Unlock Deck
k this deck
76
The following graph represents Zendar's labor market.Use this graph to answer the following questions:
At a wage of ________,there is a ________ of ________ workers.
A) $10; surplus; 30
B) $40; shortage; 30
C) $10; shortage; 30
D) $35; shortage; 20
E) $25; surplus; 10
At a wage of ________,there is a ________ of ________ workers.
A) $10; surplus; 30
B) $40; shortage; 30
C) $10; shortage; 30
D) $35; shortage; 20
E) $25; surplus; 10
Unlock Deck
Unlock for access to all 172 flashcards in this deck.
Unlock Deck
k this deck
77
Companies begin to find that customers,when calling customer service,want to talk to real people rather than to a recording.The demand for receptionists will ________ and the market equilibrium wage will ________.
A) fall; fall
B) increase; fall
C) stay the same; rise
D) decrease; rise
E) increase; increase
A) fall; fall
B) increase; fall
C) stay the same; rise
D) decrease; rise
E) increase; increase
Unlock Deck
Unlock for access to all 172 flashcards in this deck.
Unlock Deck
k this deck
78
The labor supply curve is given by the equation LS = 3W + 20 and the labor demand curve is given by the equation LD = 80 - 2W.The equilibrium wage in this labor market is
A) $10.
B) $12.
C) $36.
D) $56.
E) $80.
A) $10.
B) $12.
C) $36.
D) $56.
E) $80.
Unlock Deck
Unlock for access to all 172 flashcards in this deck.
Unlock Deck
k this deck
79
There will be a ________ of workers when the wage is ________ the equilibrium wage.
A) surplus; at
B) shortage; below
C) shortage; above
D) shortage; at
E) surplus; below
A) surplus; at
B) shortage; below
C) shortage; above
D) shortage; at
E) surplus; below
Unlock Deck
Unlock for access to all 172 flashcards in this deck.
Unlock Deck
k this deck
80
In the distant future,companies will be using technology that can replicate food.What will happen to the equilibrium wage and quantity of cooks?
A) The wage will rise and the number of cooks employed will rise.
B) Both will remain unchanged.
C) The wage will stay the same,but many cooks will leave the market.
D) The wage will rise,and the number of cooks employed will fall.
E) The wage and quantity demand will both decrease because firms won't hire as many cooks.
Unlock Deck
Unlock for access to all 172 flashcards in this deck.
Unlock Deck
k this deck
Unlock Deck
Unlock for access to all 172 flashcards in this deck.


