Deck 37: Population Ecology
Full screen (f)
Question
Question
Question
Question
Question
Question
Question
Figuer:
Three population distribution patterns are shown in this figure.
The type of population distribution seen,in inset a,when the habitat is relatively consistent and individuals do not strongly attract or repel one another is _____ distribution.
A) nonselected
B) uniform
C) forced
D) random
E) clumped
Three population distribution patterns are shown in this figure.
The type of population distribution seen,in inset a,when the habitat is relatively consistent and individuals do not strongly attract or repel one another is _____ distribution.
A) nonselected
B) uniform
C) forced
D) random
E) clumped
Question
Question
Figuer:
Three population distribution patterns are shown in this figure.
The type of population distribution seen,in inset c,when only portions of a habitat are the most favorable is
A) nonselected distribution.
B) random distribution.
C) uniform distribution.
D) clumped distribution.
E) forced distribution.
Question
Question
Question
Figuer:
Three population distribution patterns are shown in this figure.
The type of population distribution in inset b is seen when individuals strongly repel one another,or defend distinct territories for resources,is _____ distribution.
A) clumped
B) forced
C) uniform
D) nonselected
E) random
Three population distribution patterns are shown in this figure.
The type of population distribution in inset b is seen when individuals strongly repel one another,or defend distinct territories for resources,is _____ distribution.
A) clumped
B) forced
C) uniform
D) nonselected
E) random
Question
Question
Question
Question
Question
Question
Question
Question
Question
Question
Question
Question
Question
Question
Question
Question
Question
Question
Question
Question
Question
Question
Figuer:
The insets below show the age structures of India, the United States, and China.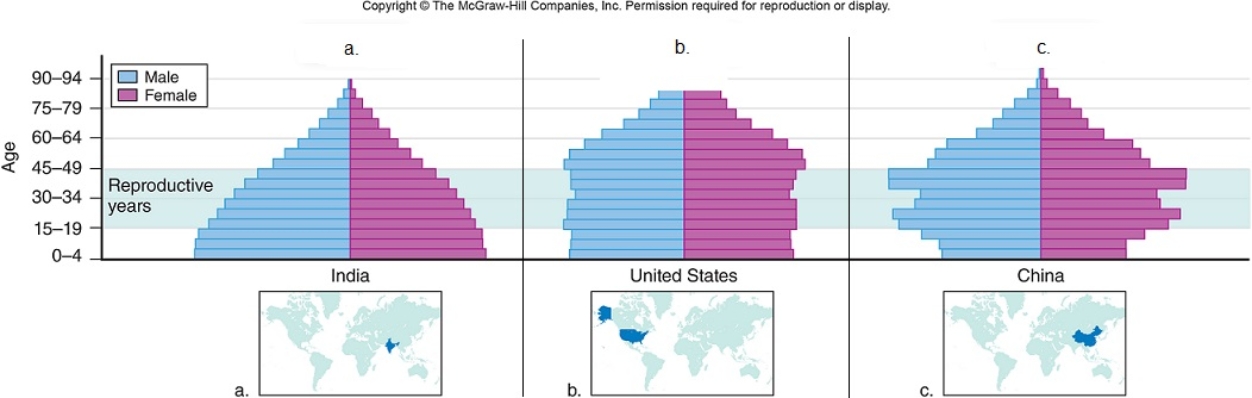
Based upon the population pyramid shown above,you would expect the Indian population to
A) grow and then begin to stabilize.
B) shrink.
C) grow exponentially.
D) stay constant.
The insets below show the age structures of India, the United States, and China.
Based upon the population pyramid shown above,you would expect the Indian population to
A) grow and then begin to stabilize.
B) shrink.
C) grow exponentially.
D) stay constant.
Question
Question
Question
Question
Question
Question
Question
Question
Question
In this graph of yellow-eyed penguins,the data indicate that 
A) Reproductive age of the yellow-eyed penguins is three years.
B) All of the answer choices are correct.
C) Most of the yellow-eyed penguins die in their first year of life.
D) 10% of the yellow-eyed penguins live to eleven years of age.
E) Just less than 30% of the yellow-eyed penguins survive to reproductive age.
Question
Question
Question
Question
Question
Question
Question
Graphed from 10,000 BCE to 2010,as shown below,the global human population 
A) has reached 0% growth rate, as shown by the data plot at 2010.
B) shows the typical curve of logistic growth.
C) is showing clearly that humans are at Earth's carrying capacity for our species.
D) None of the answer choices are correct.
E) shows the typical curve of exponential growth.
A) has reached 0% growth rate, as shown by the data plot at 2010.
B) shows the typical curve of logistic growth.
C) is showing clearly that humans are at Earth's carrying capacity for our species.
D) None of the answer choices are correct.
E) shows the typical curve of exponential growth.
Question
Question
Question
Question
Question
Question
Question
Question
Question
Question
In comparison of the white oak (left)and the cottonwood (right)age structures shown,what conclusion(s)can be drawn? 
A) The next decade will likely result in many white oaks dying off.
B) In the next decade, many white oaks will survive, while many cottonwoods will die.
C) Many white oaks will likely survive the next decade.
D) The next decade will likely result in many cottonwoods dying off.
E) Many cottonwoods will likely survive the next decade.
Question
Question
Question
Question
Question

Unlock Deck
Sign up to unlock the cards in this deck!
Unlock Deck
Unlock Deck
1/65
Play
Full screen (f)
Deck 37: Population Ecology
1
The study of the factors that influence changes in a population's size is
A) population dynamics.
B) population geology.
C) population dispersion.
D) population density.
E) population ethology.
A) population dynamics.
B) population geology.
C) population dispersion.
D) population density.
E) population ethology.
A
2
The brown tree snake in Guam had a ______of about 100 snakes per hectare,which is approximately equal to two American football fields.
A) population density
B) population distribution
C) death rate
D) growth rate
E) population
A) population density
B) population distribution
C) death rate
D) growth rate
E) population
A
3
The difference between a population and a community in the same location is that
A) a population includes all the living organisms, while a community is the physical location in which they live.
B) a population includes members of one species, while a community includes multiple species populations.
C) a community includes members of one species, while a population includes multiple species.
D) a population includes members of one species, while a community includes its nonliving environmental resources.
E) a community is an isolated subpopulation of a larger population of a species.
B
4
In a survivorship curve,a type I species,like a human or elephant,is a species that has
A) a strong possibility of becoming extinct in a relatively short period of time.
B) an extremely short life span.
C) an equal probability of dying at any age.
D) the highest probability of dying as it reaches its maximum life span.
E) the highest probability of dying at a very young age.
A) a strong possibility of becoming extinct in a relatively short period of time.
B) an extremely short life span.
C) an equal probability of dying at any age.
D) the highest probability of dying as it reaches its maximum life span.
E) the highest probability of dying at a very young age.
Unlock Deck
Unlock for access to all 65 flashcards in this deck.
Unlock Deck
k this deck
5
Wildlife biologists use methods which ______ in order to control the brown tree snake population on Guam.
A) anesthetize the snakes with acetominephin in rats
B) release sterilized males to compete with wild fertile males
C) capture and kill the snakes, increasing death rates
D) use specially trained dogs to prevent spread to other islands
E) All of the answer choices are correct.
A) anesthetize the snakes with acetominephin in rats
B) release sterilized males to compete with wild fertile males
C) capture and kill the snakes, increasing death rates
D) use specially trained dogs to prevent spread to other islands
E) All of the answer choices are correct.
Unlock Deck
Unlock for access to all 65 flashcards in this deck.
Unlock Deck
k this deck
6
The physical location in which an organism lives is termed its
A) habitat.
B) home boundary.
C) community.
D) ecosystem.
E) range.
A) habitat.
B) home boundary.
C) community.
D) ecosystem.
E) range.
Unlock Deck
Unlock for access to all 65 flashcards in this deck.
Unlock Deck
k this deck
7
Figuer:
Three population distribution patterns are shown in this figure.
The type of population distribution seen,in inset a,when the habitat is relatively consistent and individuals do not strongly attract or repel one another is _____ distribution.
A) nonselected
B) uniform
C) forced
D) random
E) clumped
Three population distribution patterns are shown in this figure.
The type of population distribution seen,in inset a,when the habitat is relatively consistent and individuals do not strongly attract or repel one another is _____ distribution.
A) nonselected
B) uniform
C) forced
D) random
E) clumped
Unlock Deck
Unlock for access to all 65 flashcards in this deck.
Unlock Deck
k this deck
8
The number of individuals produced per individual per unit time in a population is its _____ rate.
A) immigration
B) expatriation
C) death
D) birth
E) emigration
A) immigration
B) expatriation
C) death
D) birth
E) emigration
Unlock Deck
Unlock for access to all 65 flashcards in this deck.
Unlock Deck
k this deck
9
Figuer:
Three population distribution patterns are shown in this figure.
The type of population distribution seen,in inset c,when only portions of a habitat are the most favorable is
A) nonselected distribution.
B) random distribution.
C) uniform distribution.
D) clumped distribution.
E) forced distribution.
Unlock Deck
Unlock for access to all 65 flashcards in this deck.
Unlock Deck
k this deck
10
The movement of individuals into another population is termed
A) expatriation.
B) emigration.
C) clumping.
D) immigration.
E) population dispersion.
A) expatriation.
B) emigration.
C) clumping.
D) immigration.
E) population dispersion.
Unlock Deck
Unlock for access to all 65 flashcards in this deck.
Unlock Deck
k this deck
11
The study of the relationships among organisms and the environment is
A) habitology.
B) ecology.
C) ergonomics.
D) ethology.
E) geology.
A) habitology.
B) ecology.
C) ergonomics.
D) ethology.
E) geology.
Unlock Deck
Unlock for access to all 65 flashcards in this deck.
Unlock Deck
k this deck
12
Figuer:
Three population distribution patterns are shown in this figure.
The type of population distribution in inset b is seen when individuals strongly repel one another,or defend distinct territories for resources,is _____ distribution.
A) clumped
B) forced
C) uniform
D) nonselected
E) random
Three population distribution patterns are shown in this figure.
The type of population distribution in inset b is seen when individuals strongly repel one another,or defend distinct territories for resources,is _____ distribution.
A) clumped
B) forced
C) uniform
D) nonselected
E) random
Unlock Deck
Unlock for access to all 65 flashcards in this deck.
Unlock Deck
k this deck
13
A group of organisms of one species occupying a geographic location at the same time is a
A) peer group.
B) flock.
C) population.
D) community.
E) herd.
A) peer group.
B) flock.
C) population.
D) community.
E) herd.
Unlock Deck
Unlock for access to all 65 flashcards in this deck.
Unlock Deck
k this deck
14
In a survivorship curve,a type II species,like a song bird,is a species that has
A) the highest probability of dying at a very young age.
B) an equal probability of dying at any age.
C) the highest probability of dying as it reaches its maximum life span.
D) a strong possibility of becoming extinct in a relatively short period of time.
E) an extremely short life span.
A) the highest probability of dying at a very young age.
B) an equal probability of dying at any age.
C) the highest probability of dying as it reaches its maximum life span.
D) a strong possibility of becoming extinct in a relatively short period of time.
E) an extremely short life span.
Unlock Deck
Unlock for access to all 65 flashcards in this deck.
Unlock Deck
k this deck
15
The number of individuals of a species per unit area or volume of habitat is
A) a community.
B) population distribution.
C) population density.
D) carrying capacity.
E) population dynamics.
A) a community.
B) population distribution.
C) population density.
D) carrying capacity.
E) population dynamics.
Unlock Deck
Unlock for access to all 65 flashcards in this deck.
Unlock Deck
k this deck
16
The number of individuals that die in a population per unit time is its _____ rate.
A) birth
B) expatriation
C) emigration
D) immigration
E) death
A) birth
B) expatriation
C) emigration
D) immigration
E) death
Unlock Deck
Unlock for access to all 65 flashcards in this deck.
Unlock Deck
k this deck
17
Emigration happens when individuals move ___ a population,while immigration happens when individuals move ___ a population.
A) by extrapolation towards; by dispersion from
B) into; out of
C) due to environmental resistance within; due to carrying capacity within
D) out of; into
E) by dispersion through; by extrapolation at the periphery of
A) by extrapolation towards; by dispersion from
B) into; out of
C) due to environmental resistance within; due to carrying capacity within
D) out of; into
E) by dispersion through; by extrapolation at the periphery of
Unlock Deck
Unlock for access to all 65 flashcards in this deck.
Unlock Deck
k this deck
18
In a survivorship curve,a type III species,like most insects and plants,is a species that has
A) an extremely long life span.
B) an equal probability of dying at any age.
C) the highest probability of dying at a very young age.
D) a strong possibility of becoming extinct in a relatively short period of time.
E) the highest probability of dying as it reaches its maximum life span.
A) an extremely long life span.
B) an equal probability of dying at any age.
C) the highest probability of dying at a very young age.
D) a strong possibility of becoming extinct in a relatively short period of time.
E) the highest probability of dying as it reaches its maximum life span.
Unlock Deck
Unlock for access to all 65 flashcards in this deck.
Unlock Deck
k this deck
19
In a population,the difference between the birth rate and the death rate is termed the
A) population density determining factor.
B) J-shaped population curve.
C) population dispersion factor.
D) S-shaped population curve.
E) per capita rate of increase.
A) population density determining factor.
B) J-shaped population curve.
C) population dispersion factor.
D) S-shaped population curve.
E) per capita rate of increase.
Unlock Deck
Unlock for access to all 65 flashcards in this deck.
Unlock Deck
k this deck
20
As a likely result of migrations on war vessels in World War II,a new predator was discovered,in the 1960s,on the island of _____,decimating local populations of birds and small reptiles.
A) Guam
B) Puerto Rico
C) Madagascar
D) Ceylon
E) Cuba
A) Guam
B) Puerto Rico
C) Madagascar
D) Ceylon
E) Cuba
Unlock Deck
Unlock for access to all 65 flashcards in this deck.
Unlock Deck
k this deck
21
Species with an opportunistic,or r-selected,life history strategy
A) provide extensive care for their offspring.
B) produce many offspring.
C) are long-lived.
D) reproduce later in life.
E) are limited primarily by carrying capacity.
A) provide extensive care for their offspring.
B) produce many offspring.
C) are long-lived.
D) reproduce later in life.
E) are limited primarily by carrying capacity.
Unlock Deck
Unlock for access to all 65 flashcards in this deck.
Unlock Deck
k this deck
22
A population with a large fraction of pre-reproductive individuals is common in _____-developed countries; this population will most likely _____ in size.
A) more; decrease
B) more; increase
C) less; decrease
D) less; increase
A) more; decrease
B) more; increase
C) less; decrease
D) less; increase
Unlock Deck
Unlock for access to all 65 flashcards in this deck.
Unlock Deck
k this deck
23
In 2010 India had a population of 1,170,000,000,a birth rate of 0.027,and a death rate of 0.013.What was the per capita rate of India's population?
A) 0.027
B) 0.013
C) 0.040
D) 0.014
E) 0.001
A) 0.027
B) 0.013
C) 0.040
D) 0.014
E) 0.001
Unlock Deck
Unlock for access to all 65 flashcards in this deck.
Unlock Deck
k this deck
24
Two countries,_____ and _____,alone account for one-third of the human population.
A) Russia; India
B) India; Brazil
C) China; Russia
D) China; India
E) Russia; Brazil
A) Russia; India
B) India; Brazil
C) China; Russia
D) China; India
E) Russia; Brazil
Unlock Deck
Unlock for access to all 65 flashcards in this deck.
Unlock Deck
k this deck
25
In the population growth curve equation G = rN(K - N)/K,when N is very small relative to K,the population
A) growth rate is low.
B) crashes.
C) growth rate is high.
D) growth rate stabilizes.
E) None of the answer choices are correct.
A) growth rate is low.
B) crashes.
C) growth rate is high.
D) growth rate stabilizes.
E) None of the answer choices are correct.
Unlock Deck
Unlock for access to all 65 flashcards in this deck.
Unlock Deck
k this deck
26
Predation of deer by wolves is an example of a
A) density-dependent limit.
B) death-independent factor.
C) density-codependent limit.
D) death-dependent factor.
E) density-independent limit.
A) density-dependent limit.
B) death-independent factor.
C) density-codependent limit.
D) death-dependent factor.
E) density-independent limit.
Unlock Deck
Unlock for access to all 65 flashcards in this deck.
Unlock Deck
k this deck
27
An example of a density-independent factor that affects a population's growth is
A) frost killing all of your tomato plants.
B) your tomato plants competing for water.
C) All of the answer choices are correct.
D) a fungus infecting your tomato plants.
E) insects eating your tomato plants.
A) frost killing all of your tomato plants.
B) your tomato plants competing for water.
C) All of the answer choices are correct.
D) a fungus infecting your tomato plants.
E) insects eating your tomato plants.
Unlock Deck
Unlock for access to all 65 flashcards in this deck.
Unlock Deck
k this deck
28
How would the population equation G = rN be expressed in the full names of each abbreviated variable?
A) logistic growth rate = per capita rate of increase x carrying capacity
B) number of individuals added per unit time = per capita rate of increase x initial population size
C) carrying capacity = environmental resistance x exponential growth rate
D) rate of emigration = birth rate x initial population size
E) None of the answer choices are correct.
Unlock Deck
Unlock for access to all 65 flashcards in this deck.
Unlock Deck
k this deck
29
In a population growth curve that is affected by environmental resistance,the formula G = rN(K - N)/K is used to calculate the number of new individuals added after each time interval.In this equation K represents the
A) number of individuals added per unit time.
B) per capita rate of increase.
C) environmental resistance.
D) number of individuals at the start of a time interval.
E) carrying capacity for the organism being studied.
A) number of individuals added per unit time.
B) per capita rate of increase.
C) environmental resistance.
D) number of individuals at the start of a time interval.
E) carrying capacity for the organism being studied.
Unlock Deck
Unlock for access to all 65 flashcards in this deck.
Unlock Deck
k this deck
30
The maximum number of individuals that a habitat can support indefinitely is the habitat's
A) dispersion capacity.
B) carrying capacity.
C) density dispersion.
D) growth capacity.
E) environmental load.
A) dispersion capacity.
B) carrying capacity.
C) density dispersion.
D) growth capacity.
E) environmental load.
Unlock Deck
Unlock for access to all 65 flashcards in this deck.
Unlock Deck
k this deck
31
Which of the following best describes the link between population-limiting factors and K-selected species?
A) K-selected species are limited by density-dependent factors and have many offspring.
B) K-selected species are limited by density-independent factors and have many offspring.
C) K-selected species are limited by density-dependent factors and have few offspring.
D) K-selected species are limited by density-independent factors and have few offspring.
Unlock Deck
Unlock for access to all 65 flashcards in this deck.
Unlock Deck
k this deck
32
If a deer herd has a population of 1000,a carrying capacity of 2000,and an intrinsic rate of growth of 10% (0.1),what must be true of this deer population?
A) births > deaths
B) births < deaths
C) None of the answer choices are correct.
D) births = deaths
A) births > deaths
B) births < deaths
C) None of the answer choices are correct.
D) births = deaths
Unlock Deck
Unlock for access to all 65 flashcards in this deck.
Unlock Deck
k this deck
33
If a deer herd has a population of N = 1000,and a per capita rate of increase of 10% (r = 0.1 per year),how much will the deer population grow in a year,if resources are unlimited?
A) 50
B) 500
C) 1000
D) 100
E) 10
A) 50
B) 500
C) 1000
D) 100
E) 10
Unlock Deck
Unlock for access to all 65 flashcards in this deck.
Unlock Deck
k this deck
34
Figuer:
The insets below show the age structures of India, the United States, and China.
Based upon the population pyramid shown above,you would expect the Indian population to
A) grow and then begin to stabilize.
B) shrink.
C) grow exponentially.
D) stay constant.
The insets below show the age structures of India, the United States, and China.
Based upon the population pyramid shown above,you would expect the Indian population to
A) grow and then begin to stabilize.
B) shrink.
C) grow exponentially.
D) stay constant.
Unlock Deck
Unlock for access to all 65 flashcards in this deck.
Unlock Deck
k this deck
35
A population with a large fraction of post-reproductive individuals is common in _____-developed countries; this population will most likely _____ in size.
A) less; increase
B) less; decrease
C) more; increase
D) more; decrease
A) less; increase
B) less; decrease
C) more; increase
D) more; decrease
Unlock Deck
Unlock for access to all 65 flashcards in this deck.
Unlock Deck
k this deck
36
In 2010 India had a population of 1,170,000,000,a birth rate of 0.027,and a death rate of 0.013.Approximately how much did the Indian population grow in 2010?
A) 17,000,000
B) 17,000
C) 170,000,000
D) 170,000
E) 1,700,000
A) 17,000,000
B) 17,000
C) 170,000,000
D) 170,000
E) 1,700,000
Unlock Deck
Unlock for access to all 65 flashcards in this deck.
Unlock Deck
k this deck
37
The combination of external factors that keep a population from reaching its maximum growth rate is
A) population aging.
B) environmental augmentation.
C) population clumping.
D) environmental resistance.
E) environmental assuagement.
A) population aging.
B) environmental augmentation.
C) population clumping.
D) environmental resistance.
E) environmental assuagement.
Unlock Deck
Unlock for access to all 65 flashcards in this deck.
Unlock Deck
k this deck
38
Species with an equilibrium,or K-selected,life history strategy
A) are short-lived.
B) have a large number of offspring.
C) give very little care to their offspring.
D) reproduce at an early age.
E) have only a few offspring.
A) are short-lived.
B) have a large number of offspring.
C) give very little care to their offspring.
D) reproduce at an early age.
E) have only a few offspring.
Unlock Deck
Unlock for access to all 65 flashcards in this deck.
Unlock Deck
k this deck
39
A population age structure diagram showing roughly equal numbers in each age group,such as shown above in inset b for the United States,depicts a
A) declining population.
B) stable population.
C) very small population size.
D) population facing extinction.
E) growing population.
A) declining population.
B) stable population.
C) very small population size.
D) population facing extinction.
E) growing population.
Unlock Deck
Unlock for access to all 65 flashcards in this deck.
Unlock Deck
k this deck
40
An ecologist catches 100 frogs from a pond,marks them,and releases them back into the pond.After a few days,another 100 frogs are captured and 10 have the marks on them.How many frogs are in the pond?
A) 100
B) 900
C) 10,000
D) 90
E) 1000
A) 100
B) 900
C) 10,000
D) 90
E) 1000
Unlock Deck
Unlock for access to all 65 flashcards in this deck.
Unlock Deck
k this deck
41
Which of the following best describes the link between population-limiting factors and r-selected species?
A) Opportunistic species are limited by density-independent factors and have few offspring.
B) Opportunistic species are limited by density-independent factors and have many offspring.
C) Opportunistic species are limited by density-dependent factors and have many offspring.
D) Opportunistic species are limited by density-dependent factors and have few offspring.
Unlock Deck
Unlock for access to all 65 flashcards in this deck.
Unlock Deck
k this deck
42
Why are the leading causes of death in high-income countries heart disease,stroke,and cancer,while in low-income countries infectious diseases are the leading causes of death?
A) The population density in high-income countries is clustered.
B) The population density in high-income countries is larger.
C) Access to sanitation, vaccines, and antibiotics is greater in high-income countries.
D) The ecological footprint in high-income countries is larger.
E) There are genetic differences between populations.
Unlock Deck
Unlock for access to all 65 flashcards in this deck.
Unlock Deck
k this deck
43
In this graph of yellow-eyed penguins,the data indicate that
A) Reproductive age of the yellow-eyed penguins is three years.
B) All of the answer choices are correct.
C) Most of the yellow-eyed penguins die in their first year of life.
D) 10% of the yellow-eyed penguins live to eleven years of age.
E) Just less than 30% of the yellow-eyed penguins survive to reproductive age.
Unlock Deck
Unlock for access to all 65 flashcards in this deck.
Unlock Deck
k this deck
44
Emigration is the migration out of a particular area.
Unlock Deck
Unlock for access to all 65 flashcards in this deck.
Unlock Deck
k this deck
45
When exponential growth is plotted over time,an S-shaped curve emerges.
Unlock Deck
Unlock for access to all 65 flashcards in this deck.
Unlock Deck
k this deck
46
For a lady bug population at the beginning of summer,the food supply and habitat are almost limitless.If there are 1000 lady bugs in a one-acre field,the per capita rate of increase is 25%,and no immigration or emigration occurs,how many individuals will be added in the next generation? Discern whether G = rN(K - N)/K or G = rN applies appropriately.
A) 125
B) 0
C) 1250
D) 1000
E) 250
A) 125
B) 0
C) 1250
D) 1000
E) 250
Unlock Deck
Unlock for access to all 65 flashcards in this deck.
Unlock Deck
k this deck
47
Atlantic mollies of the species Poecilia mexicana live in habitats that make multiple collection trips difficult,yet they live in populations of many small individuals.What variable was measured to estimate and compare their life histories among different conditions?
A) ages of the collected male and female Atlantic mollies
B) embryo number
C) embryo number and embryo biomass
D) numbers and sizes of the collected male and female Atlantic mollies
E) embryo biomass
A) ages of the collected male and female Atlantic mollies
B) embryo number
C) embryo number and embryo biomass
D) numbers and sizes of the collected male and female Atlantic mollies
E) embryo biomass
Unlock Deck
Unlock for access to all 65 flashcards in this deck.
Unlock Deck
k this deck
48
Atlantic mollies of the species Poecilia mexicana are found in the habitat(s)of
A) isolated desert pools left from hurricane storm surges.
B) estuaries where saltwater and freshwater mix.
C) All of the answer choices are correct.
D) coastal tidal pools and coral reefs.
E) streams and cave waters with clean water and H2S poisonous molecules.
A) isolated desert pools left from hurricane storm surges.
B) estuaries where saltwater and freshwater mix.
C) All of the answer choices are correct.
D) coastal tidal pools and coral reefs.
E) streams and cave waters with clean water and H2S poisonous molecules.
Unlock Deck
Unlock for access to all 65 flashcards in this deck.
Unlock Deck
k this deck
49
A J-shaped population growth curve indicates that
A) the population size is approaching the carrying capacity for its resources.
B) resources for the population are unlimited.
C) the population is experiencing exponential growth.
D) the population is experiencing logistic growth.
E) the population has both unlimited resources and is experiencing exponential growth.
Unlock Deck
Unlock for access to all 65 flashcards in this deck.
Unlock Deck
k this deck
50
Graphed from 10,000 BCE to 2010,as shown below,the global human population
A) has reached 0% growth rate, as shown by the data plot at 2010.
B) shows the typical curve of logistic growth.
C) is showing clearly that humans are at Earth's carrying capacity for our species.
D) None of the answer choices are correct.
E) shows the typical curve of exponential growth.
A) has reached 0% growth rate, as shown by the data plot at 2010.
B) shows the typical curve of logistic growth.
C) is showing clearly that humans are at Earth's carrying capacity for our species.
D) None of the answer choices are correct.
E) shows the typical curve of exponential growth.
Unlock Deck
Unlock for access to all 65 flashcards in this deck.
Unlock Deck
k this deck
51
How is the adaptation of investing more energy in producing large offspring beneficial in the Atlantic mollies?
A) Larger-sized offspring can migrate more easily among the stressful and non-stressful environments.
B) All of the answer choices are correct.
C) Larger-sized offspring can more quickly mature to reproductive age.
D) Larger-sized offspring increases swimming ability for accessing food in toxic or dark conditions.
E) Larger-sized offspring allow greater ability to avoid predation by other species.
Unlock Deck
Unlock for access to all 65 flashcards in this deck.
Unlock Deck
k this deck
52
A country's ecological footprint can be calculated by multiplying its population size by the footprint of each individual.Why are some ecologists concerned about the ecological footprint of a country like India?
A) Its standard of living is increasing.
B) Its population and land area are increasing.
C) Its population is increasing.
D) Its standard of living and land area are increasing.
E) Both its population and standard of living are increasing.
A) Its standard of living is increasing.
B) Its population and land area are increasing.
C) Its population is increasing.
D) Its standard of living and land area are increasing.
E) Both its population and standard of living are increasing.
Unlock Deck
Unlock for access to all 65 flashcards in this deck.
Unlock Deck
k this deck
53
What key conclusion did Riesch and Schlupp draw from the life history data of the Atlantic mollies?
A) The populations are only able to survive and reproduce when in stressful environments of either darkness or H2S.
B) More energy is invested in producing many more offspring when the populations live in environmentally stressful habitats.
C) The populations exposed to H2S are able to use the toxic molecule for metabolic energy.
D) Genetic regulation in the species result in production of equal sizes of offspring whether exposed to stressful environments or not.
E) More energy is invested in producing larger offspring when the populations live in environmentally stressful habitats.
Unlock Deck
Unlock for access to all 65 flashcards in this deck.
Unlock Deck
k this deck
54
Immigration is the migration out of a particular area.
Unlock Deck
Unlock for access to all 65 flashcards in this deck.
Unlock Deck
k this deck
55
On the island of Guam,a single type of nonnative organism,the black-footed ferret,is responsible for the disappearance of at least 12 species of birds and small reptiles from the island.
Unlock Deck
Unlock for access to all 65 flashcards in this deck.
Unlock Deck
k this deck
56
Why have growth rates increased the most in developing countries in the past 50 years?
A) Death rates have fallen slower than birth rates.
B) Death rates have gone up faster than birth rates.
C) Death rates have fallen faster than birth rates.
D) Death rates have gone up slower than birth rates.
A) Death rates have fallen slower than birth rates.
B) Death rates have gone up faster than birth rates.
C) Death rates have fallen faster than birth rates.
D) Death rates have gone up slower than birth rates.
Unlock Deck
Unlock for access to all 65 flashcards in this deck.
Unlock Deck
k this deck
57
Conservation biologists are often trying to protect or create habitat for endangered species.How would this directly affect the equation G = rN(K - N)/K for an endangered animal?
A) It would raise r.
B) It would lower N.
C) It would lower K.
D) It would raise N.
E) It would raise K.
A) It would raise r.
B) It would lower N.
C) It would lower K.
D) It would raise N.
E) It would raise K.
Unlock Deck
Unlock for access to all 65 flashcards in this deck.
Unlock Deck
k this deck
58
For a lady bug population at the end of summer,the food supply decreases to where only 2000 lady bugs can be supported per acre.If there are 1000 lady bugs in a one-acre field,the per capita rate of increase is 25%,and no immigration or emigration occur,how many individuals will be added in the next generation? Interpret whether G = rN(K - N)/K or G = rN is appropriate.
A) 250
B) 125
C) 1000
D) 1250
E) 0
A) 250
B) 125
C) 1000
D) 1250
E) 0
Unlock Deck
Unlock for access to all 65 flashcards in this deck.
Unlock Deck
k this deck
59
Researchers studying guppies in Trinidad found that guppies in streams with high predation reproduced earlier and more frequently.How would the scientists describe the selective force acting on the guppy population?
A) density-dependent factors
B) K-selection
C) density-independent factors
D) r-selection
E) sexual selection
A) density-dependent factors
B) K-selection
C) density-independent factors
D) r-selection
E) sexual selection
Unlock Deck
Unlock for access to all 65 flashcards in this deck.
Unlock Deck
k this deck
60
In comparison of the white oak (left)and the cottonwood (right)age structures shown,what conclusion(s)can be drawn?
A) The next decade will likely result in many white oaks dying off.
B) In the next decade, many white oaks will survive, while many cottonwoods will die.
C) Many white oaks will likely survive the next decade.
D) The next decade will likely result in many cottonwoods dying off.
E) Many cottonwoods will likely survive the next decade.
Unlock Deck
Unlock for access to all 65 flashcards in this deck.
Unlock Deck
k this deck
61
The United Nations issued a highest projection of the global human population in 2100 to be 15.8 billion people.
Unlock Deck
Unlock for access to all 65 flashcards in this deck.
Unlock Deck
k this deck
62
Conditions whose growth-limiting effects increase as a population grows are density-independent factors.
Unlock Deck
Unlock for access to all 65 flashcards in this deck.
Unlock Deck
k this deck
63
The government of China offers financial incentives to encourage citizens to have children.
Unlock Deck
Unlock for access to all 65 flashcards in this deck.
Unlock Deck
k this deck
64
When logistic growth is plotted over time,a J-shaped curve emerges.
Unlock Deck
Unlock for access to all 65 flashcards in this deck.
Unlock Deck
k this deck
65
The maximum number of individuals of a population that a habitat can support indefinitely is its carrying capacity.
Unlock Deck
Unlock for access to all 65 flashcards in this deck.
Unlock Deck
k this deck
Unlock Deck
Unlock for access to all 65 flashcards in this deck.


