Deck 21: Business Statistics and Data Presentation
Full screen (f)
Question
Question
Question
Question
Question
Question
Question
Question
Use this pie chart to determine the percent of households which do not own their home. 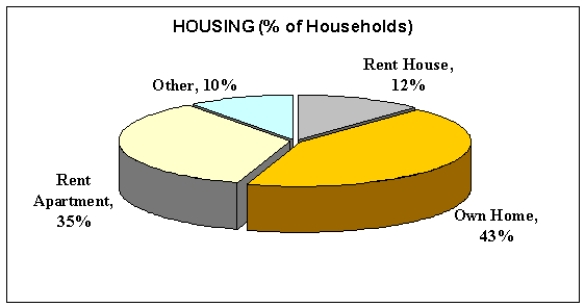
A) 43%
B) 22%
C) 57%
D) 45%
A) 43%
B) 22%
C) 57%
D) 45%
Question
Question
Use this component bar chart to find the day which had the highest ticket total. 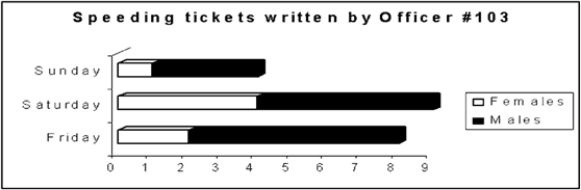
A) Friday
B) Saturday
C) Sunday
A) Friday
B) Saturday
C) Sunday
Question
Use this comparative bar chart to find the month which had the lowest total number of outages during both years. 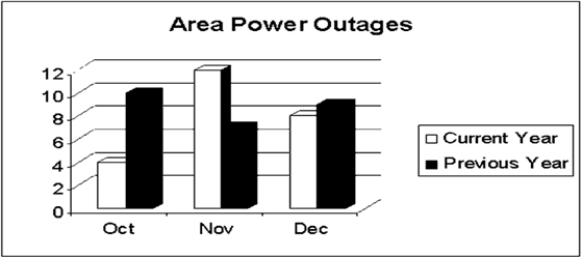
A) October
B) November
C) December
A) October
B) November
C) December
Question
Given this multiple line chart, find the total number of chairs and sofas sold during January. (All numbers plotted to nearest 10 units) 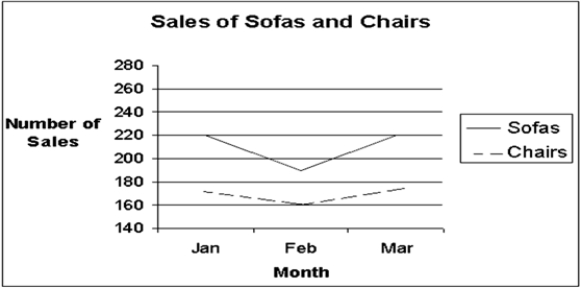
A) 390
B) 440
C) 1,130
D) 560
A) 390
B) 440
C) 1,130
D) 560
Question
Question
Given this multiple line chart, find the total number of cars recalled during these years. (All numbers plotted to nearest 5 units) 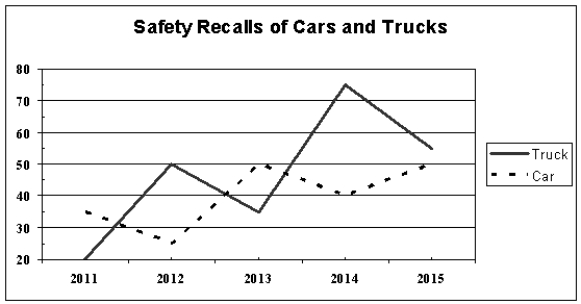
A) 150
B) 85
C) 345
D) 200
A) 150
B) 85
C) 345
D) 200
Question
Question
Question
Question
Question
Question
Question
Question
Question
Question
Question
Question
Question
Question
Question
Question
Question
Question
Question
Question
Question
Question
Question
Question
Question
Question
Question
Question
Question
Given this histogram, find the number of workers who produced 60−64 units. (All frequencies graphed to nearest 5) 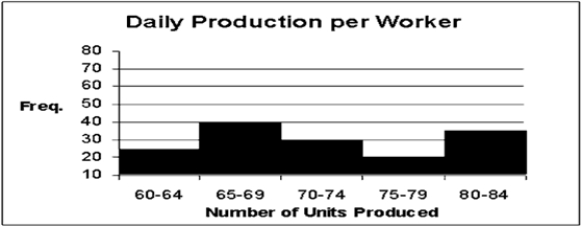
A) 20
B) 25
C) 40
D) 35
A) 20
B) 25
C) 40
D) 35
Question
Question
Question
Question
Question
Question
Question
Question
Question
Question
Question
Question
Question
Given this histogram, find the class which has the smallest frequency. (All frequencies graphed to nearest 5) 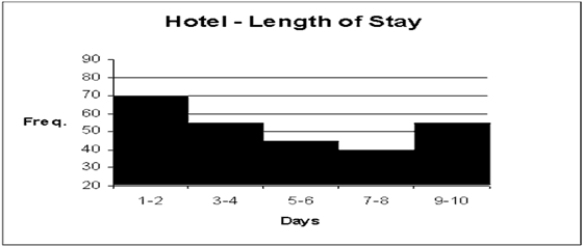
A) 5−6
B) 7−8
C) 1−2
D) 9−10
A) 5−6
B) 7−8
C) 1−2
D) 9−10
Question
Question
Question
Question
Question
The table below shows students at City College of New York. 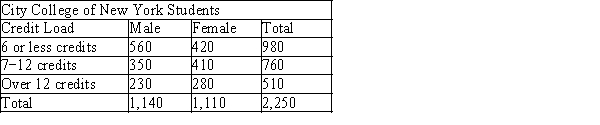
A)What percentage of female students are taking over 12 credits? (Round to the nearest tenth of a percent)
B)What percentage of students taking 6 or less credits are female? (Round to the nearest tenth of a percent)
A)What percentage of female students are taking over 12 credits? (Round to the nearest tenth of a percent)
B)What percentage of students taking 6 or less credits are female? (Round to the nearest tenth of a percent)
Question
Question
Question
Question
Question
The table below shows students at Eagle Mountain College. 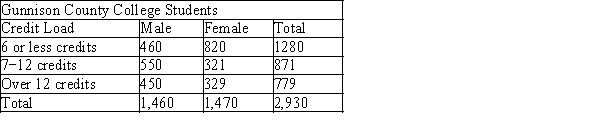
A)What percentage of male students are taking 6 or less credits? (Round to the nearest tenth of a percent)
B)What percentage of students taking 7−12 credits are female? (Round to the nearest tenth of a percent)
A)What percentage of male students are taking 6 or less credits? (Round to the nearest tenth of a percent)
B)What percentage of students taking 7−12 credits are female? (Round to the nearest tenth of a percent)
Question
Question
Question
Question
Question
Question
Question
Question
Question
Question
Question
Question
Question
Question

Unlock Deck
Sign up to unlock the cards in this deck!
Unlock Deck
Unlock Deck
1/125
Play
Full screen (f)
Deck 21: Business Statistics and Data Presentation
1
Statistical ____________________ is the process of arriving at conclusions, predictions, forecasts, or estimates based on the data under study.
inference
2
Business ____________________ is the systematic process of collecting, interpreting, and presenting numerical data about business situations.
statistics
3
____________________ use lines to show data changing over a period of time.
Line charts
4
The ____________________ is the vertical axis of a chart, usually used to measure the quantity or magnitude of something.
Unlock Deck
Unlock for access to all 125 flashcards in this deck.
Unlock Deck
k this deck
5
Compute the arithmetic mean of the following numbers: 23, 26, 47, 43, 14 (Round your answer to one decimal place)
A) 14.0
B) 34.2
C) 30.6
D) 21.8
A) 14.0
B) 34.2
C) 30.6
D) 21.8
Unlock Deck
Unlock for access to all 125 flashcards in this deck.
Unlock Deck
k this deck
6
The median of a set of numbers is the ____________________ value when the numbers are ranked in ascending or descending order.
Unlock Deck
Unlock for access to all 125 flashcards in this deck.
Unlock Deck
k this deck
7
Compute the arithmetic mean of the following numbers: 86, 46, 58, 75, 44, 18, 28, 53 (Round your answer to two decimal places)
A) 51.00
B) 42.50
C) 53.87
D) 41.00
A) 51.00
B) 42.50
C) 53.87
D) 41.00
Unlock Deck
Unlock for access to all 125 flashcards in this deck.
Unlock Deck
k this deck
8
Use this pie chart to determine the percent of households which do not own their home.
A) 43%
B) 22%
C) 57%
D) 45%
A) 43%
B) 22%
C) 57%
D) 45%
Unlock Deck
Unlock for access to all 125 flashcards in this deck.
Unlock Deck
k this deck
9
____________________ are a collection of related data arranged for ease of reference or comparison.
Unlock Deck
Unlock for access to all 125 flashcards in this deck.
Unlock Deck
k this deck
10
Use this component bar chart to find the day which had the highest ticket total.
A) Friday
B) Saturday
C) Sunday
A) Friday
B) Saturday
C) Sunday
Unlock Deck
Unlock for access to all 125 flashcards in this deck.
Unlock Deck
k this deck
11
Use this comparative bar chart to find the month which had the lowest total number of outages during both years.
A) October
B) November
C) December
A) October
B) November
C) December
Unlock Deck
Unlock for access to all 125 flashcards in this deck.
Unlock Deck
k this deck
12
Given this multiple line chart, find the total number of chairs and sofas sold during January. (All numbers plotted to nearest 10 units)
A) 390
B) 440
C) 1,130
D) 560
A) 390
B) 440
C) 1,130
D) 560
Unlock Deck
Unlock for access to all 125 flashcards in this deck.
Unlock Deck
k this deck
13
What were the total sales of the Deluxe model?
A) $557,400
B) $429,600
C) $357,200
D) $470,300
A) $557,400
B) $429,600
C) $357,200
D) $470,300
Unlock Deck
Unlock for access to all 125 flashcards in this deck.
Unlock Deck
k this deck
14
Given this multiple line chart, find the total number of cars recalled during these years. (All numbers plotted to nearest 5 units)
A) 150
B) 85
C) 345
D) 200
A) 150
B) 85
C) 345
D) 200
Unlock Deck
Unlock for access to all 125 flashcards in this deck.
Unlock Deck
k this deck
15
A(n) ____________________ is a special type of bar chart that is used in business to display the data from a frequency distribution.
Unlock Deck
Unlock for access to all 125 flashcards in this deck.
Unlock Deck
k this deck
16
____________________ represent quantities or percentages by the length of horizontal or vertical bars.
Unlock Deck
Unlock for access to all 125 flashcards in this deck.
Unlock Deck
k this deck
17
How many sales calls were made in the all the regions in November?
A) 993
B) 353
C) 299
D) 341
A) 993
B) 353
C) 299
D) 341
Unlock Deck
Unlock for access to all 125 flashcards in this deck.
Unlock Deck
k this deck
18
The ____________________ is a circle divided into sections representing the component parts of a whole.
Unlock Deck
Unlock for access to all 125 flashcards in this deck.
Unlock Deck
k this deck
19
The ____________________ is the difference between the lowest and highest values in a data set.
Unlock Deck
Unlock for access to all 125 flashcards in this deck.
Unlock Deck
k this deck
20
____________________ are often referred to as measures of central tendency.
Unlock Deck
Unlock for access to all 125 flashcards in this deck.
Unlock Deck
k this deck
21
Find the median of the following numbers: 92.5, 65.25, 47.75, 31.25, 39.5, 21.5, 89
A) 62.55
B) 59.35
C) 54.50
D) 47.75
A) 62.55
B) 59.35
C) 54.50
D) 47.75
Unlock Deck
Unlock for access to all 125 flashcards in this deck.
Unlock Deck
k this deck
22
Compute the arithmetic mean of the following numbers: 181, 221, 748, 458, 439, 799, 395 (Round to two decimal places)
A) 463.00
B) 540.17
C) 648.20
D) 405.13
A) 463.00
B) 540.17
C) 648.20
D) 405.13
Unlock Deck
Unlock for access to all 125 flashcards in this deck.
Unlock Deck
k this deck
23
Compute the arithmetic mean of the following numbers: 18, 66, 79, 92, 59, 99, 56 (Round your answer to two decimal places)
A) 53.86
B) 66.00
C) 67.00
D) 52.86
A) 53.86
B) 66.00
C) 67.00
D) 52.86
Unlock Deck
Unlock for access to all 125 flashcards in this deck.
Unlock Deck
k this deck
24
Find the median of the following numbers: 17, 89, 89, 85, 11, 94, 55
A) 62.9
B) 85.0
C) 89.0
D) 76.3
A) 62.9
B) 85.0
C) 89.0
D) 76.3
Unlock Deck
Unlock for access to all 125 flashcards in this deck.
Unlock Deck
k this deck
25
Find the mode(s), if any, of the following numbers: 22, 54, 22, 36, 17, 22, 17, 18
A) 22
B) 22 & 17
C) 17
D) none
A) 22
B) 22 & 17
C) 17
D) none
Unlock Deck
Unlock for access to all 125 flashcards in this deck.
Unlock Deck
k this deck
26
Find the mode(s), if any, of the following numbers: 602, 322, 376, 602, 376, 730, 777, 777, 602, 322, 730, 777
A) 602, 777
B) 322, 602
C) 602, 730
D) 376, 777
A) 602, 777
B) 322, 602
C) 602, 730
D) 376, 777
Unlock Deck
Unlock for access to all 125 flashcards in this deck.
Unlock Deck
k this deck
27
Find the mode(s), if any, of the following numbers: 274, 320, 350, 789, 688, 789, 350
A) 789 & 350
B) 425
C) 350
D) 789
A) 789 & 350
B) 425
C) 350
D) 789
Unlock Deck
Unlock for access to all 125 flashcards in this deck.
Unlock Deck
k this deck
28
Find the median of the following numbers: 12, 49, 64, 46, 67, 71
A) 49
B) 56.5
C) 64
D) 67
A) 49
B) 56.5
C) 64
D) 67
Unlock Deck
Unlock for access to all 125 flashcards in this deck.
Unlock Deck
k this deck
29
Find the mode(s), if any, of the following numbers: 61, 12, 33, 96, 68, 12, 61, 12
A) 61
B) 12
C) 33
D) 68
A) 61
B) 12
C) 33
D) 68
Unlock Deck
Unlock for access to all 125 flashcards in this deck.
Unlock Deck
k this deck
30
Find the median of the following numbers: 458, 791, 344, 370, 641, 194, 974
A) 65.4
B) 505.5
C) 538.9
D) 458.0
A) 65.4
B) 505.5
C) 538.9
D) 458.0
Unlock Deck
Unlock for access to all 125 flashcards in this deck.
Unlock Deck
k this deck
31
Find the median of the following numbers: 68, 99, 63, 25, 98, 51
A) 67.3
B) 65.5
C) 68.0
D) 202.0
A) 67.3
B) 65.5
C) 68.0
D) 202.0
Unlock Deck
Unlock for access to all 125 flashcards in this deck.
Unlock Deck
k this deck
32
Find the range of the following numbers: 314, 431, 773, 768, 744, 466
A) 459
B) 314 & 773
C) 590
D) 583
A) 459
B) 314 & 773
C) 590
D) 583
Unlock Deck
Unlock for access to all 125 flashcards in this deck.
Unlock Deck
k this deck
33
Find the mode(s), if any, of the following numbers: 56, 56, 92, 16, 87, 28, 87, 16
A) 56 & 87
B) 56 & 16
C) 16 & 87
D) 16, 56, & 87
A) 56 & 87
B) 56 & 16
C) 16 & 87
D) 16, 56, & 87
Unlock Deck
Unlock for access to all 125 flashcards in this deck.
Unlock Deck
k this deck
34
Find the mode(s), if any, of the following numbers: 379, 650, 650, 109, 688, 469, 650
A) 109
B) 650
C) 514
D) 688
A) 109
B) 650
C) 514
D) 688
Unlock Deck
Unlock for access to all 125 flashcards in this deck.
Unlock Deck
k this deck
35
Find the range of the following numbers: 59, 81, 25, 20, 44, 32, 91, 58
A) 20 & 91
B) 51.3
C) 51
D) 71
A) 20 & 91
B) 51.3
C) 51
D) 71
Unlock Deck
Unlock for access to all 125 flashcards in this deck.
Unlock Deck
k this deck
36
Find the range of the following numbers: 204, 232, 874, 168, 244, 366
A) 670
B) 212
C) 706
D) 183
A) 670
B) 212
C) 706
D) 183
Unlock Deck
Unlock for access to all 125 flashcards in this deck.
Unlock Deck
k this deck
37
Compute the arithmetic mean of the following numbers: 44, 66, 67, 23, 24 (Round your answer to one decimal place)
A) 44.0
B) 44.8
C) 40.0
D) 31.4
A) 44.0
B) 44.8
C) 40.0
D) 31.4
Unlock Deck
Unlock for access to all 125 flashcards in this deck.
Unlock Deck
k this deck
38
Find the mode(s), if any, of the following numbers: 964, 588, 439, 964, 686, 299, 299, 964, 588
A) 299
B) 588
C) 964
D) 686
A) 299
B) 588
C) 964
D) 686
Unlock Deck
Unlock for access to all 125 flashcards in this deck.
Unlock Deck
k this deck
39
Compute the arithmetic mean of the following numbers: 657.5, 471.25, 872.01, 405.54, 221.21 (Round to two decimal places)
A) 521.00
B) 361.50
C) 759.21
D) 525.50
A) 521.00
B) 361.50
C) 759.21
D) 525.50
Unlock Deck
Unlock for access to all 125 flashcards in this deck.
Unlock Deck
k this deck
40
Compute the arithmetic mean of the following numbers: 76, 26, 48, 65, 42, 24, 69, 43 (Round your answer to two decimal places)
A) 49.13
B) 45.50
C) 43.88
D) 41.00
A) 49.13
B) 45.50
C) 43.88
D) 41.00
Unlock Deck
Unlock for access to all 125 flashcards in this deck.
Unlock Deck
k this deck
41
Using 5 classes of width 100 starting at 200, construct a frequency distribution for the following numbers: 440, 386, 563, 403, 571, 448, 484, 496, 212, 696
Use the frequency counts for all 5 classes, starting with class 200 to 299, as your answer.
A) 2, 7, 1, 0, 0
B) 1, 1, 5, 2, 1
C) 3, 1, 0, 2, 1
D) 2, 2, 1, 0, 1
Use the frequency counts for all 5 classes, starting with class 200 to 299, as your answer.
A) 2, 7, 1, 0, 0
B) 1, 1, 5, 2, 1
C) 3, 1, 0, 2, 1
D) 2, 2, 1, 0, 1
Unlock Deck
Unlock for access to all 125 flashcards in this deck.
Unlock Deck
k this deck
42
Find the range of the following numbers: 62, 20, 34, 75, 28, 86, 33, 68
A) 48
B) 20 & 86
C) 66
D) 50.8
A) 48
B) 20 & 86
C) 66
D) 50.8
Unlock Deck
Unlock for access to all 125 flashcards in this deck.
Unlock Deck
k this deck
43
Given this histogram, find the number of workers who produced 60−64 units. (All frequencies graphed to nearest 5)
A) 20
B) 25
C) 40
D) 35
A) 20
B) 25
C) 40
D) 35
Unlock Deck
Unlock for access to all 125 flashcards in this deck.
Unlock Deck
k this deck
44
Using 6 classes of width 15 starting at 30, construct a frequency distribution for the following numbers: 64, 36, 47, 70, 82, 77, 104, 88, 101, 90, 116. What is the frequency for class 4, 75 to 89?
A) 1
B) 2
C) 3
D) 4
A) 1
B) 2
C) 3
D) 4
Unlock Deck
Unlock for access to all 125 flashcards in this deck.
Unlock Deck
k this deck
45
Descriptive statistics is the process of arriving to predictions, forecasts, or estimates based on the data under study.
Unlock Deck
Unlock for access to all 125 flashcards in this deck.
Unlock Deck
k this deck
46
Using 5 classes of width 150 starting at 100, construct a frequency distribution for the following numbers: 436, 786, 355, 211, 117, 821, 619, 679, 697, 644, 168, 145, 655, 176
Use the frequency counts for all 5 classes, starting with class 100 to 249, as your answer.
A) 4, 0, 1, 5, 2
B) 7, 2, 1, 6, 2
C) 5, 1, 1, 5, 2
D) 7, 3, 2, 5
Use the frequency counts for all 5 classes, starting with class 100 to 249, as your answer.
A) 4, 0, 1, 5, 2
B) 7, 2, 1, 6, 2
C) 5, 1, 1, 5, 2
D) 7, 3, 2, 5
Unlock Deck
Unlock for access to all 125 flashcards in this deck.
Unlock Deck
k this deck
47
Calculate the mean of the grouped data from the given frequency distribution. (Round to nearest tenth)
A) 28.7
B) 25.9
C) 38.3
D) 53.6
A) 28.7
B) 25.9
C) 38.3
D) 53.6
Unlock Deck
Unlock for access to all 125 flashcards in this deck.
Unlock Deck
k this deck
48
The range is used as a measure of the dispersion in a set of data.
Unlock Deck
Unlock for access to all 125 flashcards in this deck.
Unlock Deck
k this deck
49
Find the range of the following numbers: 473, 167, 109, 164, 534, 468
A) 164
B) 364
C) 359
D) 425
A) 164
B) 364
C) 359
D) 425
Unlock Deck
Unlock for access to all 125 flashcards in this deck.
Unlock Deck
k this deck
50
The arithmetic mean is the sum of the values of a set of data divided by the number of values in that set.
Unlock Deck
Unlock for access to all 125 flashcards in this deck.
Unlock Deck
k this deck
51
A component bar chart is used to illustrate the relationship between two or more similar values.
Unlock Deck
Unlock for access to all 125 flashcards in this deck.
Unlock Deck
k this deck
52
Calculate the mean of the grouped data from the given frequency distribution. (Round to nearest tenth)
A) 353.7
B) 286.5
C) 253.7
D) 250.0
A) 353.7
B) 286.5
C) 253.7
D) 250.0
Unlock Deck
Unlock for access to all 125 flashcards in this deck.
Unlock Deck
k this deck
53
Using 4 classes of width 150 starting at 500, construct a frequency distribution for the following numbers: 773, 500, 751, 710, 774, 1060, 835, 887, 984, 697. What is the frequency of class 2, 650 to 799?
A) 1
B) 2
C) 4
D) 5
A) 1
B) 2
C) 4
D) 5
Unlock Deck
Unlock for access to all 125 flashcards in this deck.
Unlock Deck
k this deck
54
The mode is the value or values in a set of data that occur most often.
Unlock Deck
Unlock for access to all 125 flashcards in this deck.
Unlock Deck
k this deck
55
Calculate the mean of the grouped data from the given frequency distribution. (Round your answer to the nearest tenth)
A) 27.0
B) 45.5
C) 32.4
D) 49.5
A) 27.0
B) 45.5
C) 32.4
D) 49.5
Unlock Deck
Unlock for access to all 125 flashcards in this deck.
Unlock Deck
k this deck
56
Given this histogram, find the class which has the smallest frequency. (All frequencies graphed to nearest 5)
A) 5−6
B) 7−8
C) 1−2
D) 9−10
A) 5−6
B) 7−8
C) 1−2
D) 9−10
Unlock Deck
Unlock for access to all 125 flashcards in this deck.
Unlock Deck
k this deck
57
Calculate the mean of the grouped data from the given frequency distribution. (Round your answer to the nearest tenth)
A) 225.3
B) 549.5
C) 272.3
D) 449.5
A) 225.3
B) 549.5
C) 272.3
D) 449.5
Unlock Deck
Unlock for access to all 125 flashcards in this deck.
Unlock Deck
k this deck
58
A type of bar chart used to display the data from a frequency distribution is called a histogram.
Unlock Deck
Unlock for access to all 125 flashcards in this deck.
Unlock Deck
k this deck
59
The midpoint value of a set of data when numbers are ranked in ascending or descending order is called the median.
Unlock Deck
Unlock for access to all 125 flashcards in this deck.
Unlock Deck
k this deck
60
Find the range of the following numbers: 42.5, 42.75, 73.01, 88.55, 75, 84.57, 67.38
A) 42.75
B) 47.25
C) 46.05
D) 44.75
A) 42.75
B) 47.25
C) 46.05
D) 44.75
Unlock Deck
Unlock for access to all 125 flashcards in this deck.
Unlock Deck
k this deck
61
The table below shows students at City College of New York.
A)What percentage of female students are taking over 12 credits? (Round to the nearest tenth of a percent)
B)What percentage of students taking 6 or less credits are female? (Round to the nearest tenth of a percent)
A)What percentage of female students are taking over 12 credits? (Round to the nearest tenth of a percent)
B)What percentage of students taking 6 or less credits are female? (Round to the nearest tenth of a percent)
Unlock Deck
Unlock for access to all 125 flashcards in this deck.
Unlock Deck
k this deck
62
Find the range of the following set of values:
5.01, 4.21, 3.35, 2.47, 12.55, 28.64, 33.87, 49.91, 50.98
5.01, 4.21, 3.35, 2.47, 12.55, 28.64, 33.87, 49.91, 50.98
Unlock Deck
Unlock for access to all 125 flashcards in this deck.
Unlock Deck
k this deck
63
Find the mode of the following set of values:
16, 35, 18, 16, 92, 43, 35, 22, 16, 75
16, 35, 18, 16, 92, 43, 35, 22, 16, 75
Unlock Deck
Unlock for access to all 125 flashcards in this deck.
Unlock Deck
k this deck
64
Determine the median of the following set of values:
16, 14, 32, 11, 26, 59, 86, 95, 39, 11, 30
16, 14, 32, 11, 26, 59, 86, 95, 39, 11, 30
Unlock Deck
Unlock for access to all 125 flashcards in this deck.
Unlock Deck
k this deck
65
Jackie's Stuffed Animals sold Teddy Bears at the following prices:
$7.35, $10.50, $18.25, $14.32, $33.00, $22.50.
What is the range of this set of data?
$7.35, $10.50, $18.25, $14.32, $33.00, $22.50.
What is the range of this set of data?
Unlock Deck
Unlock for access to all 125 flashcards in this deck.
Unlock Deck
k this deck
66
The table below shows students at Eagle Mountain College.
A)What percentage of male students are taking 6 or less credits? (Round to the nearest tenth of a percent)
B)What percentage of students taking 7−12 credits are female? (Round to the nearest tenth of a percent)
A)What percentage of male students are taking 6 or less credits? (Round to the nearest tenth of a percent)
B)What percentage of students taking 7−12 credits are female? (Round to the nearest tenth of a percent)
Unlock Deck
Unlock for access to all 125 flashcards in this deck.
Unlock Deck
k this deck
67
Calculate the mean of the following set of values, rounding to the nearest tenth when necessary.
.62, .59, .4, .81, .16, .45, .96, .29
.62, .59, .4, .81, .16, .45, .96, .29
Unlock Deck
Unlock for access to all 125 flashcards in this deck.
Unlock Deck
k this deck
68
Find the range of the following set of values:
$3.25, $6.18, $.92, $5.18, $3.26
$3.25, $6.18, $.92, $5.18, $3.26
Unlock Deck
Unlock for access to all 125 flashcards in this deck.
Unlock Deck
k this deck
69
Find the mode of the following set of values:
$2,200, $7,500, $1,900, $3,600, $4,900
$2,200, $7,500, $1,900, $3,600, $4,900
Unlock Deck
Unlock for access to all 125 flashcards in this deck.
Unlock Deck
k this deck
70
Determine the median of the following set of values:
$1.25, $2.18, $4.56, $3.89, $1.67, $2.42, $3.25, $2.12
$1.25, $2.18, $4.56, $3.89, $1.67, $2.42, $3.25, $2.12
Unlock Deck
Unlock for access to all 125 flashcards in this deck.
Unlock Deck
k this deck
71
Determine the median of the following set of values:
42%, 86%, 50%, 12%, 51%, 49%, 52%, 23%
42%, 86%, 50%, 12%, 51%, 49%, 52%, 23%
Unlock Deck
Unlock for access to all 125 flashcards in this deck.
Unlock Deck
k this deck
72
A series of data points on a grid, continuously connected by straight lines, that display a picture of selected data changing over a period of time is called a line chart.
Unlock Deck
Unlock for access to all 125 flashcards in this deck.
Unlock Deck
k this deck
73
Find the range of the following set of values:
1,910, 2,814, 1,612, 1,100, 2,210, 1,418
1,910, 2,814, 1,612, 1,100, 2,210, 1,418
Unlock Deck
Unlock for access to all 125 flashcards in this deck.
Unlock Deck
k this deck
74
Find the mode of the following set of values:
4, 6, 3, 6, 5, 3, 1, 9, 6, 3, 7, 2, 3, 6, 8, 5, 6, 3
4, 6, 3, 6, 5, 3, 1, 9, 6, 3, 7, 2, 3, 6, 8, 5, 6, 3
Unlock Deck
Unlock for access to all 125 flashcards in this deck.
Unlock Deck
k this deck
75
Calculate the mean of the following set of values, rounding to the nearest tenth when necessary.
615, 923, 832, 336, 425, 875, 102, 773
615, 923, 832, 336, 425, 875, 102, 773
Unlock Deck
Unlock for access to all 125 flashcards in this deck.
Unlock Deck
k this deck
76
As sales manager for Magnum Enterprises, use Table 21-1 from the text to find:
A)which territory had the greatest total percentage of sales for February?
B)what is the percentage of sales? (Round to the nearest tenth of a percent)
A)which territory had the greatest total percentage of sales for February?
B)what is the percentage of sales? (Round to the nearest tenth of a percent)
Unlock Deck
Unlock for access to all 125 flashcards in this deck.
Unlock Deck
k this deck
77
The chart obtained by dividing data into equal-size classes is called a frequency distribution, or frequency table.
Unlock Deck
Unlock for access to all 125 flashcards in this deck.
Unlock Deck
k this deck
78
Calculate the mean of the following set of values, rounding to the nearest tenth when necessary.
12.5, 11.65, 10.24, 9.4, 8.24, 7.57, 6.35, 5.87, 4.98, 3.96, 2.63, 1.32
12.5, 11.65, 10.24, 9.4, 8.24, 7.57, 6.35, 5.87, 4.98, 3.96, 2.63, 1.32
Unlock Deck
Unlock for access to all 125 flashcards in this deck.
Unlock Deck
k this deck
79
You are the President of Boca Grande & Company. Your staff has prepared Table 21-1 from the text. You want to know what percentage of the total units sold in May were standard. (Round to the nearest tenth of a percent)
Unlock Deck
Unlock for access to all 125 flashcards in this deck.
Unlock Deck
k this deck
80
The y-axis is the horizontal axis of a chart.
Unlock Deck
Unlock for access to all 125 flashcards in this deck.
Unlock Deck
k this deck
Unlock Deck
Unlock for access to all 125 flashcards in this deck.


