Deck 17: Sampling Distribution Models
Full screen (f)
Question
Question
Question
Question
Question
Question
Question
Question
Question
Question
Question
Question
Question
Question
Question
Question
Question
Question
Question
Question
Question
Question
Question
Question
Question
Question
Question
Question
Question
Question
Question
Question
Statistics from a weather centre indicate that a certain city receives an average of 23 inches of snow each year,with a standard deviation of 3 inches.Assume that a Normal model applies.A student lives in this city for 4 years.Let 
Represent the mean amount of snow for those 4 years.Describe the sampling distribution model of this sample mean.
A)Binom(23,3)
B)N(23,1.5)
C)N(23,0.75)
D)N(23,3)
E)There is not enough information to describe the distribution.
Represent the mean amount of snow for those 4 years.Describe the sampling distribution model of this sample mean.
A)Binom(23,3)
B)N(23,1.5)
C)N(23,0.75)
D)N(23,3)
E)There is not enough information to describe the distribution.
Question
Some real estate specialists estimate that the length of time people live in a house has a mean of 10 years and a standard deviation of 3 years.A random sample of 200 families was chosen and surveyed.Let 
Represent the mean number of years that those families had lived in their house.Describe the sampling distribution model of this mean.
A)Binom(10,3)
B)N(10,1.5)
C)N(10,3)
D)N(10,0.12)
E)There is not enough information to describe the distribution.
Represent the mean number of years that those families had lived in their house.Describe the sampling distribution model of this mean.
A)Binom(10,3)
B)N(10,1.5)
C)N(10,3)
D)N(10,0.12)
E)There is not enough information to describe the distribution.
Question
The number of hours per week that high school students spend on computers is normally distributed,with a mean of 5 hours and a standard deviation of 2 hours.70 students are chosen at random.Let 
Represent the mean number of hours spent on the computer for this group.Find the probability that
Is between 5.1 and 5.7.
A)0.672
B)0.660
C)0.115
D)0.336
E)2.510
Represent the mean number of hours spent on the computer for this group.Find the probability that
Is between 5.1 and 5.7.
A)0.672
B)0.660
C)0.115
D)0.336
E)2.510
Question
Question
Question
Automatic teller machine receipts show that customer withdrawals have a skewed distribution with a mean of $72 and a standard deviation of $15.Let 
Represent the mean withdrawal for the next 200 customers at the machine.Describe the sampling distribution model of this mean.
A)The distribution is skewed with a mean of $72 and a standard deviation of $15.
B)N(72,15)
C)N(5.1,15)
D)N(72,1.41)
E)There is not enough information to describe the distribution.
Question
Question
Question
The number of hours per week that high school students spend on homework is normally distributed,with a mean of 12 hours and a standard deviation of 3 hours.50 students are chosen at random.Let 
Represent the mean number of hours spent on homework for this group.Find the probability that
Is between 10.8 and 13.0.
A)0.0078
B)0.286
C)0.9886
D)0.4711
E)0.0143
Represent the mean number of hours spent on homework for this group.Find the probability that
Is between 10.8 and 13.0.
A)0.0078
B)0.286
C)0.9886
D)0.4711
E)0.0143
Question
Question
A sample is chosen randomly from a population that was strongly skewed to the right.Describe the sampling distribution model for the sample mean if the sample size is small.
A)Skewed right,centre at μ,standard deviation σ/

B)Normal,centre at μ,standard deviation

C)There is not enough information to describe the sampling distribution model.
D)Normal,centre at μ,standard deviation σ/

E)Skewed right,centre at μ,standard deviation

A)Skewed right,centre at μ,standard deviation σ/
B)Normal,centre at μ,standard deviation
C)There is not enough information to describe the sampling distribution model.
D)Normal,centre at μ,standard deviation σ/
E)Skewed right,centre at μ,standard deviation
Question
Question
Question
A zoo offers several levels of membership,as shown in the table. 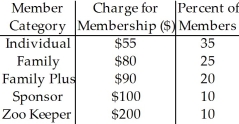
If we select a random sample of 50 zoo members,would you expect their membership charges to follow a Normal model? Explain.
If we select a random sample of 50 zoo members,would you expect their membership charges to follow a Normal model? Explain.

Unlock Deck
Sign up to unlock the cards in this deck!
Unlock Deck
Unlock Deck
1/45
Play
Full screen (f)
Deck 17: Sampling Distribution Models
1
A candy company claims that its jelly bean mix contains 15% blue jelly beans.Suppose that the candies are packaged at random in small bags containing about 200 jelly beans.What is the probability that a bag will contain more than 20% blue jelly beans?
A)0.9761
B)0.0239
C)0.0422
D)0.0478
E)0.9578
A)0.9761
B)0.0239
C)0.0422
D)0.0478
E)0.9578
0.0239
2
If the students toss the coin 50 times each,about 68% should have proportions between what two numbers?
A)0.43 and 0.57
B)0.49 and 0.51
C)0.34 and 0.67
D)0.07 and 0.14
E)0.16 and 0.84
A)0.43 and 0.57
B)0.49 and 0.51
C)0.34 and 0.67
D)0.07 and 0.14
E)0.16 and 0.84
0.43 and 0.57
3
A candy company claims that its jelly bean mix contains 15% blue jelly beans.Suppose that the candies are packaged at random in small bags containing about 200 jelly beans.What is the probability that a bag will contain more than 12% blue jelly beans?
A)0.8625
B)0.117
C)0.234
D)0.9141
E)0.883
A)0.8625
B)0.117
C)0.234
D)0.9141
E)0.883
0.883
4
Assume that 15% of students at a university wear contact lenses.We randomly pick 200 students.What is the probability that more than 16% of this sample wear contact lenses?
A)0.345
B)0.654
C)0.309
D)0.397
E)0.692
A)0.345
B)0.654
C)0.309
D)0.397
E)0.692
Unlock Deck
Unlock for access to all 45 flashcards in this deck.
Unlock Deck
k this deck
5
A realtor has been told that 47% of homeowners in a city prefer to have a finished basement.She surveys a group of 400 homeowners randomly chosen from her client list.Describe the sampling distribution model of the proportion of homeowners in this sample who prefer a finished basement.
A)Binom(400,47%)
B)N(53%,2.5%)
C)N(47%,1.2%)
D)N(47%,2.5%)
E)There is not enough information to describe the distribution.
A)Binom(400,47%)
B)N(53%,2.5%)
C)N(47%,1.2%)
D)N(47%,2.5%)
E)There is not enough information to describe the distribution.
Unlock Deck
Unlock for access to all 45 flashcards in this deck.
Unlock Deck
k this deck
6
Based on past experience,a bank believes that 5% of the people who receive loans will not make payments on time.The bank has recently approved 300 loans.What is the probability that over 6% of these clients will not make timely payments?
A)0.215
B)0.573
C)0.786
D)0.427
E)0.794
A)0.215
B)0.573
C)0.786
D)0.427
E)0.794
Unlock Deck
Unlock for access to all 45 flashcards in this deck.
Unlock Deck
k this deck
7
A candy company claims that 20% of the jelly beans in its spring mix are pink.Suppose that the candies are packaged at random in small bags containing about 200 jelly beans.A class of students opens several bags,counts the various colors of jelly beans,and calculates the proportion that are pink.Is it appropriate to use a Normal model to describe the distribution of the proportion of pink jelly beans?
A)A Normal model is appropriate because the 200 bags of jelly beans can be thought of as a random sample of bags and are fewer than 10% of the population of all bags.The success/failure condition is also satisfied because np = 40 ≥ 10 and nq = 160 ≥ 10.
B)A Normal model is appropriate because the samples are random and independent.Also,the sample size,200,is less than 10% of the population.Most importantly,the original population has a Normal distribution.
C)A Normal model is not appropriate because the population distribution is not Normal.
D)A Normal model is not appropriate because the sample size is not large enough to satisfy the success/failure condition.
E)A Normal model is not appropriate because the sample size,200,is larger than 10% of the population of all bags of jelly beans.
Unlock Deck
Unlock for access to all 45 flashcards in this deck.
Unlock Deck
k this deck
8
In a large statistics class,the professor has each student toss a coin 58 times and calculate the proportion of his or her tosses that were tails.The students then report their results,and the professor plots a histogram of these several proportions.Should a Normal model be used here?
A)A Normal model should be used because the samples are random and independent.Also,the sample size,58,is less than 10% of the population.Most importantly,the original population has a Normal distribution.
B)A Normal model should be used because the 58 coin tosses can be thought of as a random sample of coin tosses and are fewer than 10% of the population of all coins.The success/failure condition is also satisfied because np = 29 ≥ 10 and nq = 29 ≥ 10.
C)A Normal model should not be used because the sample size is not large enough to satisfy the success/failure condition.
D)A Normal model should not be used because the sample size,58,is larger than 10% of the population of all coins.
E)A Normal model should not be used because the population distribution is not Normal.
Unlock Deck
Unlock for access to all 45 flashcards in this deck.
Unlock Deck
k this deck
9
A grower claims that only 13% of the strawberries he grows are unsatisfactory.When a truckload of his strawberries arrives at a farmers' market,one basket containing approximately 105 strawberries is examined for bruised or rotten fruit.Are the conditions satisfied for use of the Normal model?
A)The 10% condition is satisfied since the strawberries are a random sample,are independent of each other,and likely represent less than 10% of all the grower's strawberries.The success/failure condition is not satisfied since only one basket is being examined.
B)The conditions are satisfied since the population distribution is Normal.
C)Since the strawberries are in the same basket,they may not be independent of each other,or be a random sample.Growing or storage conditions could affect all the strawberries in a basket.The success/failure condition is not satisfied since only one basket is being examined.
D)The 10% condition is satisfied since the strawberries are a random sample,are independent of each other,and likely represent less than 10% of all the grower's strawberries.The success/failure condition is satisfied since np = 13.65 ≥ 10 and nq = 91.35 ≥ 10.
E)Since the strawberries are in the same basket,they may not be independent of each other,or be a random sample.Growing or storage conditions could affect all the strawberries in a basket.The success/failure condition is satisfied since np = 13.65 ≥ 10 and nq = 91.35 ≥ 10.
Unlock Deck
Unlock for access to all 45 flashcards in this deck.
Unlock Deck
k this deck
10
A 1000-acre farm historically averages 196 bushels per acre with a standard deviation of 15 bushels per acre.Fifty acres are sampled and the yields determined.Is it appropriate to assume this data will be well modeled by a Normal distribution?
A)The Normal distribution cannot be used since the 50 acres are not necessarily independent.
B)The Normal distribution can be used since the 50 acres represent no more than 10% of all farm acres.
C)The Normal distribution cannot be used.The distribution in the sample should resemble that in the population,which may be skewed by some acres with extremely low yields.
D)The Normal distribution cannot be used since the sample size is not large enough for the Normal model to work well.
E)The Normal distribution can be used since the sample is random and the yields for each acre are independent.
Unlock Deck
Unlock for access to all 45 flashcards in this deck.
Unlock Deck
k this deck
11
A candy company claims that 9% of the jelly beans in its spring mix are pink.Suppose that the candies are packaged at random in small bags containing about 50 jelly beans.A class of students opens several bags,counts the various colors of jelly beans,and calculates the proportion that are pink.Is it appropriate to use a Normal model to describe the distribution of the proportion of pink jelly beans?
A)A Normal model is appropriate because the 50 bags of jelly beans can be thought of as a random sample of bags and are fewer than 10% of the population of all bags.The success/failure condition is also satisfied because n = 50 ≥ 10.
B)A Normal model is appropriate because the samples are random and independent.Also,the sample size,50,is less than 10% of the population.
C)A Normal model is not appropriate because the sample size is not large enough to satisfy the success/failure condition.For this sample size,np = 4.5 < 10.
D)A Normal model is not appropriate because the sample size,50,is larger than 10% of the population of all bags of jelly beans.
E)A Normal model is not appropriate because the population distribution is not Normal.
Unlock Deck
Unlock for access to all 45 flashcards in this deck.
Unlock Deck
k this deck
12
A 1000-acre farm historically averages 193 bushels per acre with a standard deviation of 16 bushels per acre.Fifty acres are sampled and the mean yield determined.If we imagined all the possible random samples of 50 acres we could take and looked at all the sample means,is it appropriate to assume this data will be well modeled by a Normal distribution?
A)The Normal distribution can be used since the original population has a Normal distribution.
B)The Normal distribution cannot be used.The distribution in the sample should resemble that in the population,which may be skewed by some acres with extremely low yields.
C)The Normal distribution can be used since the samples can be assumed to be random and independent.However,there could be some doubt since weather conditions could affect all samples.The sample size,50,is no more than 10% of the population of all acres on the farm.
D)The Normal distribution cannot be used since the sample size is not large enough for the Central Limit Theorem to apply.
E)The Normal distribution can be used since the sample size,50,is no more than 10% of the population of all acres on the farm.
Unlock Deck
Unlock for access to all 45 flashcards in this deck.
Unlock Deck
k this deck
13
When a truckload of oranges arrives at a packing plant,a random sample of 125 is selected and examined.The whole truckload will be rejected if more than 8% of the sample is unsatisfactory.Suppose that in fact 11% of the oranges on the truck do not meet the desired standard.What's the probability that the shipment will be accepted anyway?
A)0.0827
B)0.2846
C)0.9173
D)0.1423
E)0.8577
A)0.0827
B)0.2846
C)0.9173
D)0.1423
E)0.8577
Unlock Deck
Unlock for access to all 45 flashcards in this deck.
Unlock Deck
k this deck
14
Based on past experience,a bank believes that 9% of the people who receive loans will not make payments on time.The bank has recently approved 300 loans.Describe the sampling distribution model of the proportion of clients in this group who may not make timely payments.
A)Binom(300,9%)
B)N(9%,0.5%)
C)N(91%,1.7%)
D)N(9%,1.7%)
E)There is not enough information to describe the distribution.
A)Binom(300,9%)
B)N(9%,0.5%)
C)N(91%,1.7%)
D)N(9%,1.7%)
E)There is not enough information to describe the distribution.
Unlock Deck
Unlock for access to all 45 flashcards in this deck.
Unlock Deck
k this deck
15
In a large statistics class,the professor has each student toss a coin 14 times and calculate the proportion of his or her tosses that were tails.The students then report their results,and the professor plots a histogram of these several proportions.Should a Normal model be used here?
A)A Normal model should not be used because the sample size,14,is larger than 10% of the population of all coins.
B)A Normal model should be used because the samples are random and independent.Also,the sample size,14,is less than 10% of the population.
C)A Normal model should not be used because the sample size is not large enough to satisfy the success/failure condition.For this sample size,np = 7 < 10.
D)A Normal model should be used because the 14 coin tosses can be thought of as a random sample of coin tosses and are fewer than 10% of the population of all coins.The success/failure condition is also satisfied because n = 14 ≥ 10.
E)A Normal model should not be used because the population distribution is not Normal.
Unlock Deck
Unlock for access to all 45 flashcards in this deck.
Unlock Deck
k this deck
16
If the students toss the coin 100 times each,about 95% should have proportions between what two numbers?
A)0.4 and 0.6
B)0.49 and 0.51
C)0.1 and 0.15
D)0.025 and 0.975
E)0.2375 and 0.7375
A)0.4 and 0.6
B)0.49 and 0.51
C)0.1 and 0.15
D)0.025 and 0.975
E)0.2375 and 0.7375
Unlock Deck
Unlock for access to all 45 flashcards in this deck.
Unlock Deck
k this deck
17
When a truckload of oranges arrives at a packing plant,a random sample of 125 is selected and examined.The whole truckload will be rejected if more than 8% of the sample is unsatisfactory.Suppose that in fact 10% of the oranges on the truck do not meet the desired standard.What's the probability that the shipment will be rejected?
A)0.7734
B)0.8155
C)0.4532
D)0.1845
E)0.2266
A)0.7734
B)0.8155
C)0.4532
D)0.1845
E)0.2266
Unlock Deck
Unlock for access to all 45 flashcards in this deck.
Unlock Deck
k this deck
18
If the students toss the coin 50 times each,about 99.7% should have proportions between what two numbers?
A)0.00075 and 0.99925
B)0.47 and 0.53
C)0.0015 and 0.9985
D)0.21 and 0.28
E)0.29 and 0.71
A)0.00075 and 0.99925
B)0.47 and 0.53
C)0.0015 and 0.9985
D)0.21 and 0.28
E)0.29 and 0.71
Unlock Deck
Unlock for access to all 45 flashcards in this deck.
Unlock Deck
k this deck
19
A candy company claims that its jelly bean mix contains 24% blue jelly beans.Suppose that the candies are packaged at random in small bags containing about 450 jelly beans.Describe the sampling distribution model of the proportion of blue jelly beans in a bag.
A)N(24%,0.9%)
B)N(24%,2.0%)
C)N(76%,2.0%)
D)Binom(450,24%)
E)There is not enough information to describe the distribution.
A)N(24%,0.9%)
B)N(24%,2.0%)
C)N(76%,2.0%)
D)Binom(450,24%)
E)There is not enough information to describe the distribution.
Unlock Deck
Unlock for access to all 45 flashcards in this deck.
Unlock Deck
k this deck
20
Assume that 32% of students at a university wear contact lenses.We randomly pick 300 students.Describe the sampling distribution model of the proportion of students in this group who wear contact lenses.
A)N(32%,1.3%)
B)N(32%,2.7%)
C)N(68%,2.7%)
D)Binom(300,32)
E)There is not enough information to describe the distribution.
A)N(32%,1.3%)
B)N(32%,2.7%)
C)N(68%,2.7%)
D)Binom(300,32)
E)There is not enough information to describe the distribution.
Unlock Deck
Unlock for access to all 45 flashcards in this deck.
Unlock Deck
k this deck
21
Suppose that the national mean weight for a three-year-old girl is 30 pounds with a standard deviation of 5 pounds.A pediatric office takes a random sample of 100 three-year-old girls,records their weights,and finds the mean.Describe the sampling distribution model of this mean.
A)Binom(30,5)
B)N(30,0.5)
C)N(30,0.05)
D)N(30,5)
E)There is not enough information to describe the distribution.
A)Binom(30,5)
B)N(30,0.5)
C)N(30,0.05)
D)N(30,5)
E)There is not enough information to describe the distribution.
Unlock Deck
Unlock for access to all 45 flashcards in this deck.
Unlock Deck
k this deck
22
The weight of crackers in a box is stated to be 450 grams.The amount that the packaging machine puts in the boxes is believed to have a Normal model with mean 465 grams and standard deviation 30 grams.What is the probability that the mean weight of a 50-box case of crackers is below 450 grams?
A)0.9998
B)0.9996
C)0.0015
D)0.0002
E)0.0004
A)0.9998
B)0.9996
C)0.0015
D)0.0002
E)0.0004
Unlock Deck
Unlock for access to all 45 flashcards in this deck.
Unlock Deck
k this deck
23
Researchers believe that 6% of children have a gene that may be linked to a certain childhood disease.In an effort to track 50 of these children,researchers test 950 newborns for the presence of this gene.What is the probability that they find enough subjects for their study?
A)0.7912
B)0.1685
C)0.8315
D)0.8507
E)0.337
A)0.7912
B)0.1685
C)0.8315
D)0.8507
E)0.337
Unlock Deck
Unlock for access to all 45 flashcards in this deck.
Unlock Deck
k this deck
24
If we imagine all the possible random samples of 250 students at this university,68% of the samples should have means between what two numbers?
A)$2,424.11 and $2,651.78
B)$2,348.22 and $2,651.78
C)$2,272.33 and $2,727.67
D)$1300 and $2700
E)$2,424.11 and $2,575.89
A)$2,424.11 and $2,651.78
B)$2,348.22 and $2,651.78
C)$2,272.33 and $2,727.67
D)$1300 and $2700
E)$2,424.11 and $2,575.89
Unlock Deck
Unlock for access to all 45 flashcards in this deck.
Unlock Deck
k this deck
25
A restaurant's receipts show that the cost of customers' dinners has a skewed distribution with a mean of $54 and a standard deviation of $18.What is the probability that the next 100 customers will spend an average of at least $58 on dinner?
A)0.0562
B)0.5879
C)0.4121
D)0.9868
E)0.0132
A)0.0562
B)0.5879
C)0.4121
D)0.9868
E)0.0132
Unlock Deck
Unlock for access to all 45 flashcards in this deck.
Unlock Deck
k this deck
26
If we imagine all the possible random samples of 150 students at this university,99.7% of the samples should have means between what two numbers?
A)$2272.32 and $2727.68
B)$2,304.04 and $2,695.96
C)$150.00 and $2,695.96
D)$150.00 and $2,597.98
E)$300 and $4900
A)$2272.32 and $2727.68
B)$2,304.04 and $2,695.96
C)$150.00 and $2,695.96
D)$150.00 and $2,597.98
E)$300 and $4900
Unlock Deck
Unlock for access to all 45 flashcards in this deck.
Unlock Deck
k this deck
27
A hair stylist believes the distribution of her tips is Normal,with a mean of $10.50 and a standard deviation of $6.25.What is the probability that her 15 clients this weekend will tip an average of at least $12?
A)0.8238
B)0.2371
C)0.4052
D)0.5948
E)0.1762
A)0.8238
B)0.2371
C)0.4052
D)0.5948
E)0.1762
Unlock Deck
Unlock for access to all 45 flashcards in this deck.
Unlock Deck
k this deck
28
The weight of crackers in a box is stated to be 450 grams.The amount that the packaging machine puts in the boxes is believed to have a Normal model with mean 465 grams and standard deviation 30 grams.What is the probability that the mean weight of a 50-box case of crackers is above 450 grams?
A)0.0002
B)0.9996
C)0.9998
D)0.0004
E)0.9994
A)0.0002
B)0.9996
C)0.9998
D)0.0004
E)0.9994
Unlock Deck
Unlock for access to all 45 flashcards in this deck.
Unlock Deck
k this deck
29
A candy company claims that 17% of the jelly beans in its spring mix are pink.Suppose that the candies are packaged at random in bags containing about 400 jelly beans.A class of students opens several bags,counts the various colours of jelly beans,and calculates the proportion that are pink.In one bag,the students found 14% of the jelly beans were pink.Is this an unusually small proportion of pink jelly beans? Explain your response.
A)This is an extremely unlikely result.It is 0.21 standard deviations below the mean.
B)This is a very unusual result.It is 0.08 standard deviations below the mean.
C)This is not an unusual result.It is only 1.60 standard deviations below the mean.
D)This is a very unusual result.It is 0.05 standard deviations below the mean.
E)This is not an unusual result.It is only 0.05 standard deviations below the mean.
Unlock Deck
Unlock for access to all 45 flashcards in this deck.
Unlock Deck
k this deck
30
In a large class,the professor has each person toss a coin 200 times and calculate the proportion of his or her tosses that were tails.The students then report their results,and the professor records the proportions.One student claims to have tossed her coin 200 times and found 58% tails.What do you think of this claim? Explain your response.
A)This is a fairly unusual result.Her proportion is about 1.60 standard deviations above the mean.
B)This is a typical result.Her proportion is only 2.26 standard deviations above the mean.
C)This is a fairly unusual result.Her proportion is about 2.26 standard deviations above the mean.
D)This is an extremely unlikely result.Her proportion is about 200 standard deviations above the mean.
E)This is a typical result.Her proportion is only 1.60 standard deviations above the mean.
Unlock Deck
Unlock for access to all 45 flashcards in this deck.
Unlock Deck
k this deck
31
A restaurant's receipts show that the cost of customers' dinners has a skewed distribution with a mean of $54 and a standard deviation of $18.What is the probability that the next 100 customers will spend an average of less than $50 on dinner?
A)0.4121
B)0.9868
C)0.0132
D)0.5879
E)0.9614
A)0.4121
B)0.9868
C)0.0132
D)0.5879
E)0.9614
Unlock Deck
Unlock for access to all 45 flashcards in this deck.
Unlock Deck
k this deck
32
Statistics from a weather centre indicate that a certain city receives an average of 23 inches of snow each year,with a standard deviation of 3 inches.Assume that a Normal model applies.A student lives in this city for 4 years.Let
Represent the mean amount of snow for those 4 years.Describe the sampling distribution model of this sample mean.
A)Binom(23,3)
B)N(23,1.5)
C)N(23,0.75)
D)N(23,3)
E)There is not enough information to describe the distribution.
Represent the mean amount of snow for those 4 years.Describe the sampling distribution model of this sample mean.
A)Binom(23,3)
B)N(23,1.5)
C)N(23,0.75)
D)N(23,3)
E)There is not enough information to describe the distribution.
Unlock Deck
Unlock for access to all 45 flashcards in this deck.
Unlock Deck
k this deck
33
Some real estate specialists estimate that the length of time people live in a house has a mean of 10 years and a standard deviation of 3 years.A random sample of 200 families was chosen and surveyed.Let
Represent the mean number of years that those families had lived in their house.Describe the sampling distribution model of this mean.
A)Binom(10,3)
B)N(10,1.5)
C)N(10,3)
D)N(10,0.12)
E)There is not enough information to describe the distribution.
Represent the mean number of years that those families had lived in their house.Describe the sampling distribution model of this mean.
A)Binom(10,3)
B)N(10,1.5)
C)N(10,3)
D)N(10,0.12)
E)There is not enough information to describe the distribution.
Unlock Deck
Unlock for access to all 45 flashcards in this deck.
Unlock Deck
k this deck
34
The number of hours per week that high school students spend on computers is normally distributed,with a mean of 5 hours and a standard deviation of 2 hours.70 students are chosen at random.Let
Represent the mean number of hours spent on the computer for this group.Find the probability that
Is between 5.1 and 5.7.
A)0.672
B)0.660
C)0.115
D)0.336
E)2.510
Represent the mean number of hours spent on the computer for this group.Find the probability that
Is between 5.1 and 5.7.
A)0.672
B)0.660
C)0.115
D)0.336
E)2.510
Unlock Deck
Unlock for access to all 45 flashcards in this deck.
Unlock Deck
k this deck
35
Researchers believe that 7% of children have a gene that may be linked to a certain childhood disease.In an effort to track 50 of these children,researchers test 950 newborns for the presence of this gene.What is the probability that they do not find enough subjects for their study?
A)0.9821
B)0.0179
C)0.0358
D)0.2117
E)0.9581
A)0.9821
B)0.0179
C)0.0358
D)0.2117
E)0.9581
Unlock Deck
Unlock for access to all 45 flashcards in this deck.
Unlock Deck
k this deck
36
If we imagine all the possible random samples of 150 students at this university,95% of the samples should have means between what two numbers?
A)$2,206.06 and $2,793.94
B)$150.00 and $2,695.96
C)$2,304.04 and $2,695.96
D)$300 and $4900
E)$150.00 and $2,597.98
A)$2,206.06 and $2,793.94
B)$150.00 and $2,695.96
C)$2,304.04 and $2,695.96
D)$300 and $4900
E)$150.00 and $2,597.98
Unlock Deck
Unlock for access to all 45 flashcards in this deck.
Unlock Deck
k this deck
37
Automatic teller machine receipts show that customer withdrawals have a skewed distribution with a mean of $72 and a standard deviation of $15.Let
Represent the mean withdrawal for the next 200 customers at the machine.Describe the sampling distribution model of this mean.
A)The distribution is skewed with a mean of $72 and a standard deviation of $15.
B)N(72,15)
C)N(5.1,15)
D)N(72,1.41)
E)There is not enough information to describe the distribution.
Unlock Deck
Unlock for access to all 45 flashcards in this deck.
Unlock Deck
k this deck
38
A national study reported that 76% of high school graduates pursue a college education immediately after graduation.A private high school advertises that 156 of their 196 graduates last year went on to college.Does this school have an unusually high proportion of students going to university?
A)This school can boast an unusually high proportion of students going to university.Their proportion is 0.94 standard deviations above the mean.
B)This school cannot boast an unusually high proportion of students going to university.Their proportion is only 0.71 standard deviations above the mean.
C)This school cannot boast an unusually high proportion of students going to university.Their proportion is only 1.18 standard deviations above the mean.
D)This school cannot boast an unusually high proportion of students going to university.Their proportion is only 0.94 standard deviations above the mean.
E)This school can boast an unusually high proportion of students going to university.Their proportion is 1.41 standard deviations above the mean.
Unlock Deck
Unlock for access to all 45 flashcards in this deck.
Unlock Deck
k this deck
39
Information on a packet of seeds claims that the germination rate is 75%.Should you be surprised if 141 of the 150 seeds in the packet germinate?
A)You should not be surprised.A germination rate of 94.0% is only 3.22 standard deviations above the mean.
B)You should be very surprised.A germination rate of 94.0% is 5.37 standard deviations above the mean.
C)You should not be surprised.A germination rate of 94.0% is only 5.37 standard deviations above the mean.
D)You should be very surprised.A germination rate of 94.0% is 8.06 standard deviations above the mean.
E)You should be very surprised.A germination rate of 94.0% is 6.72 standard deviations above the mean.
Unlock Deck
Unlock for access to all 45 flashcards in this deck.
Unlock Deck
k this deck
40
The number of hours per week that high school students spend on homework is normally distributed,with a mean of 12 hours and a standard deviation of 3 hours.50 students are chosen at random.Let
Represent the mean number of hours spent on homework for this group.Find the probability that
Is between 10.8 and 13.0.
A)0.0078
B)0.286
C)0.9886
D)0.4711
E)0.0143
Represent the mean number of hours spent on homework for this group.Find the probability that
Is between 10.8 and 13.0.
A)0.0078
B)0.286
C)0.9886
D)0.4711
E)0.0143
Unlock Deck
Unlock for access to all 45 flashcards in this deck.
Unlock Deck
k this deck
41
Some experts claim that the length of time people live in a house can be described by a Normal distribution with a mean of 7.2 years and a standard deviation of 2.4 years.Suppose you calculate the percentage of homeowners who stay in their house for more than 9 years and the probability that the mean length of time for a sample of 100 homeowners is more than 9 years.If the correct model for the length of time people live in a home is in fact skewed to the right,does that change your answer to either calculation? Explain.
Unlock Deck
Unlock for access to all 45 flashcards in this deck.
Unlock Deck
k this deck
42
A sample is chosen randomly from a population that was strongly skewed to the right.Describe the sampling distribution model for the sample mean if the sample size is small.
A)Skewed right,centre at μ,standard deviation σ/
B)Normal,centre at μ,standard deviation
C)There is not enough information to describe the sampling distribution model.
D)Normal,centre at μ,standard deviation σ/
E)Skewed right,centre at μ,standard deviation
A)Skewed right,centre at μ,standard deviation σ/
B)Normal,centre at μ,standard deviation
C)There is not enough information to describe the sampling distribution model.
D)Normal,centre at μ,standard deviation σ/
E)Skewed right,centre at μ,standard deviation
Unlock Deck
Unlock for access to all 45 flashcards in this deck.
Unlock Deck
k this deck
43
A hair stylist believes the distribution of her tips is Normal,with a mean of $10.50 and a standard deviation of $6.25.What is the probability that her 15 clients this weekend will tip an average of less than $13?
A)0.0377
B)0.9394
C)0.4000
D)0.0606
E)0.6000
A)0.0377
B)0.9394
C)0.4000
D)0.0606
E)0.6000
Unlock Deck
Unlock for access to all 45 flashcards in this deck.
Unlock Deck
k this deck
44
Some experts estimate that the length of time people live in a house has a mean of 7.3 years and a standard deviation of 2.2 years.Explain why you could estimate the probability that 100 people selected at random had lived in their houses for an average of 9 years or more,but you could not estimate the probability that an individual had done so.
Unlock Deck
Unlock for access to all 45 flashcards in this deck.
Unlock Deck
k this deck
45
A zoo offers several levels of membership,as shown in the table.
If we select a random sample of 50 zoo members,would you expect their membership charges to follow a Normal model? Explain.
If we select a random sample of 50 zoo members,would you expect their membership charges to follow a Normal model? Explain.
Unlock Deck
Unlock for access to all 45 flashcards in this deck.
Unlock Deck
k this deck
Unlock Deck
Unlock for access to all 45 flashcards in this deck.


