Deck 19: Testing Hypotheses About Proportions
Full screen (f)
Question
Question
Question
In April of 2011,the unemployment rate in Canada was reported to be 7.6%.Suppose we claim that the current unemployment rate differs from the April 2011 unemployment rate.If we wish to support our claim,what are the null and alternative hypotheses?
A)
B)
C)
D)
E)
A)
B)
C)
D)
E)
Question
Question
Question
Question
Question
4% of trucks of a certain model have needed new engines after being driven between 0 and 100 kilometres.The manufacturer hopes that the redesign of one of the engine's components has solved this problem.
A)
B)
C)
D)
E)
A)
B)
C)
D)
E)
Question
A weight loss centre provided a loss for 72% of its participants.The centre's leader decides to test a new weight loss strategy to see if it's better.What are the null and alternative hypotheses?
A)
B)
C)
D)
E)
A)
B)
C)
D)
E)
Question
A city claims that 75% of all low income housing is 1500 sq.ft.The tenants believe the proportion of housing this size is smaller than the claim,and hire an independent firm to test an appropriate hypothesis.What are the null and alternative hypotheses?
A)
B)
C)
D)
E)
A)
B)
C)
D)
E)
Question
Question
According to the 2004 Canadian Community Health Survey,23.1% of Canadians aged 18 or older were considered obese;that is,they had a body mass index (BMI)of 30 more higher.Suppose you believe that the percentage of obese Canadians has increased since 2004 and wish to test your belief.What are the null and alternative hypotheses?
A)
B)
C)
D)
E)
A)
B)
C)
D)
E)
Question
A mayor is concerned about the percentage of city residents who express disapproval of his job performance.His political committee pays for a newspaper ad,hoping that it will keep the disapproval rate below 21%.They will use a follow-up poll to assess the ad's effectiveness.
A)
B)
C)
D)
E)
A)
B)
C)
D)
E)
Question
A new manager,hired at a large warehouse,was told to reduce the 26% employee sick leave.The manager introduced a new incentive program for employees with perfect attendance.The manager decides to test the new program to see if it's better.What are the null and alternative hypotheses?
A)
B)
C)
D)
E)
A)
B)
C)
D)
E)
Question
Question
Question
Health Canada reports that,in 2005,85% of Canadians were satisfied with the health care services they received.Suppose you are now concerned that a smaller percentage of Canadians are satisfied with the health care services they received.If you want to justify your concerns,what are the null and alternative hypotheses?
A)
B)
C)
D)
E)
A)
B)
C)
D)
E)
Question
In 2010,the proportion of employees at a large company who commuted to work by car was 8%.A current survey investigates whether the proportion of employees who commute by car to work is higher than it was in 2010.What are the null and alternative hypotheses?
A)
B)
C)
D)
E)
A)
B)
C)
D)
E)
Question
At a local university,only 62% of the original freshman class graduated in four years.Has this percentage changed?
A)
B)
C)
D)
E)
A)
B)
C)
D)
E)
Question
Question
A university wants to increase its retention rate of 4% for graduating students from the previous year.After implementing several new programs during the last two years,the university reevaluated its retention rate using a random sample of 352 students and found the retention rate at 5%.Test an appropriate hypothesis and state your conclusion.Be sure the appropriate assumptions and conditions are satisfied before you proceed.
A)

: p = 0.04;

: p > 0.04;z = 0.96;P-value = 0.1685.This data shows virtually no evidence that more than 4% of students are retained;the university should not continue with the new programs.
B)

: p = 0.04;

: p < 0.04;z = 1.07;P-value = 0.8577.This data shows conclusive evidence that more than 4% of students are retained;therefore,the university should continue with the new programs.
C)

: p = 0.04;

: p < 0.04;z = -1.07;P-value = 0.8577.This data shows conclusive evidence that more than 4% of students are retained;the university should continue with the new programs.
D)

: p = 0.04;

: p > 0.04;z = -1.07;P-value = 0.1423.This data does not show that more than 4% of students are retained;the university should not continue with the new programs.
E)

: p = 0.04;

: p ≠ 0.04;z = 1.07;P-value = 0.2846.This data shows virtually no evidence that more than 4% of students are retained;the university should not continue with the new programs.
A)
: p = 0.04;
: p > 0.04;z = 0.96;P-value = 0.1685.This data shows virtually no evidence that more than 4% of students are retained;the university should not continue with the new programs.
B)
: p = 0.04;
: p < 0.04;z = 1.07;P-value = 0.8577.This data shows conclusive evidence that more than 4% of students are retained;therefore,the university should continue with the new programs.
C)
: p = 0.04;
: p < 0.04;z = -1.07;P-value = 0.8577.This data shows conclusive evidence that more than 4% of students are retained;the university should continue with the new programs.
D)
: p = 0.04;
: p > 0.04;z = -1.07;P-value = 0.1423.This data does not show that more than 4% of students are retained;the university should not continue with the new programs.
E)
: p = 0.04;
: p ≠ 0.04;z = 1.07;P-value = 0.2846.This data shows virtually no evidence that more than 4% of students are retained;the university should not continue with the new programs.
Question
Five years ago,a company found that 8% of its employees commuted to work by car.A survey investigates whether the current proportion of employees who commute by car to work is higher than it was five years ago.A test on employee commuting by car was done on a random sample of 1000 employees,and found car commuting to be 12%.Test an appropriate hypothesis and state your conclusion.Be sure the appropriate assumptions and conditions are satisfied before you proceed.
A)

: p = 0.08;

: p > 0.08;z = 4.66;P-value < 0.00001.This data shows conclusive evidence that the proportion in car commuting is greater than 8%.
B)

: p = 0.08;

: p > 0.08;z = -4.66;P-value > 0.00001.This data shows conclusive evidence that the proportion in car commuting is greater than 8%.
C)

: p = 0.08;

: p ≠ 0.08;z = 4.66;P-value < 0.99999.This data shows no evidence that the proportion in car commuting is greater than 8%.
D)

: p = 0.08;

: p < 0.08;z = 4.66;P-value < 0.99999.This data shows no evidence that the proportion in car commuting is greater than 8%.
E)

: p = 0.08;

: p < 0.08;z = -4.66;P-value > 0.99999.This data shows no evidence that the proportion in car commuting is greater than 8%.
A)
: p = 0.08;
: p > 0.08;z = 4.66;P-value < 0.00001.This data shows conclusive evidence that the proportion in car commuting is greater than 8%.
B)
: p = 0.08;
: p > 0.08;z = -4.66;P-value > 0.00001.This data shows conclusive evidence that the proportion in car commuting is greater than 8%.
C)
: p = 0.08;
: p ≠ 0.08;z = 4.66;P-value < 0.99999.This data shows no evidence that the proportion in car commuting is greater than 8%.
D)
: p = 0.08;
: p < 0.08;z = 4.66;P-value < 0.99999.This data shows no evidence that the proportion in car commuting is greater than 8%.
E)
: p = 0.08;
: p < 0.08;z = -4.66;P-value > 0.99999.This data shows no evidence that the proportion in car commuting is greater than 8%.
Question
A weight loss centre provided a loss for 72% of its participants.The centre's leader decides to test a new weight loss strategy on a random sample size of 140 and found weight loss in 78% of the participants.Test an appropriate hypothesis and state your conclusion.Be sure the appropriate assumptions and conditions are satisfied before you proceed.
A)

: p = 0.72;

: p ≠ 0.72;z = 1.58;P-value = 0.1236.This data shows weak evidence of a weight loss in more than 72% of the participants in the weight loss strategy;the manager should not continue with this strategy.
B)

: p = 0.72;

: p > 0.72;z = 1.58;P-value = 0.0571.This data shows moderate evidence of a weight loss in more than 72% of the participants in the weight loss strategy;it is hard to say whether or not they should use this strategy,perhaps further testing is in order.
C)

: p = 0.72;

: p > 0.72;z = -1.58;P-value = 0.0618.This data shows weak evidence of a weight loss in more than 72% of the participants in the weight loss strategy;the manager should change strategies.
D)

: p = 0.72;

: p < 0.72;z = -1.58;P-value = 0.9382.This data shows conclusive evidence of a weight loss in more than 72% of the participants in the weight loss strategy;the manager should continue with this strategy.
E)

: p = 0.72;

: p < 0.72;z = 1.58;P-value = 0.9382.This data shows conclusive evidence of a weight loss in more than 72% of the participants in the weight loss strategy;the manager should continue with this strategy.
A)
: p = 0.72;
: p ≠ 0.72;z = 1.58;P-value = 0.1236.This data shows weak evidence of a weight loss in more than 72% of the participants in the weight loss strategy;the manager should not continue with this strategy.
B)
: p = 0.72;
: p > 0.72;z = 1.58;P-value = 0.0571.This data shows moderate evidence of a weight loss in more than 72% of the participants in the weight loss strategy;it is hard to say whether or not they should use this strategy,perhaps further testing is in order.
C)
: p = 0.72;
: p > 0.72;z = -1.58;P-value = 0.0618.This data shows weak evidence of a weight loss in more than 72% of the participants in the weight loss strategy;the manager should change strategies.
D)
: p = 0.72;
: p < 0.72;z = -1.58;P-value = 0.9382.This data shows conclusive evidence of a weight loss in more than 72% of the participants in the weight loss strategy;the manager should continue with this strategy.
E)
: p = 0.72;
: p < 0.72;z = 1.58;P-value = 0.9382.This data shows conclusive evidence of a weight loss in more than 72% of the participants in the weight loss strategy;the manager should continue with this strategy.
Question
Question
Question
Question
A city claims that 75% of all low income housing is 1500 sq.ft.The tenants believe the proportion of housing this size is smaller than the claim,and hire an independent firm to test a random sample size of 120 and found 1500 sq.ft.housing at 66%.Test an appropriate hypothesis and state your conclusion.Be sure the appropriate assumptions and conditions are satisfied before you proceed.
A)

: p = 0.75;

: p ≠ 0.75;z = -2.32;P-value = 0.0204.This data shows strong evidence that the proportion of 1500 sq.ft.housing is less than 75%
B)

: p = 0.75;

: p < 0.075 z = 2.28;P-value = 0.0113.This data shows weak evidence that the proportion of 1500 sq.ft.housing is less than 75%
C)

: p = 0.75;

: p > 0.75;z = -2.32;P-value = 0.9898.This data shows no evidence that the proportion of 1500 sq.ft.housing is less than 75%
D)

: p = 0.75;

: p > 0.75;z = 2.32;P-value = 0.9898.This data shows strong evidence that the proportion of 1500 sq.ft.housing is less than 75%
E)

: p = 0.75;

: p < 0.75;z = -2.28;P-value = 0.0113.This data shows strong evidence that the proportion of 1500 sq.ft.housing is less than 75%
A)
: p = 0.75;
: p ≠ 0.75;z = -2.32;P-value = 0.0204.This data shows strong evidence that the proportion of 1500 sq.ft.housing is less than 75%
B)
: p = 0.75;
: p < 0.075 z = 2.28;P-value = 0.0113.This data shows weak evidence that the proportion of 1500 sq.ft.housing is less than 75%
C)
: p = 0.75;
: p > 0.75;z = -2.32;P-value = 0.9898.This data shows no evidence that the proportion of 1500 sq.ft.housing is less than 75%
D)
: p = 0.75;
: p > 0.75;z = 2.32;P-value = 0.9898.This data shows strong evidence that the proportion of 1500 sq.ft.housing is less than 75%
E)
: p = 0.75;
: p < 0.75;z = -2.28;P-value = 0.0113.This data shows strong evidence that the proportion of 1500 sq.ft.housing is less than 75%
Question
Question
Question
Question
Question
In April of 2011,the unemployment rate in Canada was reported to be 7.6%.Suppose that Statistics Canada claims that the current unemployment rate is lower than that of April 2011.Suppose a test was conducted on current unemployment and a random sample size of 1000 and found unemployment at 6.1%.Test an appropriate hypothesis and state your conclusion.Be sure the appropriate assumptions and conditions are satisfied before you proceed.
A)

: p = 0.076;

: p > 0.076;z = -1.79;P-value = 0.9633.This data shows no evidence that the unemployment rate has decreased since April of 2011.
B)

: p = 0.076;

: p < 0.076;z = 1.79;P-value = 0.0367.This data shows very weak evidence that the unemployment rate has decreased since April of 2011.
C)

: p = 0.076;

: p ≠ 0.076;z = -1.79;P-value = 0.0734.This data shows moderate evidence that the unemployment rate has decreased since April of 2011.
D)

: p = 0.076;

: p < 0.076;z = -1.79;P-value = 0.0367.This data shows strong evidence that the unemployment rate has decreased since April of 2011.
E)

: p = 0.076;

: p > 0.076;z = 1.79;P-value = 0.9633.This data shows strong evidence that the unemployment rate has decreased since April of 2011.
A)
: p = 0.076;
: p > 0.076;z = -1.79;P-value = 0.9633.This data shows no evidence that the unemployment rate has decreased since April of 2011.
B)
: p = 0.076;
: p < 0.076;z = 1.79;P-value = 0.0367.This data shows very weak evidence that the unemployment rate has decreased since April of 2011.
C)
: p = 0.076;
: p ≠ 0.076;z = -1.79;P-value = 0.0734.This data shows moderate evidence that the unemployment rate has decreased since April of 2011.
D)
: p = 0.076;
: p < 0.076;z = -1.79;P-value = 0.0367.This data shows strong evidence that the unemployment rate has decreased since April of 2011.
E)
: p = 0.076;
: p > 0.076;z = 1.79;P-value = 0.9633.This data shows strong evidence that the unemployment rate has decreased since April of 2011.
Question
Question
Question
Question
Question
Question
According to the 2004 Canadian Community Health Survey,23.1% of Canadians aged 18 or older were considered obese;that is,they had a body mass index (BMI)of 30 more higher.Suppose you believe that the percentage of obese Canadians has increased since 2004 and wish to test your belief.A current survey of 1000 random Canadians found that 245 were obese.Test an appropriate hypothesis and state your conclusion.Be sure the appropriate assumptions and conditions are satisfied before you proceed.
A)

: p = 0.231;

: p < 0.231;z = -1.05;P-value = 0.1469.This data shows strong evidence of an increase from the 23.1% of obese Canadians.
B)

: p = 0.231;

: p < 0.231;z = -1.05;P-value = 0.8531.This data shows strong evidence of an increase from the 23.1% of obese Canadians.
C)

: p = 0.231;

: p > 0.231;z = 1.05;P-value = 0.1469.This data shows virtually no evidence of an increase from the 23.1% of obese Canadians.
D)

: p = 0.231;

: p > 0.231;z = -1.05;P-value = 0.0594.This data shows virtually no evidence of an increase from the 23.1% of obese Canadians.
E)

: p = 0.231;

: p > 0.231;z = 1.05;P-value = 0.8531.This data shows virtually no evidence of an increase from the 23.1% of obese Canadians.
A)
: p = 0.231;
: p < 0.231;z = -1.05;P-value = 0.1469.This data shows strong evidence of an increase from the 23.1% of obese Canadians.
B)
: p = 0.231;
: p < 0.231;z = -1.05;P-value = 0.8531.This data shows strong evidence of an increase from the 23.1% of obese Canadians.
C)
: p = 0.231;
: p > 0.231;z = 1.05;P-value = 0.1469.This data shows virtually no evidence of an increase from the 23.1% of obese Canadians.
D)
: p = 0.231;
: p > 0.231;z = -1.05;P-value = 0.0594.This data shows virtually no evidence of an increase from the 23.1% of obese Canadians.
E)
: p = 0.231;
: p > 0.231;z = 1.05;P-value = 0.8531.This data shows virtually no evidence of an increase from the 23.1% of obese Canadians.
Question
Question
Question
You are considering moving to Richmond Hill and are concerned about the average one-way commute time to downtown Toronto.Does the average one-way commute time exceed 25 minutes? You take a random sample of 100 Richmond Hill residents and find an average commute time of 29 minutes with a standard deviation of 7 minutes.
A)
B)
C)
D)
E)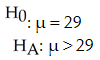
A)
B)
C)
D)
E)
Question
You want to see if the number of minutes cell phone users use each month has changed from its mean of 120 minutes 2 years ago.You take a random sample of 100 cell phone users and find an average of 135 minutes used.
A)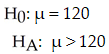
B)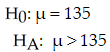
C)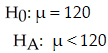
D)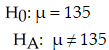
E)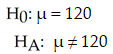
A)
B)
C)
D)
E)
Question
Question
Question
Suzie has installed a new spam blocker program on her email.She used to receive an average of 20 spam emails a day.Is the new program working?
A)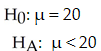
B)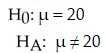
C)
D)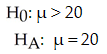
E) Not enough information is given.
A)
B)
C)
D)
E) Not enough information is given.
Question
Question
Question
Has the introduction of more music download services changed the number of university students downloading music online without paying for it? Two years ago,approximately 50,000 college students admitted to downloading music online without paying for it.
A)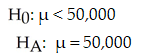
B)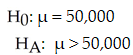
C)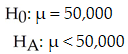
D)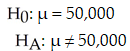
E)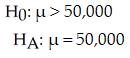
A)
B)
C)
D)
E)
Question
Question
Are Canadians getting fatter? Researchers interested in this question take a random sample of 500 people and record an average weight of 86 kg.Ten years ago,the average weight was 83 kg.
A)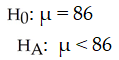
B)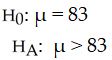
C)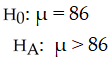
D)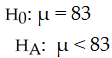
E)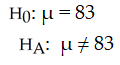
A)
B)
C)
D)
E)

Unlock Deck
Sign up to unlock the cards in this deck!
Unlock Deck
Unlock Deck
1/50
Play
Full screen (f)
Deck 19: Testing Hypotheses About Proportions
1
After a political ad campaign for a city's mayor,pollsters check the disapproval ratings.They test the hypothesis that the ads produced no change against the alternative that the ratings are now below 19%,and find a P-value of 0.17.Provide an appropriate conclusion.
There's a 17% chance that poll results could be just natural sampling variation rather than a real change in public opinion.
2
The seller of a loaded die claims that it will favor the outcome 6.We don't believe that claim,and roll the die 350 times to test an appropriate hypothesis.Our P-value turns out to be 0.01.Provide an appropriate conclusion.
There's a 1% chance that a fair die could randomly produce the results we observed,so there is strong evidence to conclude that the die is loaded.
3
In April of 2011,the unemployment rate in Canada was reported to be 7.6%.Suppose we claim that the current unemployment rate differs from the April 2011 unemployment rate.If we wish to support our claim,what are the null and alternative hypotheses?
A)
B)
C)
D)
E)
A)
B)
C)
D)
E)
4
A weight loss program provided a loss for 60% of its participants.The program leader decides to test a new weight loss strategy to see if it's better and gets a P-value of 0.21.Is it reasonable to conclude that the new strategy and the old one are equally effective?
Unlock Deck
Unlock for access to all 50 flashcards in this deck.
Unlock Deck
k this deck
5
The management of a water park has concerns about the chlorine level of 0.4% mg/mL increasing to an unsafe level.The management tests the hypothesis that the park's chlorine proportions have remained the same,and find a P-value of 0.005.Provide an appropriate conclusion
A)There is a 99.5% chance of no change in the chlorine proportion.
B)We can say there is a 0.5% chance of seeing a change in the chlorine proportions in the results we observed from natural sampling variation.We conclude the chlorine proportion is higher.
C)There is a 0.5% chance of no change in the chlorine proportion.
D)If the chlorine level is 0.4% mg/mL,then there is a 0.5% chance of seeing a sample chlorine level as high (or higher)than what we observed from natural sampling variation.There is no evidence of a higher chlorine proportion,but we cannot conclude the chlorine proportion is the same.
E)If the chlorine level is 0.4% mg/mL,then there is a 0.5% chance of seeing a sample chlorine level as high (or higher)than what we observed from natural sampling variation.There is very strong evidence the chlorine proportion is higher.
Unlock Deck
Unlock for access to all 50 flashcards in this deck.
Unlock Deck
k this deck
6
According to the 2004 Canadian Community Health Survey,23.1% of Canadians aged 18 or older were considered obese;that is,they had a body mass index (BMI)of 30 more higher.Suppose you believe that the percentage of obese Canadians has increased since 2004 and wish to test your belief.You hire an independent agency to conduct a hypothesis test and they come up with a P-value of 0.028.What is reasonable to conclude?
A)If the percentage of obese Canadians has not changed,then there is a 2.8% chance of seeing the increase in the percentage of obese Canadians that we observed (or higher)from natural sampling variation.There is no evidence the percentage of obese Canadians has increased since 2004,but we cannot conclude the percentage hasn't increased.
B)There is a 97.2% chance that the percentage of obese Canadians has increased since 2004.
C)There is a 2.8% chance that the percentage of obese Canadians has increased since 2004.
D)If the percentage of obese Canadians has not changed,then there is a 2.8% chance of seeing the increase in the percentage of obese Canadians that we observed (or higher)from natural sampling variation.There is strong evidence that the percentage of obese Canadians has increased since 2004.
E)We can say there is a 2.8% chance that the percentage of obese Canadians has increased in the results we observed from natural sampling variation.We conclude that the percentage of obese Canadians has not increased since 2004.
Unlock Deck
Unlock for access to all 50 flashcards in this deck.
Unlock Deck
k this deck
7
In April of 2011,the unemployment rate in Canada was reported to be 7.6%.Suppose we claim that the current unemployment rate differs from the April 2011 unemployment rate.Statistics Canada claims that the current unemployment rate is lower than that of April 2011.To test this claim,a hypothesis test is conducted and yields a P-value turns out to be 0.04.Provide an appropriate conclusion.
A)If the current unemployment rate is 7.6%,there there is a 4% chance of seeing a sample unemployment rate as low (or lower)than what we observed from natural sampling variation.There is no evidence of that the unemployment rate decreased,but we can not conclude there is no change in the unemployment rate.
B)There is a 4% chance of no change in the unemployment rate.
C)There is a 96% chance of no change in the unemployment rate.
D)We can say there is a 4% chance of seeing a change in the unemployment rate in the results we observed from natural sampling variation.We conclude the Statistics Canada is correct and the unemployment rate has decreased.
E)If the current unemployment rate is 7.6%,there there is a 4% chance of seeing a sample unemployment rate as low (or lower)than what we observed from natural sampling variation.There is strong evidence that Statistics Canada is correct and the unemployment rate has decreased.
Unlock Deck
Unlock for access to all 50 flashcards in this deck.
Unlock Deck
k this deck
8
4% of trucks of a certain model have needed new engines after being driven between 0 and 100 kilometres.The manufacturer hopes that the redesign of one of the engine's components has solved this problem.
A)
B)
C)
D)
E)
A)
B)
C)
D)
E)
Unlock Deck
Unlock for access to all 50 flashcards in this deck.
Unlock Deck
k this deck
9
A weight loss centre provided a loss for 72% of its participants.The centre's leader decides to test a new weight loss strategy to see if it's better.What are the null and alternative hypotheses?
A)
B)
C)
D)
E)
A)
B)
C)
D)
E)
Unlock Deck
Unlock for access to all 50 flashcards in this deck.
Unlock Deck
k this deck
10
A city claims that 75% of all low income housing is 1500 sq.ft.The tenants believe the proportion of housing this size is smaller than the claim,and hire an independent firm to test an appropriate hypothesis.What are the null and alternative hypotheses?
A)
B)
C)
D)
E)
A)
B)
C)
D)
E)
Unlock Deck
Unlock for access to all 50 flashcards in this deck.
Unlock Deck
k this deck
11
A survey investigation whether the proportion of employees who commute by car to work is higher than it was five years ago finds a P-value of 0.009.Is it reasonable to conclude that more employees are commuting by car?
Unlock Deck
Unlock for access to all 50 flashcards in this deck.
Unlock Deck
k this deck
12
According to the 2004 Canadian Community Health Survey,23.1% of Canadians aged 18 or older were considered obese;that is,they had a body mass index (BMI)of 30 more higher.Suppose you believe that the percentage of obese Canadians has increased since 2004 and wish to test your belief.What are the null and alternative hypotheses?
A)
B)
C)
D)
E)
A)
B)
C)
D)
E)
Unlock Deck
Unlock for access to all 50 flashcards in this deck.
Unlock Deck
k this deck
13
A mayor is concerned about the percentage of city residents who express disapproval of his job performance.His political committee pays for a newspaper ad,hoping that it will keep the disapproval rate below 21%.They will use a follow-up poll to assess the ad's effectiveness.
A)
B)
C)
D)
E)
A)
B)
C)
D)
E)
Unlock Deck
Unlock for access to all 50 flashcards in this deck.
Unlock Deck
k this deck
14
A new manager,hired at a large warehouse,was told to reduce the 26% employee sick leave.The manager introduced a new incentive program for employees with perfect attendance.The manager decides to test the new program to see if it's better.What are the null and alternative hypotheses?
A)
B)
C)
D)
E)
A)
B)
C)
D)
E)
Unlock Deck
Unlock for access to all 50 flashcards in this deck.
Unlock Deck
k this deck
15
A university wants to increase its retention rate of 4% for graduating students from the previous year.After implementing several new programs during the last two years,the university reevaluates its retention rate and comes up with a P-value of 0.075.What is reasonable to conclude about the new programs?
A)There is a 7.5% chance of the new programs having no effect on retention.
B)If the new programs have no effect on the retention rate,then there is a 7.5% chance of seeing the increase in the retention rate that we observed (or higher)from natural sampling variation.We conclude the new programs are more effective.
C)If the new programs have no effect on the retention rate,then there is a 7.5% chance of seeing the increase in the retention rate that we observed (or higher)from natural sampling variation.There is suggestive but inconclusive evidence the new programs are more effective,but we cannot conclude the new programs have no effect on retention.
D)We can say there is a 7.5% chance of seeing the new programs having an effect on retention in the results we observed from natural sampling variation.We conclude the new programs are more effective.
E)There is a 92.5% chance of the new programs having no effect on retention.
Unlock Deck
Unlock for access to all 50 flashcards in this deck.
Unlock Deck
k this deck
16
A new manager,hired at a large warehouse,was told to reduce the 26% employee sick leave.The manager introduced a new incentive program for employees with perfect attendance.The manager decides to test the new program to see if it's better and receives a P-value of 0.06.What is reasonable to conclude about the new strategy?
A)There is a 94% chance of the new program having no effect on employee attendance.
B)If the sick leave percentage has not changed,then there is a 6% chance of seeing the decrease in the sick leave percentage we observed (or lower)from natural sampling variation.We can conclude the new program is more effective.
C)There is a 6% chance of the new program having no effect on employee attendance.
D)We can say there is a 6% chance of seeing the new program having no effect on employee attendance in the results we observed from natural sampling variation.We conclude the new program is more effective.
E)If the sick leave percentage has not changed,then there is a 6% chance of seeing the decrease in the sick leave percentage we observed (or lower)from natural sampling variation.There is moderate evidence the new program is more effective,but we cannot conclude the program has no effect on employee attendance.
Unlock Deck
Unlock for access to all 50 flashcards in this deck.
Unlock Deck
k this deck
17
Health Canada reports that,in 2005,85% of Canadians were satisfied with the health care services they received.Suppose you are now concerned that a smaller percentage of Canadians are satisfied with the health care services they received.If you want to justify your concerns,what are the null and alternative hypotheses?
A)
B)
C)
D)
E)
A)
B)
C)
D)
E)
Unlock Deck
Unlock for access to all 50 flashcards in this deck.
Unlock Deck
k this deck
18
In 2010,the proportion of employees at a large company who commuted to work by car was 8%.A current survey investigates whether the proportion of employees who commute by car to work is higher than it was in 2010.What are the null and alternative hypotheses?
A)
B)
C)
D)
E)
A)
B)
C)
D)
E)
Unlock Deck
Unlock for access to all 50 flashcards in this deck.
Unlock Deck
k this deck
19
At a local university,only 62% of the original freshman class graduated in four years.Has this percentage changed?
A)
B)
C)
D)
E)
A)
B)
C)
D)
E)
Unlock Deck
Unlock for access to all 50 flashcards in this deck.
Unlock Deck
k this deck
20
A city claims that 75% of all low income housing is 1500 sq.ft.The tenants believe the proportion of housing this size is smaller than the claim,and hire an independent firm to test an appropriate hypothesis.The P-value turns out to be 0.025.Provide an appropriate conclusion.
A)There is a 2.5% chance of no change in the proportion of housing that is 1500 sq.ft.
B)There is a 97.5% chance of no change in the proportion of housing that is 1500 sq.ft.
C)We can say there is a 2.5% chance of seeing a change in the proportion of housing that is 1500 sq.ft.in the results we observed from natural sampling variation.We conclude the tenants are correct and that the proportion of housing with 1500 square feet is less than 75%.
D)If 75% of all low income housing is 1500 sq.ft. ,then there is a 2.5% chance of seeing a sample proportion of such houses as low (or lower)than what we we observed from natural sampling variation.There is no evidence of that the proportion of housing is smaller than 1500 sq.ft. ,but we can not conclude there is no change in the proportion of housing that is 1500 sq.ft.
E)If 75% of all low income housing is 1500 sq.ft. ,then there is a 2.5% chance of seeing a sample proportion of such houses as low (or lower)than what we we observed from natural sampling variation.There is strong evidence the tenants are correct and that the proportion of housing with 1500 square feet is less than 75%.
Unlock Deck
Unlock for access to all 50 flashcards in this deck.
Unlock Deck
k this deck
21
A university wants to increase its retention rate of 4% for graduating students from the previous year.After implementing several new programs during the last two years,the university reevaluated its retention rate using a random sample of 352 students and found the retention rate at 5%.Test an appropriate hypothesis and state your conclusion.Be sure the appropriate assumptions and conditions are satisfied before you proceed.
A)
: p = 0.04;
: p > 0.04;z = 0.96;P-value = 0.1685.This data shows virtually no evidence that more than 4% of students are retained;the university should not continue with the new programs.
B)
: p = 0.04;
: p < 0.04;z = 1.07;P-value = 0.8577.This data shows conclusive evidence that more than 4% of students are retained;therefore,the university should continue with the new programs.
C)
: p = 0.04;
: p < 0.04;z = -1.07;P-value = 0.8577.This data shows conclusive evidence that more than 4% of students are retained;the university should continue with the new programs.
D)
: p = 0.04;
: p > 0.04;z = -1.07;P-value = 0.1423.This data does not show that more than 4% of students are retained;the university should not continue with the new programs.
E)
: p = 0.04;
: p ≠ 0.04;z = 1.07;P-value = 0.2846.This data shows virtually no evidence that more than 4% of students are retained;the university should not continue with the new programs.
Unlock Deck
Unlock for access to all 50 flashcards in this deck.
Unlock Deck
k this deck
22
Five years ago,a company found that 8% of its employees commuted to work by car.A survey investigates whether the current proportion of employees who commute by car to work is higher than it was five years ago.A test on employee commuting by car was done on a random sample of 1000 employees,and found car commuting to be 12%.Test an appropriate hypothesis and state your conclusion.Be sure the appropriate assumptions and conditions are satisfied before you proceed.
A)
: p = 0.08;
: p > 0.08;z = 4.66;P-value < 0.00001.This data shows conclusive evidence that the proportion in car commuting is greater than 8%.
B)
: p = 0.08;
: p > 0.08;z = -4.66;P-value > 0.00001.This data shows conclusive evidence that the proportion in car commuting is greater than 8%.
C)
: p = 0.08;
: p ≠ 0.08;z = 4.66;P-value < 0.99999.This data shows no evidence that the proportion in car commuting is greater than 8%.
D)
: p = 0.08;
: p < 0.08;z = 4.66;P-value < 0.99999.This data shows no evidence that the proportion in car commuting is greater than 8%.
E)
: p = 0.08;
: p < 0.08;z = -4.66;P-value > 0.99999.This data shows no evidence that the proportion in car commuting is greater than 8%.
Unlock Deck
Unlock for access to all 50 flashcards in this deck.
Unlock Deck
k this deck
23
A weight loss centre provided a loss for 72% of its participants.The centre's leader decides to test a new weight loss strategy on a random sample size of 140 and found weight loss in 78% of the participants.Test an appropriate hypothesis and state your conclusion.Be sure the appropriate assumptions and conditions are satisfied before you proceed.
A)
: p = 0.72;
: p ≠ 0.72;z = 1.58;P-value = 0.1236.This data shows weak evidence of a weight loss in more than 72% of the participants in the weight loss strategy;the manager should not continue with this strategy.
B)
: p = 0.72;
: p > 0.72;z = 1.58;P-value = 0.0571.This data shows moderate evidence of a weight loss in more than 72% of the participants in the weight loss strategy;it is hard to say whether or not they should use this strategy,perhaps further testing is in order.
C)
: p = 0.72;
: p > 0.72;z = -1.58;P-value = 0.0618.This data shows weak evidence of a weight loss in more than 72% of the participants in the weight loss strategy;the manager should change strategies.
D)
: p = 0.72;
: p < 0.72;z = -1.58;P-value = 0.9382.This data shows conclusive evidence of a weight loss in more than 72% of the participants in the weight loss strategy;the manager should continue with this strategy.
E)
: p = 0.72;
: p < 0.72;z = 1.58;P-value = 0.9382.This data shows conclusive evidence of a weight loss in more than 72% of the participants in the weight loss strategy;the manager should continue with this strategy.
Unlock Deck
Unlock for access to all 50 flashcards in this deck.
Unlock Deck
k this deck
24
A company hopes to improve its engines,setting a goal of no more than 3% of customers using their warranty on defective engine parts.A random survey of 1200 customers found only 20 with complaints.Create a 95% confidence interval for the true level of warranty users among all customers.
A)Based on the data,we are 95% confident the proportion of warranty users is between 0% and 2.4%.Therefore,the company has met its goal.
B)Based on the data,we are 95% confident the proportion of warranty users is between 1% and 3%.Therefore,the company has met its goal.
C)Based on the data,we are 95% confident the proportion of warranty users is between 0.9% and 3.8%.Therefore,the company has not met its goal.
D)Based on the data,we are 95% confident the proportion of warranty users is between 2.0% and 2.4%.Therefore,the company has met its goal.
E)Based on the data,we are 95% confident the proportion of warranty users is between 0.9% and 2.4%.Therefore,the company has met its goal.
Unlock Deck
Unlock for access to all 50 flashcards in this deck.
Unlock Deck
k this deck
25
The management of a water park has concerns about the chlorine level of 0.4% mg/mL increasing to an unsafe level.The management tests the hypothesis that the park's chlorine proportions have remained the same.An independent agency ran a test on a random sample size of 10000 and found the chlorine level at 0.5% mg/mL.Create a 95% confidence interval for the proportion of chlorine in the water.
A)Based on the data,we are 95% confident the proportion of chlorine in the water is between 0.102% and 0.898%.
B)Based on the data,we are 95% confident the proportion of chlorine in the water is between 0.109% and 0.891%.
C)Based on the data,we are 95% confident the proportion of chlorine in the water is between 0.362% and 0.638%.
D)Based on the data,we are 95% confident the proportion of chlorine in the water is between 0.009% and 0.891%.
E)Based on the data,we are 95% confident the proportion of chlorine in the water is between 0.4% and 0.6%.
Unlock Deck
Unlock for access to all 50 flashcards in this deck.
Unlock Deck
k this deck
26
In April of 2011,the unemployment rate in Canada was reported to be 7.6%.Suppose that Statistics Canada claims that the current unemployment rate is lower than that of April 2011.Suppose a test was conducted on current unemployment and a random sample size of 1000 and found unemployment at 3.8%.Create a 95% confidence interval for the proportion of unemployment.
A)Based on the data,we are 95% confident the proportion of unemployment is between 3.82% and 6.58%.
B)Based on the data,we are 95% confident the proportion of unemployment is between 2.61% and 4.99%.
C)Based on the data,we are 95% confident the proportion of unemployment is between 0% and 8.73%.
D)Based on the data,we are 95% confident the proportion of unemployment is between 2.4% and 5.2%.
E)Based on the data,we are 95% confident the proportion of unemployment is between 3.82% and 5.18%.
Unlock Deck
Unlock for access to all 50 flashcards in this deck.
Unlock Deck
k this deck
27
A city claims that 75% of all low income housing is 1500 sq.ft.The tenants believe the proportion of housing this size is smaller than the claim,and hire an independent firm to test a random sample size of 120 and found 1500 sq.ft.housing at 66%.Test an appropriate hypothesis and state your conclusion.Be sure the appropriate assumptions and conditions are satisfied before you proceed.
A)
: p = 0.75;
: p ≠ 0.75;z = -2.32;P-value = 0.0204.This data shows strong evidence that the proportion of 1500 sq.ft.housing is less than 75%
B)
: p = 0.75;
: p < 0.075 z = 2.28;P-value = 0.0113.This data shows weak evidence that the proportion of 1500 sq.ft.housing is less than 75%
C)
: p = 0.75;
: p > 0.75;z = -2.32;P-value = 0.9898.This data shows no evidence that the proportion of 1500 sq.ft.housing is less than 75%
D)
: p = 0.75;
: p > 0.75;z = 2.32;P-value = 0.9898.This data shows strong evidence that the proportion of 1500 sq.ft.housing is less than 75%
E)
: p = 0.75;
: p < 0.75;z = -2.28;P-value = 0.0113.This data shows strong evidence that the proportion of 1500 sq.ft.housing is less than 75%
Unlock Deck
Unlock for access to all 50 flashcards in this deck.
Unlock Deck
k this deck
28
An airline's public relations department says that the airline rarely loses passengers' luggage.It further claims that on those occasions when luggage is lost,92% is recovered and delivered to its owner within 24 hours.A consumer group who surveyed a large number of air travelers found that only 145 out of 165 people who lost luggage on that airline were reunited with the missing items by the next day.Does this cast doubt on the airline's claim? Use a calculator to find z-scores and P-values.
Unlock Deck
Unlock for access to all 50 flashcards in this deck.
Unlock Deck
k this deck
29
A newspaper is considering the launch of an online edition.The newspaper plans to go ahead only if it's convinced that more than 35% of current readers would subscribe.The newspaper contacts a simple random sample of 1000 current subscribers,and 345 of those surveyed expressed interest.What should the company do? Test an appropriate hypothesis and state your conclusion.Be sure the appropriate assumptions and conditions are satisfied before you proceed.Use a calculator to find z-scores and P-values.
Unlock Deck
Unlock for access to all 50 flashcards in this deck.
Unlock Deck
k this deck
30
According to the 2004 Canadian Community Health Survey,23.1% of Canadians aged 18 or older were considered obese;that is,they had a body mass index (BMI)of 30 more higher.Suppose a current survey of 1000 random Canadians found that 245 were obese.Create a 95% confidence interval for the proportion of Canadians that are currently obese.
A)Based on the data,we are 95% confident the current proportion of obese Canadians is between 22% and 24%.
B)Based on the data,we are 95% confident the current proportion of obese Canadians is between 17.97% and 26.03%.
C)Based on the data,we are 95% confident the current proportion of obese Canadians is between 17.97% and 27.03%.
D)Based on the data,we are 95% confident the current proportion of obese Canadians is between 21.8% and 27.2%.
E)Based on the data,we are 95% confident the current proportion of obese Canadians is between 22.44% and 26.56%.
Unlock Deck
Unlock for access to all 50 flashcards in this deck.
Unlock Deck
k this deck
31
A new manager,hired at a large warehouse,was told to reduce the 26% employee sick leave.The manager introduced a new incentive program for employees with perfect attendance.The manager decides to test the new program on a random sample size of 60 and found sick leave at 23%.Create a 95% confidence interval for the proportion of employee sick leave.
A)Based on the data,we are 95% confident the proportion of employee sick leave is between 14.9% and 37.1%.
B)Based on the data,we are 95% confident the proportion of employee sick leave is between 3.76% and 42.24%.
C)Based on the data,we are 95% confident the proportion of employee sick leave is between 14.9% and 34.1%.
D)Based on the data,we are 95% confident the proportion of employee sick leave is between 20% and 26%.
E)Based on the data,we are 95% confident the proportion of employee sick leave is between 12.4% and 33.6%.
Unlock Deck
Unlock for access to all 50 flashcards in this deck.
Unlock Deck
k this deck
32
In April of 2011,the unemployment rate in Canada was reported to be 7.6%.Suppose that Statistics Canada claims that the current unemployment rate is lower than that of April 2011.Suppose a test was conducted on current unemployment and a random sample size of 1000 and found unemployment at 6.1%.Test an appropriate hypothesis and state your conclusion.Be sure the appropriate assumptions and conditions are satisfied before you proceed.
A)
: p = 0.076;
: p > 0.076;z = -1.79;P-value = 0.9633.This data shows no evidence that the unemployment rate has decreased since April of 2011.
B)
: p = 0.076;
: p < 0.076;z = 1.79;P-value = 0.0367.This data shows very weak evidence that the unemployment rate has decreased since April of 2011.
C)
: p = 0.076;
: p ≠ 0.076;z = -1.79;P-value = 0.0734.This data shows moderate evidence that the unemployment rate has decreased since April of 2011.
D)
: p = 0.076;
: p < 0.076;z = -1.79;P-value = 0.0367.This data shows strong evidence that the unemployment rate has decreased since April of 2011.
E)
: p = 0.076;
: p > 0.076;z = 1.79;P-value = 0.9633.This data shows strong evidence that the unemployment rate has decreased since April of 2011.
Unlock Deck
Unlock for access to all 50 flashcards in this deck.
Unlock Deck
k this deck
33
A weight loss centre provided a loss for 72% of its participants.The centre's leader decides to test a new weight loss strategy on a random sample size of 140 and found weight loss in 78% of the participants.Create a 95% confidence interval for the proportion of participant weight loss.
A)Based on the data,we are 95% confident the proportion of participant weight loss is between 64.56% and 79.44%.
B)Based on the data,we are 95% confident the proportion of participant weight loss is between 64.56% and 85.44%.
C)Based on the data,we are 95% confident the proportion of participant weight loss is between 57.84% and 98.16%.
D)Based on the data,we are 95% confident the proportion of participant weight loss is between 72% and 84%.
E)Based on the data,we are 95% confident the proportion of participant weight loss is between 71.14% and 84.86%.
Unlock Deck
Unlock for access to all 50 flashcards in this deck.
Unlock Deck
k this deck
34
Five years ago,a company found that 8% of its employees commuted to work by car.A test for the current proportion of commuting employees was done on a random sample of 1000 employees,and found car commuting to be 12%.Create a 95% confidence interval for the proportion of employee commute by car.
A)Based on the data,we are 95% confident the proportion of employee commute by car is between 8% and 16%.
B)Based on the data,we are 95% confident the proportion of employee commute by car is between 4.64% and 19.36%.
C)Based on the data,we are 95% confident the proportion of employee commute by car is between 6.32% and 13.68%.
D)Based on the data,we are 95% confident the proportion of employee commute by car is between 9.99% and 14.01%.
E)Based on the data,we are 95% confident the proportion of employee commute by car is between 6.32% and 9.68%.
Unlock Deck
Unlock for access to all 50 flashcards in this deck.
Unlock Deck
k this deck
35
Census data for a certain city shows that 22% of residents are European.Suppose 94 people are called for jury duty,and only 15 of them are European.Does this call into question the fairness of the jury selection system? Use a calculator to find z-scores and P-values.
Unlock Deck
Unlock for access to all 50 flashcards in this deck.
Unlock Deck
k this deck
36
During the 2004 season,home teams in the same conference won 189 out of 302 regular season college basketball games.Test the home team advantage hypothesis and state your conclusion.Be sure the appropriate assumptions and conditions are satisfied before you proceed.
Unlock Deck
Unlock for access to all 50 flashcards in this deck.
Unlock Deck
k this deck
37
A university wants to increase its retention rate of 4% for graduating students from the previous year.After implementing several new programs during the last two years,in 2004 the university reevaluated its retention rate using a random sample of 352 students and found the retention rate at 5%.Create a 95% confidence interval for the proportion of students (in 2004)who had been retained.
A)Based on the data,we are 95% confident the proportion of students in 2004 who had been retained is between 1.95% and 7.05%.
B)Based on the data,we are 95% confident the proportion of students in 2004 who had been retained is between 4% and 6%.
C)Based on the data,we are 95% confident the proportion of students in 2004 who had been retained is between 1.16% and 8.84%.
D)Based on the data,we are 95% confident the proportion of students in 2004 who had been retained is between 2.72% and 7.28%.
E)Based on the data,we are 95% confident the proportion of students in 2004 who had been retained is between 1.95% and 6.05%.
Unlock Deck
Unlock for access to all 50 flashcards in this deck.
Unlock Deck
k this deck
38
According to the 2004 Canadian Community Health Survey,23.1% of Canadians aged 18 or older were considered obese;that is,they had a body mass index (BMI)of 30 more higher.Suppose you believe that the percentage of obese Canadians has increased since 2004 and wish to test your belief.A current survey of 1000 random Canadians found that 245 were obese.Test an appropriate hypothesis and state your conclusion.Be sure the appropriate assumptions and conditions are satisfied before you proceed.
A)
: p = 0.231;
: p < 0.231;z = -1.05;P-value = 0.1469.This data shows strong evidence of an increase from the 23.1% of obese Canadians.
B)
: p = 0.231;
: p < 0.231;z = -1.05;P-value = 0.8531.This data shows strong evidence of an increase from the 23.1% of obese Canadians.
C)
: p = 0.231;
: p > 0.231;z = 1.05;P-value = 0.1469.This data shows virtually no evidence of an increase from the 23.1% of obese Canadians.
D)
: p = 0.231;
: p > 0.231;z = -1.05;P-value = 0.0594.This data shows virtually no evidence of an increase from the 23.1% of obese Canadians.
E)
: p = 0.231;
: p > 0.231;z = 1.05;P-value = 0.8531.This data shows virtually no evidence of an increase from the 23.1% of obese Canadians.
Unlock Deck
Unlock for access to all 50 flashcards in this deck.
Unlock Deck
k this deck
39
Data in 1980 showed that about 42% of one country's population had never smoked cigarettes.In 2004,a national health survey in this country interviewed a random sample of 3000 adults and found that 51% had never been smokers.Create a 95% confidence interval for the proportion in 2004 of this country's adults who had never been smokers.
A)Based on the data,we are 95% confident the proportion of adults in 2004 who had never smoked cigarettes is between 49.2% and 52.8%.
B)Based on the data,we are 95% confident the proportion of adults in 2004 who had never smoked cigarettes is between 47.8% and 58.2%.
C)Based on the data,we are 95% confident the proportion of adults in 2004 who had never smoked cigarettes is between 49.2% and 63.2%.
D)Based on the data,we are 95% confident the proportion of adults in 2004 who had never smoked cigarettes is between 40% and 60%.
E)Based on the data,we are 95% confident the proportion of adults in 2004 who had never smoked cigarettes is between 37.4% and 52.8%.
Unlock Deck
Unlock for access to all 50 flashcards in this deck.
Unlock Deck
k this deck
40
A city claims that 75% of all low income housing is 1500 sq.ft.The tenants believe the proportion of housing this size is smaller than the claim,and hire an independent firm to test a random sample size of 120 and found 1500 sq.ft.housing at 66%.Create a 95% confidence interval for the proportion of housing 1500 sq.ft.
A)Based on the data,we are 95% confident the proportion of housing smaller than 1500 sq.ft.is between 57.52% and 74.48%.
B)Based on the data,we are 95% confident the proportion of housing smaller than 1500 sq.ft.is between 57% and 75%.
C)Based on the data,we are 95% confident the proportion of housing smaller than 1500 sq.ft.is between 67.25% and 82.75%.
D)Based on the data,we are 95% confident the proportion of housing smaller than 1500 sq.ft.is between 67.25% and 73.75%.
E)Based on the data,we are 95% confident the proportion of housing smaller than 1500 sq.ft.is between 47.25% and 84.75%.
Unlock Deck
Unlock for access to all 50 flashcards in this deck.
Unlock Deck
k this deck
41
You are considering moving to Richmond Hill and are concerned about the average one-way commute time to downtown Toronto.Does the average one-way commute time exceed 25 minutes? You take a random sample of 100 Richmond Hill residents and find an average commute time of 29 minutes with a standard deviation of 7 minutes.
A)
B)
C)
D)
E)
A)
B)
C)
D)
E)
Unlock Deck
Unlock for access to all 50 flashcards in this deck.
Unlock Deck
k this deck
42
You want to see if the number of minutes cell phone users use each month has changed from its mean of 120 minutes 2 years ago.You take a random sample of 100 cell phone users and find an average of 135 minutes used.
A)
B)
C)
D)
E)
A)
B)
C)
D)
E)
Unlock Deck
Unlock for access to all 50 flashcards in this deck.
Unlock Deck
k this deck
43
Marc wants to know if the mean age of the employees at his company is less than 26 years.He obtains a random sample of 100 employees,and finds a mean age of 25.1 years and a standard deviation of 9.2 years.
A)Fail to reject the null hypothesis of μ = 26 with a P-value of 0.1635.There is not sufficient evidence that the mean age is less than 26 years.
B)Reject the null hypothesis of μ = 26 with a P-value of 0.0425.The evidence suggests that the mean age is less than 26 years.
C)Fail to reject the null hypothesis of μ = 26 with a P-value of 0.8365.There is not sufficient evidence that the mean age is less than 26 years.
D)Reject the null hypothesis of μ = 26 with a P-value of 0.018.There is sufficient evidence that the mean age is less than 26 years.
E)There is not enough information to perform the test.
Unlock Deck
Unlock for access to all 50 flashcards in this deck.
Unlock Deck
k this deck
44
Is the mean weight of female college students equal to 59 kg? To test this,you take a random sample of 80 students,finding a mean of 61 kg with a standard deviation of 8.4 kg.
A)Fail to reject the null hypothesis of μ=59 with a P-value of 0.9668.There is not sufficient evidence that the weight of female students has changed.
B)Fail to reject the null hypothesis of μ=59 with a P-value of 0.0166.There is not sufficient evidence that the weight of female students has changed.
C)Reject the null hypothesis of μ=59 with a P-value of 0.0332.There is sufficient evidence that the weight of female students has changed.
D)Reject the null hypothesis of μ=59 with a P-value of 0.0166.There is sufficient evidence that the weight of female students has changed.
E)There is not enough information to perform the test.
Unlock Deck
Unlock for access to all 50 flashcards in this deck.
Unlock Deck
k this deck
45
Suzie has installed a new spam blocker program on her email.She used to receive an average of 20 spam emails a day.Is the new program working?
A)
B)
C)
D)
E) Not enough information is given.
A)
B)
C)
D)
E) Not enough information is given.
Unlock Deck
Unlock for access to all 50 flashcards in this deck.
Unlock Deck
k this deck
46
Is the mean lifetime of particular type of car engine greater than 350,000 km? To test this claim,a sample of 100 engines is measured,yielding an average of 354,585 km and a standard deviation of 18515 km.
A)Reject the null hypothesis of μ=350,000 with a P-value of 0.0134.There is sufficient evidence that the mean engine lifetime is longer than 350,000 km.
B)Reject the null hypothesis of μ=350,000 with a P-value of 0.0066.There is sufficient evidence that the mean engine lifetime is longer than 350,000 km.
C)Fail to reject the null hypothesis of μ=350,000 with a P-value of 0.9934.There is not sufficient evidence that the mean engine lifetime is longer than 350,000 km.
D)Fail to reject the null hypothesis with a P-value of 0.0735.There is not sufficient evidence that the mean engine lifetime is longer than 350,000 km.
E)There is not enough information to perform the test.
Unlock Deck
Unlock for access to all 50 flashcards in this deck.
Unlock Deck
k this deck
47
A test of sobriety involves measuring the subject's motor skills.Sixty-four randomly selected sober subjects take the test and produce a mean score of 41.0 with a standard deviation of 3.4.Test the claim that the true mean score for all sober subjects is equal to 40.5.
A)Fail to reject the null hypothesis of μ = 40.5 with a P-value of 0.0265.There is not sufficient evidence that the true mean score for sober subjects is different from 40.5.
B)Reject the null hypothesis of μ = 40.5 with a P-value of 0.0165.There is sufficient evidence that the true mean score for sober subjects is different from 40.5.
C)Reject the null hypothesis of μ = 40.5 with a P-value of 0.1190.There is strong evidence that the true mean score for sober subjects is not 40.5.
D)Fail to reject the null hypothesis of μ = 40.5 with a P-value of 0.2380.There is not sufficient evidence that the true mean score for sober subjects is different from 40.5.
E)There is not enough information to perform the test.
Unlock Deck
Unlock for access to all 50 flashcards in this deck.
Unlock Deck
k this deck
48
Has the introduction of more music download services changed the number of university students downloading music online without paying for it? Two years ago,approximately 50,000 college students admitted to downloading music online without paying for it.
A)
B)
C)
D)
E)
A)
B)
C)
D)
E)
Unlock Deck
Unlock for access to all 50 flashcards in this deck.
Unlock Deck
k this deck
49
A large software company gives job applicants a test of programming ability,and the mean for the test has been 160 in the past.One-hundred applicants are randomly selected from one large university and they produce a mean score of 163,with a standard deviation of 13.Is there enough evidence to indicate that the sample comes from a population with a mean score greater than 160?
A)No.With a P-value of 0.9896,we fail to reject the null hypothesis of μ=160.
B)Yes.With a P-value of 0.0208,we reject the null hypothesis of μ=160.
C)Yes.With a P-value of 0.0104,we reject the null hypothesis of μ=160.
D)No.With a P-value of 0.9792,we fail to reject the null hypothesis of μ=160.
E)There is not enough information to perform the test.
Unlock Deck
Unlock for access to all 50 flashcards in this deck.
Unlock Deck
k this deck
50
Are Canadians getting fatter? Researchers interested in this question take a random sample of 500 people and record an average weight of 86 kg.Ten years ago,the average weight was 83 kg.
A)
B)
C)
D)
E)
A)
B)
C)
D)
E)
Unlock Deck
Unlock for access to all 50 flashcards in this deck.
Unlock Deck
k this deck
Unlock Deck
Unlock for access to all 50 flashcards in this deck.


