Deck 21: Comparing Two Proportions
Full screen (f)
Question
Question
Question
Question
Question
Question
Question
Question
A university is studying the proportion of students retained in various years.Suppose the proportion of students retained in 2009 is 
And the proportion of students retained in 2010 is
.A study found a 90% confidence interval for
-
Is (-0.0398,0.0262).Give an interpretation of this confidence interval.
A)We are 90% confident that the proportion of students retained in 2009 is between 3.98% less and 2.62% more than the proportion of students retained in 2010.
B)We know that 90% of students retained in 2010 between 3.98% less and 2.62% more than 2009.
C)We know that 90% of students retained in 2009 between 3.98% less and 2.62% more than 2010.
D)We are 90% confident that the proportion of students retained in 2010 is between 3.98% less and 2.62% more than the proportion of students retained in 2009.
E)We know that 90% of all random samples done on the population will show that the proportion of students retained in 2009 is between 3.98% less and 2.62% more than the proportion of students retained in 2010.
Question
Question
Question
Question
Question
A marketing survey involves product recognition in Ontario and British Columbia.Suppose the proportion of Ontario residents who recognized a product is 
And the proportion of British Columbia residents who recognized the product is
.The survey found a 98% confidence interval for
-
Is (-0.023,-0.019).Give an interpretation of this confidence interval.
A)We know that 98% of British Columbia residents recognized the product between 1.9% and 2.3% more often than Ontario residents.
B)We know that 98% of Ontario residents recognized the product between 1.9% and 2.3% more often than British Columbia residents.
C)We are 98% confident that the proportion of British Columbia residents who recognized the product is between 1.9% and 2.3% higher than the proportion of Ontario residents who recognized the product.
D)We know that 98% of all random samples done on the population will show that the proportion of British Columbia residents who knew the product is between 1.9% and 2.3% higher than the proportion of Ontario residents who knew the product.
E)We are 98% confident that the proportion of Ontario residents who recognized the product is between 1.9% and 2.3% higher than the proportion of British Columbia residents who recognized the product.
Question
Suppose the proportion of women who watch CBC News is 
And the proportion of men who watch CBC News is
.The survey found a 95% confidence interval for
-
Is (-0.06,0.25).Give an interpretation of this confidence interval.
A)We are 95% confident that the proportion of women who watch CBC News is between 6% lower and 25% higher than the proportion of men who watch CBC News.
B)We know that 95% of all random samples done on the population will show that the proportion of men who watch CBC News is between 6% lower and 25% higher than the proportion of women who watch CBC News.
C)We know that 95% of all random samples done on the population will show that the proportion of women who watch CBC News is between 6% lower and 25% higher than the proportion of men who watch CBC News.
D)We are 95% confident that the proportion of men who watch CBC News is between 6% lower and 25% higher than the proportion of women who watch CBC News.
E)95% of men and women watch CBC News 6% less to 25% more than other news programs.
Question
Question
Question
Suppose the proportion of women who follow a regular exercise program is 
And the proportion of men who follow a regular exercise program is
.A study found a 98% confidence interval for
-
Is (-0.028,0.114).Give an interpretation of this confidence interval.
A)We are 98% confident that the proportion of women who follow a regular exercise program is between 2.8% less and 11.4% more than the proportion of men who follow a regular exercise program.
B)We know that 98% of women exercise between 2.8% less and 11.4% more than men.
C)We know that 98% of men exercise between 2.8% less and 11.4% more than women.
D)We are 98% confident that the proportion of men who follow a regular exercise program is between 2.8% less and 11.4% more than the proportion of women who follow a regular exercise program.
E)We know that 98% of all random samples done on the population will show that the proportion of women who follow a regular exercise program is between 2.8% less and 11.4% more than the proportion of men who follow a regular exercise program.
Question
Suppose the proportion of first year students at a particular university who purchased used textbooks in the past year is 
And the proportion of second year students at the university who purchased used textbooks in the past year is
.A study found a 95% confidence interval for
-
Is (0.232,0.421).Give an interpretation of this confidence interval.
A)We are 95% confident that at this university the proportion of second year students who bought used textbooks is between 23.2% and 42.1% higher than the proportion of first year students who bought used textbooks.
B)We are 95% confident that at this university the proportion of first year students who bought used textbooks is between 23.2% and 42.1% higher than the proportion of second year students who bought used textbooks.
C)We know that 95% of first year students bought between 23.2% and 42.1% more used textbooks than second year students at this university.
D)We are 95% confident that first year students at this university bought between 23.2% and 42.1% more used textbooks than second year students.
E)We know that 95% of all random samples done on the population will show that the proportion of first year students who bought used textbooks is between 23.2% and 42.1% higher than the proportion of second year students who bought used textbooks.
Question
A study was conducted to determine if patients recovering from knee surgery should receive physical therapy two or three times per week.Suppose 
Represents the proportion of patients who showed improvement after one month of therapy three times a week and
Represents the proportion of patients who showed improvement after one month of therapy twice a week.A 90% confidence interval for
-
Is (0.15,0.39).Give an interpretation of this confidence interval.
A)We are 90% confident,based on the data,that the proportion of patients who show improvement with therapy three times per week is between 15% and 39% lower than the proportion who show improvement with therapy twice a week.
B)We are 90% confident,based on the data,that the proportion of patients who show improvement with therapy three times per week is between 15% and 39% higher than the proportion who show improvement with therapy twice a week.
C)We know that 90% of all knee-surgery patients will show between 15% and 39% more improvement with therapy three times per week instead of twice a week.
D)We know that 90% of all knee-surgery patients will show between 15% and 39% more improvement with therapy twice a week instead of three times per week.
E)We are 90% confident,based on the data,that patients who receive therapy three times per week show between 15% and 39% more improvement after one month than patients who receive therapy twice a week.
Question
A researcher wishes to determine whether the proportion of Canadian women who smoke differs from the proportion of Canadian men who smoke.He wants to test the hypothesis 
:
=
where
represents the proportion of Canadian women who smoke and
represents the proportion of Canadian men who smoke.He randomly selects 100 married couples.Among the 100 women in the sample are 21 smokers.Among the 100 men are 29 smokers.Are the assumptions for a two-sample z-test for two population proportions met? If not,which assumption is violated and why?
Question
Question
A two-sample z-test for two population proportions is to be performed using the P-value approach.The null hypothesis is 
:
=
and the alternative is
:
≠
.Use the given sample data to find the P-value for the hypothesis test.Give an interpretation of the p-value.
A poll reported that 3 out of 50 first year university students surveyed did not have jobs,while 7 out of 50 second year university students did not have jobs during the academic year.
A)P-value = 0.1836;If there is no difference in the proportions,there is about a 18.36% chance of seeing the observed difference or larger by natural sampling variation.
B)P-value = 0.0918;If there is no difference in the proportions,there is about a 9.18% chance of seeing the exact observed difference by natural sampling variation.
C)P-value = 0.0072;If there is no difference in the proportions,there is about a 0.72% chance of seeing the observed difference or larger by natural sampling variation.
D)P-value = 0.1836;There is about a 18.36% chance that the two proportions are equal.
E)P-value = 0.0613;There is about a 6.13% chance that the two proportions are equal.
:
=
and the alternative is
:
≠
.Use the given sample data to find the P-value for the hypothesis test.Give an interpretation of the p-value.
A poll reported that 3 out of 50 first year university students surveyed did not have jobs,while 7 out of 50 second year university students did not have jobs during the academic year.
A)P-value = 0.1836;If there is no difference in the proportions,there is about a 18.36% chance of seeing the observed difference or larger by natural sampling variation.
B)P-value = 0.0918;If there is no difference in the proportions,there is about a 9.18% chance of seeing the exact observed difference by natural sampling variation.
C)P-value = 0.0072;If there is no difference in the proportions,there is about a 0.72% chance of seeing the observed difference or larger by natural sampling variation.
D)P-value = 0.1836;There is about a 18.36% chance that the two proportions are equal.
E)P-value = 0.0613;There is about a 6.13% chance that the two proportions are equal.
Question
A study investigated the smoking status of people in two age groups.Let 
Represent the proportion of people aged 20-24 who are smokers.Let
Represent the proportion of people aged 25-29 who are smokers.A 95% confidence interval for the difference in smoking rates for
-
Was found to be (0.045,0.112).Give an interpretation of this confidence interval.
A)We know that 95% of the proportion of smokers aged 25-29 is between 4.5% and 11.2% lower than the proportion of smokers aged 20-24.
B)We know that 95% of all random samples done on the population will show that the proportion of smokers aged 20-24 is between 4.5% and 11.2% higher than the proportion of smokers aged 25-29.
C)We are 95% confident that the proportion of smokers aged 25-29 is between 4.5% and 11.2% higher than the proportion of smokers aged 20-24.
D)We know that 95% of the proportion of smokers aged 20-24 is between 4.5% and 11.2% more than the proportion of smokers aged 25-29.
E)We are 95% confident that the proportion of smokers aged 20-24 is between 4.5% and 11.2% higher than the proportion of smokers aged 25-29.
Question
A two-sample z-test for two population proportions is to be performed using the P-value approach.The null hypothesis is
:
=
and the alternative is
:
≠
.Use the given sample data to find the P-value for the hypothesis test.Give an interpretation of the p-value.
A poll reported that 30% of 60 Canadians between the ages of 25 and 29 had started saving money for retirement.Of the 40 Canadians surveyed between the ages of 21 and 24,25% had started saving for retirement.
A)P-value = 0.5824;There is about a 58.24% chance that the two proportions are equal.
B)P-value = 0.1812;If there is no difference in the proportions,there is about a 18.12% chance of seeing the observed difference or larger by natural sampling variation.
C)P-value = 0.2912;There is about a 24.96% chance that the two proportions are equal.
D)P-value = 0.2912;If there is no difference in the proportions,there is about a 24.96% chance of seeing the exact observed difference by natural sampling variation.
E)P-value = 0.5824;If there is no difference in the proportions,there is about a 58.24% chance of seeing the observed difference or larger by natural sampling variation.
:
=
and the alternative is
:
≠
.Use the given sample data to find the P-value for the hypothesis test.Give an interpretation of the p-value.
A poll reported that 30% of 60 Canadians between the ages of 25 and 29 had started saving money for retirement.Of the 40 Canadians surveyed between the ages of 21 and 24,25% had started saving for retirement.
A)P-value = 0.5824;There is about a 58.24% chance that the two proportions are equal.
B)P-value = 0.1812;If there is no difference in the proportions,there is about a 18.12% chance of seeing the observed difference or larger by natural sampling variation.
C)P-value = 0.2912;There is about a 24.96% chance that the two proportions are equal.
D)P-value = 0.2912;If there is no difference in the proportions,there is about a 24.96% chance of seeing the exact observed difference by natural sampling variation.
E)P-value = 0.5824;If there is no difference in the proportions,there is about a 58.24% chance of seeing the observed difference or larger by natural sampling variation.
Question
Question
Use the given sample data to test the claim that p1 > p2.Use a significance level of 0.01. 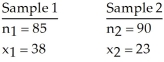
Question
Question
A new manager,hired at a large warehouse,was told to reduce the employee sick leave.The manager introduced a new incentive program for employees with perfect attendance.Suppose the proportion of the employees sick prior to the new program is 
And the employees sick after the new program is
.A study found a 98% confidence interval for
-
Is (-0.0668,0.1125).Give an interpretation of this confidence interval.
A)We know that 98% of the employees sick after the new program is between 6.68% less and 11.25% more than the employees sick prior to the new program.
B)We are 98% confident that the proportion of the employees sick prior to the new program is between 6.68% less and 11.25% more than the proportion of the employees sick after the new program.
C)We know that 98% of all random samples done on the population will show that the proportion of the employees sick prior to the new program is between 6.68% less and 11.25% more than the proportion of the employees sick after the new program.
D)We know that 98% of the employees sick prior to the new program is between 6.68% less and 11.25% more than the employees sick after the new program.
E)We are 98% confident that the proportion of the employees sick after the new program is between 6.68% less and 11.25% more than the proportion of the employees sick prior to the new program.
Question
A two-sample z-test for two population proportions is to be performed using the P-value approach.The null hypothesis is
:
=
and the alternative is
:
≠
.Use the given sample data to find the P-value for the hypothesis test.Give an interpretation of the p-value.
A weight loss centre in the city provided a weight loss for 152 out of 200 participants.A weight loss centre in the suburb provided a weight loss for 109 out of 140 participants.
A)P-value = 0.6892;If there is no difference in the proportions,there is about a 68.92% chance of seeing the observed difference or larger by natural sampling variation.
B)P-value = 0.6892;There is about a 68.92% chance that the two proportions are equal.
C)P-value = 0.3446;If there is no difference in the proportions,there is about a 34.46% chance of seeing the observed difference or larger by natural sampling variation.
D)P-value = 0.3446;There is about a 34.46% chance that the two proportions are equal.
E)P-value = 0.6554;If there is no difference in the proportions,there is about a 65.54% chance of seeing the observed difference or larger by natural sampling variation.
:
=
and the alternative is
:
≠
.Use the given sample data to find the P-value for the hypothesis test.Give an interpretation of the p-value.
A weight loss centre in the city provided a weight loss for 152 out of 200 participants.A weight loss centre in the suburb provided a weight loss for 109 out of 140 participants.
A)P-value = 0.6892;If there is no difference in the proportions,there is about a 68.92% chance of seeing the observed difference or larger by natural sampling variation.
B)P-value = 0.6892;There is about a 68.92% chance that the two proportions are equal.
C)P-value = 0.3446;If there is no difference in the proportions,there is about a 34.46% chance of seeing the observed difference or larger by natural sampling variation.
D)P-value = 0.3446;There is about a 34.46% chance that the two proportions are equal.
E)P-value = 0.6554;If there is no difference in the proportions,there is about a 65.54% chance of seeing the observed difference or larger by natural sampling variation.
Question
A two-sample z-test for two population proportions is to be performed using the P-value approach.The null hypothesis is
:
=
and the alternative is
:
≠
.Use the given sample data to find the P-value for the hypothesis test.Give an interpretation of the p-value.
n1 = 50 n2 = 75
X1 = 20 x2 = 15
A)P-value = 0.0073;There is about a 0.73% chance that the two proportions are equal.
B)P-value = 0.0073;If there is no difference in the proportions,there is about a 0.73% chance of seeing the observed difference or larger by natural sampling variation.
C)P-value = 0.0037;If there is no difference in the proportions,there is a 0.37% chance of seeing the exact observed difference by natural sampling variation.
D)P-value = 0.0146;If there is no difference in the proportions,there is about a 1.46% chance of seeing the observed difference or larger by natural sampling variation.
E)P-value = 0.0146;There is about a 1.46% chance that the two proportions are equal.
:
=
and the alternative is
:
≠
.Use the given sample data to find the P-value for the hypothesis test.Give an interpretation of the p-value.
n1 = 50 n2 = 75
X1 = 20 x2 = 15
A)P-value = 0.0073;There is about a 0.73% chance that the two proportions are equal.
B)P-value = 0.0073;If there is no difference in the proportions,there is about a 0.73% chance of seeing the observed difference or larger by natural sampling variation.
C)P-value = 0.0037;If there is no difference in the proportions,there is a 0.37% chance of seeing the exact observed difference by natural sampling variation.
D)P-value = 0.0146;If there is no difference in the proportions,there is about a 1.46% chance of seeing the observed difference or larger by natural sampling variation.
E)P-value = 0.0146;There is about a 1.46% chance that the two proportions are equal.
Question
A two-sample z-test for two population proportions is to be performed using the P-value approach.The null hypothesis is
:
=
and the alternative is
:
≠
.Use the given sample data to find the P-value for the hypothesis test.Give an interpretation of the p-value.
A new manager started a program on employee sick leave.The manager later compares the sick leave rate prior to the program starting (65 out of 250 employees were sick)to the sick leave rate one month into the program (55 out of 253 employees were sick).
A)P-value = 0.1314;There is about a 13.14% chance that the two proportions are equal.
B)P-value = 0.2628;There is about a 26.28% chance that the two proportions are equal.
C)P-value = 0.7372;If there is no difference in the proportions,there is about a 73.72% chance of seeing the observed difference or larger by natural sampling variation.
D)P-value = 0.1314;If there is no difference in the proportions,there is about a 13.14% chance of seeing the observed difference or larger by natural sampling variation.
E)P-value = 0.2628;If there is no difference in the proportions,there is about a 26.28% chance of seeing the observed difference or larger by natural sampling variation.
:
=
and the alternative is
:
≠
.Use the given sample data to find the P-value for the hypothesis test.Give an interpretation of the p-value.
A new manager started a program on employee sick leave.The manager later compares the sick leave rate prior to the program starting (65 out of 250 employees were sick)to the sick leave rate one month into the program (55 out of 253 employees were sick).
A)P-value = 0.1314;There is about a 13.14% chance that the two proportions are equal.
B)P-value = 0.2628;There is about a 26.28% chance that the two proportions are equal.
C)P-value = 0.7372;If there is no difference in the proportions,there is about a 73.72% chance of seeing the observed difference or larger by natural sampling variation.
D)P-value = 0.1314;If there is no difference in the proportions,there is about a 13.14% chance of seeing the observed difference or larger by natural sampling variation.
E)P-value = 0.2628;If there is no difference in the proportions,there is about a 26.28% chance of seeing the observed difference or larger by natural sampling variation.
Question
A two-sample z-test for two population proportions is to be performed using the P-value approach.The null hypothesis is
:
=
and the alternative is
:
≠
.Use the given sample data to find the P-value for the hypothesis test.Give an interpretation of the p-value.
n1 = 200 n2 = 100
X1 = 11 x2 = 8
A)P-value = 0.2005;There is about a 20.05% chance that the two proportions are equal
B)P-value = 0.401;There is about a 40.1% chance that the two proportions are equal.
C)P-value = 0.401;If there is no difference in the proportions,there is about a 40.1% chance of seeing the observed difference or larger by natural sampling variation.
D)P-value = 0.2005;If there is no difference in the proportions,there is about a 20.05% chance of seeing the observed difference or larger by natural sampling variation.
E)P-value = 0.401;If there is a difference in the proportions,there is a 40.1% chance of seeing the observed difference by natural sampling variation.
:
=
and the alternative is
:
≠
.Use the given sample data to find the P-value for the hypothesis test.Give an interpretation of the p-value.
n1 = 200 n2 = 100
X1 = 11 x2 = 8
A)P-value = 0.2005;There is about a 20.05% chance that the two proportions are equal
B)P-value = 0.401;There is about a 40.1% chance that the two proportions are equal.
C)P-value = 0.401;If there is no difference in the proportions,there is about a 40.1% chance of seeing the observed difference or larger by natural sampling variation.
D)P-value = 0.2005;If there is no difference in the proportions,there is about a 20.05% chance of seeing the observed difference or larger by natural sampling variation.
E)P-value = 0.401;If there is a difference in the proportions,there is a 40.1% chance of seeing the observed difference by natural sampling variation.
Question
A two-sample z-test for two population proportions is to be performed using the P-value approach.The null hypothesis is
:
=
and the alternative is
:
≠
.Use the given sample data to find the P-value for the hypothesis test.Give an interpretation of the p-value.
A university found it retained 25 students out of 352 in 2009 and 36 students out of 334 in 2010.
A)P-value = 0.0455;If there is no difference in the proportions,there is about a 4.55% chance of seeing the observed difference or larger by natural sampling variation.
B)P-value = 0.9545;If there is no difference in the proportions,there is about a 95.45% chance of seeing the observed difference or larger by natural sampling variation.
C)P-value = 0.0455;There is about a 4.55% chance that the two proportions are equal.
D)P-value = 0.091;There is about a 9.1% chance that the two proportions are equal.
E)P-value = 0.091;If there is no difference in the proportions,there is about a 9.1% chance of seeing the observed difference or larger by natural sampling variation.
:
=
and the alternative is
:
≠
.Use the given sample data to find the P-value for the hypothesis test.Give an interpretation of the p-value.
A university found it retained 25 students out of 352 in 2009 and 36 students out of 334 in 2010.
A)P-value = 0.0455;If there is no difference in the proportions,there is about a 4.55% chance of seeing the observed difference or larger by natural sampling variation.
B)P-value = 0.9545;If there is no difference in the proportions,there is about a 95.45% chance of seeing the observed difference or larger by natural sampling variation.
C)P-value = 0.0455;There is about a 4.55% chance that the two proportions are equal.
D)P-value = 0.091;There is about a 9.1% chance that the two proportions are equal.
E)P-value = 0.091;If there is no difference in the proportions,there is about a 9.1% chance of seeing the observed difference or larger by natural sampling variation.
Question
Use the given sample data to test the claim that p1 < p2.Use a significance level of 0.10. 

n1 = 462 n2 = 380
x1 = 84 x2 = 95
n1 = 462 n2 = 380
x1 = 84 x2 = 95
Question
Suppose the proportion of people losing weight at a city weight loss centre is 
And the proportion of people losing weight at a suburban weight loss centre is
.A study found a 98% confidence interval for
-
Is (-0.1263,0.0891).Give an interpretation of this confidence interval.
A)We are 98% confident that the proportion of people losing weight at the city weight loss centre is between 12.63% less and 8.91% more than the proportion of people losing weight at the suburban weight loss centre.
B)We know that 98% of the people at the suburban weight loss centre lost between 12.63% less and 8.91% more than the people at the city weight loss centre.
C)We know that 98% of all random samples done on the population will show that the proportion of people losing weight at the city weight loss centre is between 12.63% less and 8.91% more than the proportion of people losing weight at the suburban weight loss centre.
D)We are 98% confident that the proportion of people losing weight at the suburban weight loss centre is between 12.63% less and 8.91% more than the proportion of people losing weight at the city weight loss centre.
E)We know that 98% of the people at the city weight loss centre lost between 12.63% less and 8.91% more than the people at the suburban weight loss centre.
Question
A two-sample z-test for two population proportions is to be performed using the P-value approach.The null hypothesis is
:
=
and the alternative is
:
≠
.Use the given sample data to find the P-value for the hypothesis test.Give an interpretation of the p-value.
A poll reported that 41 of 100 men surveyed were in favour of increased security at airports,while 35 of 140 women were in favour of increased security.
A)P-value = 0.0512;If there is no difference in the proportions,there is about a 5.12% chance of seeing the observed difference or larger by natural sampling variation.
B)P-value = 0.0512;There is about a 5.12% chance that the two proportions are equal.
C)P-value = 0.4211;If there is no difference in the proportions,there is a 42.11% chance of seeing the exact observed difference by natural sampling variation.
D)P-value = 0.0086;There is about a 0.86% chance that the two proportions are equal.
E)P-value = 0.0086;If there is no difference in the proportions,there is about a 0.86% chance of seeing the observed difference or larger by natural sampling variation.
:
=
and the alternative is
:
≠
.Use the given sample data to find the P-value for the hypothesis test.Give an interpretation of the p-value.
A poll reported that 41 of 100 men surveyed were in favour of increased security at airports,while 35 of 140 women were in favour of increased security.
A)P-value = 0.0512;If there is no difference in the proportions,there is about a 5.12% chance of seeing the observed difference or larger by natural sampling variation.
B)P-value = 0.0512;There is about a 5.12% chance that the two proportions are equal.
C)P-value = 0.4211;If there is no difference in the proportions,there is a 42.11% chance of seeing the exact observed difference by natural sampling variation.
D)P-value = 0.0086;There is about a 0.86% chance that the two proportions are equal.
E)P-value = 0.0086;If there is no difference in the proportions,there is about a 0.86% chance of seeing the observed difference or larger by natural sampling variation.
Question
Suppose that Statistics Canada wants to compare the current unemployment rate between Montreal and Toronto.Let 
And
Represent the current unemployment rates in Montreal and the current A study found a 90% confidence interval for
-
Is (-0.0457,0.0424).Give an interpretation of this confidence interval.
A)We are 90% confident that the unemployment rate in Toronto is between 4.57% less and 4.24% more than the unemployment rate in Montreal.
B)We know that 90% of the unemployment rate in Toronto is between 4.57% less and 4.24% more than the unemployment rate in Montreal.
C)We are 90% confident that the unemployment rate in Montreal is between 4.57% less and 4.24% more than the unemployment rate in Toronto.
D)We know that 90% of the unemployment rate in Montreal is between 4.57% less and 4.24% more than the unemployment rate in Toronto.
E)We know that 90% of all random samples done on the population will show that the unemployment rate in Montreal is between 4.57% less and 4.24% more than the unemployment rate in Toronto.
Question
A two-sample z-test for two population proportions is to be performed using the P-value approach.The null hypothesis is
:
=
and the alternative is
:
≠
.Use the given sample data to find the P-value for the hypothesis test.Give an interpretation of the p-value.
In City A,7420 people are unemployed in a random sample of 143000 people.In City B,7642 people are unemployed in a random sample of 142000 people.
A)P-value = 0.0214;If there is no difference in the proportions,there is about a 2.14% chance of seeing the observed difference or larger by natural sampling variation.
B)P-value = 0.0107;If there is no difference in the proportions,there is about a 1.07% chance of seeing the observed difference or larger by natural sampling variation.
C)P-value = 0.0214;There is about a 2.14% chance that the two proportions are equal.
D)P-value = 0.0107;There is about a 1.07% chance that the two proportions are equal.
E)P-value = 0.9893;If there is no difference in the proportions,there is about a 98.93% chance of seeing the observed difference or larger by natural sampling variation.
:
=
and the alternative is
:
≠
.Use the given sample data to find the P-value for the hypothesis test.Give an interpretation of the p-value.
In City A,7420 people are unemployed in a random sample of 143000 people.In City B,7642 people are unemployed in a random sample of 142000 people.
A)P-value = 0.0214;If there is no difference in the proportions,there is about a 2.14% chance of seeing the observed difference or larger by natural sampling variation.
B)P-value = 0.0107;If there is no difference in the proportions,there is about a 1.07% chance of seeing the observed difference or larger by natural sampling variation.
C)P-value = 0.0214;There is about a 2.14% chance that the two proportions are equal.
D)P-value = 0.0107;There is about a 1.07% chance that the two proportions are equal.
E)P-value = 0.9893;If there is no difference in the proportions,there is about a 98.93% chance of seeing the observed difference or larger by natural sampling variation.
Question
Question
Question
Question
Question
Question
Suppose the proportion of first year students at a particular university who purchased used textbooks in the past year is 
and the proportion of second year students at the university who purchased used textbooks in the past year is
.A study found a 95% confidence interval for
-
is (0.237,0.421).Does this interval suggest that first year students are more likely than second year students to buy used textbooks? Explain.
and the proportion of second year students at the university who purchased used textbooks in the past year is
.A study found a 95% confidence interval for
-
is (0.237,0.421).Does this interval suggest that first year students are more likely than second year students to buy used textbooks? Explain.
Question
A two-sample z-test for two population proportions is to be performed using the P-value approach.The null hypothesis is
:
=
and the alternative is
:
≠
.Use the given sample data to find the P-value for the hypothesis test.Give an interpretation of the p-value.
A study investigated the smoking status of people in two age groups.A random sample of 100 people aged 20-24 revealed 24 who are smokers.A random sample of 120 people aged 25-29 revealed 15 who are smokers.
A)P-value = 0.0132;If there is no difference in the proportions,there is about a 1.32% chance of seeing the observed difference or larger by natural sampling variation.
B)P-value = 0.0264;If there is no difference in the proportions,there is about a 2.64% chance of seeing the observed difference or larger by natural sampling variation.
C)P-value = 0.9736;If there is no difference in the proportions,there is about a 97.36% chance of seeing the observed difference or larger by natural sampling variation.
D)P-value = 0.0264;There is about a 2.64% chance that the two proportions are equal.
E)P-value = 0.0132;There is about a 1.32% chance that the two proportions are equal.
:
=
and the alternative is
:
≠
.Use the given sample data to find the P-value for the hypothesis test.Give an interpretation of the p-value.
A study investigated the smoking status of people in two age groups.A random sample of 100 people aged 20-24 revealed 24 who are smokers.A random sample of 120 people aged 25-29 revealed 15 who are smokers.
A)P-value = 0.0132;If there is no difference in the proportions,there is about a 1.32% chance of seeing the observed difference or larger by natural sampling variation.
B)P-value = 0.0264;If there is no difference in the proportions,there is about a 2.64% chance of seeing the observed difference or larger by natural sampling variation.
C)P-value = 0.9736;If there is no difference in the proportions,there is about a 97.36% chance of seeing the observed difference or larger by natural sampling variation.
D)P-value = 0.0264;There is about a 2.64% chance that the two proportions are equal.
E)P-value = 0.0132;There is about a 1.32% chance that the two proportions are equal.
Question
Question
Question
Question
Suppose the proportion of women who follow a regular exercise program is 
and the proportion of men who follow a regular exercise program is
.A study found a 98% confidence interval for
-
is (-0.022,0.111).Does this study provide strong evidence of a gender-based difference in exercise? Explain.
and the proportion of men who follow a regular exercise program is
.A study found a 98% confidence interval for
-
is (-0.022,0.111).Does this study provide strong evidence of a gender-based difference in exercise? Explain.
Question
Question
Question

Unlock Deck
Sign up to unlock the cards in this deck!
Unlock Deck
Unlock Deck
1/52
Play
Full screen (f)
Deck 21: Comparing Two Proportions
1
A researcher wished to test the claim that the rate of defectives among the computers of two different manufacturers is the same.She selected two independent random samples and found that 1.5% of 400 computers from manufacturer A were defective and 3.5% of 200 computers from manufacturer B were defective.
The assumptions and conditions necessary for inference are not satisfied.There are only 6 defectives from manufacturer A and 7 defectives from manufacturer B.This violates the success/failure condition which requires that at least 10 successes and at least 10 failures be observed in each sample.
2
A poll of randomly selected Canadians between the ages of 20 and 29 reports that 35 of 410 men and 59 of 398 women suffered from insomnia at least once a week during the past year.
The assumptions and conditions necessary for inference are satisfied.The samples are both random.Each sample contains less than 10% of the population.The samples are independent of each other.There are at least 10 successes and at least 10 failures in each sample.
3
In a random sample of 500 people aged 20-24,22% were smokers.In a random sample of 450 people aged 25-29,14% were smokers.Construct a 95% confidence interval for the difference in smoking rates for the two groups.
A)(0.032,0.112)
B)(0.048,0.112)
C)(0.035,0.125)
D)(0.032,0.128)
E)(0.025,0.135)
A)(0.032,0.112)
B)(0.048,0.112)
C)(0.035,0.125)
D)(0.032,0.128)
E)(0.025,0.135)
(0.032,0.128)
4
A survey of randomly chosen adults found that 30 of the 64 women and 49 of the 74 men follow regular exercise programs.Construct a 95% confidence interval for the difference in the proportions of women and men who have regular exercise programs.
A)(-0.356,-0.030)
B)(-0.387,0.631)
C)(-0.387,0.662)
D)(0.306,0.631)
E)(0.276,0.662)
A)(-0.356,-0.030)
B)(-0.387,0.631)
C)(-0.387,0.662)
D)(0.306,0.631)
E)(0.276,0.662)
Unlock Deck
Unlock for access to all 52 flashcards in this deck.
Unlock Deck
k this deck
5
An Ontario study examined the effect of day care on behavior in toddlers.Randomly selected parents who had a toddler in full-time day care were asked if their child had behavioral problems.The researchers found that among 987 parents surveyed,212 said their child had behavioral problems.Among 349 randomly selected parents with a toddler at home,17 reported that their child had behavioral problems.
Unlock Deck
Unlock for access to all 52 flashcards in this deck.
Unlock Deck
k this deck
6
A university found it retained 25 students out of 352 in 2009 and 26 students out of 334 in 2010.Construct a 90% confidence interval for the difference in the proportions of students retained in 2003 and 2004.
A)(-0.0461,0.0325)
B)(-0.0535,0.0398)
C)(-0.0585,0.0449)
D)(-0.0398,0.0262)
E)(0.0262,0.0398)
A)(-0.0461,0.0325)
B)(-0.0535,0.0398)
C)(-0.0585,0.0449)
D)(-0.0398,0.0262)
E)(0.0262,0.0398)
Unlock Deck
Unlock for access to all 52 flashcards in this deck.
Unlock Deck
k this deck
7
In Canada,a person with a body mass index (BMI)of 30 more is considered to be "obese." A random sample of 100 Canadian men revealed 26 to be obese.A random sample of 100 Canadian women revealed 21 to be obese.Construct a 90% confidence interval for the difference in the proportions of obese Canadian men and women.
A)(0.0424,0.1457)
B)(-0.0485,0.1485)
C)(-0.0541,0.1508)
D)(-0.0706,0.1673)
E)(-0.0639,0.1606)
A)(0.0424,0.1457)
B)(-0.0485,0.1485)
C)(-0.0541,0.1508)
D)(-0.0706,0.1673)
E)(-0.0639,0.1606)
Unlock Deck
Unlock for access to all 52 flashcards in this deck.
Unlock Deck
k this deck
8
A university is studying the proportion of students retained in various years.Suppose the proportion of students retained in 2009 is
And the proportion of students retained in 2010 is
.A study found a 90% confidence interval for
-
Is (-0.0398,0.0262).Give an interpretation of this confidence interval.
A)We are 90% confident that the proportion of students retained in 2009 is between 3.98% less and 2.62% more than the proportion of students retained in 2010.
B)We know that 90% of students retained in 2010 between 3.98% less and 2.62% more than 2009.
C)We know that 90% of students retained in 2009 between 3.98% less and 2.62% more than 2010.
D)We are 90% confident that the proportion of students retained in 2010 is between 3.98% less and 2.62% more than the proportion of students retained in 2009.
E)We know that 90% of all random samples done on the population will show that the proportion of students retained in 2009 is between 3.98% less and 2.62% more than the proportion of students retained in 2010.
Unlock Deck
Unlock for access to all 52 flashcards in this deck.
Unlock Deck
k this deck
9
The weight loss franchise home office wanted to compare the results of two centres.A centre in the city provided a weight loss for 152 out of 200 participants.A centre in the suburb provided a weight loss for 109 out of 140 participants.Construct a 98% confidence interval for the difference in the proportions of participants in the city weight loss centre and suburban weight loss centre.
A)(-0.0947,0.0576)
B)(-0.1263,0.0891)
C)(-0.1378,0.1007)
D)(-0.1093,0.0722)
E)(0.0891,0.1263)
A)(-0.0947,0.0576)
B)(-0.1263,0.0891)
C)(-0.1378,0.1007)
D)(-0.1093,0.0722)
E)(0.0891,0.1263)
Unlock Deck
Unlock for access to all 52 flashcards in this deck.
Unlock Deck
k this deck
10
A university wishes to compare the proportions of female students in the science and social science programs.A random sample of 120 science students contained 43 females.A random sample of 200 social science students contained 132 females.Construct a 99% confidence interval for the difference in the proportions of female students in the science and social science programs at this university.
A)(-0.44,-0.16)
B)(-0.66,0.30)
C)(-0.11,0.28)
D)(-0.57,0.25)
E)(0.30,0.66)
A)(-0.44,-0.16)
B)(-0.66,0.30)
C)(-0.11,0.28)
D)(-0.57,0.25)
E)(0.30,0.66)
Unlock Deck
Unlock for access to all 52 flashcards in this deck.
Unlock Deck
k this deck
11
A survey of randomly selected university students found that 83 of the 110 first year students and 87 of the 120 second year students surveyed had purchased used textbooks in the past year.Construct a 98% confidence interval for the difference in the proportions of first and second year university students who purchased used textbooks.
A)(-0.084,0.868)
B)(-0.105,0.164)
C)(0.641,0.868)
D)(0.620,0.890)
E)(0.620,0.868)
A)(-0.084,0.868)
B)(-0.105,0.164)
C)(0.641,0.868)
D)(0.620,0.890)
E)(0.620,0.868)
Unlock Deck
Unlock for access to all 52 flashcards in this deck.
Unlock Deck
k this deck
12
A new manager,hired at a large warehouse,was told to reduce the employee sick leave.The manager introduced a new incentive program for employees with perfect attendance.The manager later compares the sick leave rate prior to the program starting (65 out of 250 employees were sick)to the sick leave rate one month into the program (60 out of 253 employees were sick).Construct a 98% confidence interval for the difference in the proportions of sick employees prior to the program and one month into the program.
A)(-0.0405,0.0862)
B)(0.0668,0.1125)
C)(-0.0764,0.1221)
D)(-0.0668,0.1125)
E)(-0.0527,0.0984)
A)(-0.0405,0.0862)
B)(0.0668,0.1125)
C)(-0.0764,0.1221)
D)(-0.0668,0.1125)
E)(-0.0527,0.0984)
Unlock Deck
Unlock for access to all 52 flashcards in this deck.
Unlock Deck
k this deck
13
A marketing survey involves product recognition in Ontario and British Columbia.Suppose the proportion of Ontario residents who recognized a product is
And the proportion of British Columbia residents who recognized the product is
.The survey found a 98% confidence interval for
-
Is (-0.023,-0.019).Give an interpretation of this confidence interval.
A)We know that 98% of British Columbia residents recognized the product between 1.9% and 2.3% more often than Ontario residents.
B)We know that 98% of Ontario residents recognized the product between 1.9% and 2.3% more often than British Columbia residents.
C)We are 98% confident that the proportion of British Columbia residents who recognized the product is between 1.9% and 2.3% higher than the proportion of Ontario residents who recognized the product.
D)We know that 98% of all random samples done on the population will show that the proportion of British Columbia residents who knew the product is between 1.9% and 2.3% higher than the proportion of Ontario residents who knew the product.
E)We are 98% confident that the proportion of Ontario residents who recognized the product is between 1.9% and 2.3% higher than the proportion of British Columbia residents who recognized the product.
Unlock Deck
Unlock for access to all 52 flashcards in this deck.
Unlock Deck
k this deck
14
Suppose the proportion of women who watch CBC News is
And the proportion of men who watch CBC News is
.The survey found a 95% confidence interval for
-
Is (-0.06,0.25).Give an interpretation of this confidence interval.
A)We are 95% confident that the proportion of women who watch CBC News is between 6% lower and 25% higher than the proportion of men who watch CBC News.
B)We know that 95% of all random samples done on the population will show that the proportion of men who watch CBC News is between 6% lower and 25% higher than the proportion of women who watch CBC News.
C)We know that 95% of all random samples done on the population will show that the proportion of women who watch CBC News is between 6% lower and 25% higher than the proportion of men who watch CBC News.
D)We are 95% confident that the proportion of men who watch CBC News is between 6% lower and 25% higher than the proportion of women who watch CBC News.
E)95% of men and women watch CBC News 6% less to 25% more than other news programs.
Unlock Deck
Unlock for access to all 52 flashcards in this deck.
Unlock Deck
k this deck
15
In a random sample of 300 Canadian women,68% watch CBC News.In a random sample of 200 Canadian men,56% watch CBC News.Construct a 98% confidence interval for the difference in the proportions of women and men who watch CBC News.
A)(0.017,0.234)
B)(0.033,0.207)
C)(0.017,0.223)
D)(0.029,0.211)
E)(0.006,0.234)
A)(0.017,0.234)
B)(0.033,0.207)
C)(0.017,0.223)
D)(0.029,0.211)
E)(0.006,0.234)
Unlock Deck
Unlock for access to all 52 flashcards in this deck.
Unlock Deck
k this deck
16
A marketing survey involves product recognition in Ontario and British Columbia.Of 558 Ontario residents surveyed,193 knew the product while 196 out of 614 British Columbia residents knew the product.Construct a 99% confidence interval for the difference in the proportions of Ontario and British Columbia residents who knew the product.
A)(-0.0443,0.0566)
B)(-0.0443,0.0976)
C)(0.0247,0.0286)
D)(-0.0442,0.0975)
E)(-0.0034,0.0566)
A)(-0.0443,0.0566)
B)(-0.0443,0.0976)
C)(0.0247,0.0286)
D)(-0.0442,0.0975)
E)(-0.0034,0.0566)
Unlock Deck
Unlock for access to all 52 flashcards in this deck.
Unlock Deck
k this deck
17
Suppose the proportion of women who follow a regular exercise program is
And the proportion of men who follow a regular exercise program is
.A study found a 98% confidence interval for
-
Is (-0.028,0.114).Give an interpretation of this confidence interval.
A)We are 98% confident that the proportion of women who follow a regular exercise program is between 2.8% less and 11.4% more than the proportion of men who follow a regular exercise program.
B)We know that 98% of women exercise between 2.8% less and 11.4% more than men.
C)We know that 98% of men exercise between 2.8% less and 11.4% more than women.
D)We are 98% confident that the proportion of men who follow a regular exercise program is between 2.8% less and 11.4% more than the proportion of women who follow a regular exercise program.
E)We know that 98% of all random samples done on the population will show that the proportion of women who follow a regular exercise program is between 2.8% less and 11.4% more than the proportion of men who follow a regular exercise program.
Unlock Deck
Unlock for access to all 52 flashcards in this deck.
Unlock Deck
k this deck
18
Suppose the proportion of first year students at a particular university who purchased used textbooks in the past year is
And the proportion of second year students at the university who purchased used textbooks in the past year is
.A study found a 95% confidence interval for
-
Is (0.232,0.421).Give an interpretation of this confidence interval.
A)We are 95% confident that at this university the proportion of second year students who bought used textbooks is between 23.2% and 42.1% higher than the proportion of first year students who bought used textbooks.
B)We are 95% confident that at this university the proportion of first year students who bought used textbooks is between 23.2% and 42.1% higher than the proportion of second year students who bought used textbooks.
C)We know that 95% of first year students bought between 23.2% and 42.1% more used textbooks than second year students at this university.
D)We are 95% confident that first year students at this university bought between 23.2% and 42.1% more used textbooks than second year students.
E)We know that 95% of all random samples done on the population will show that the proportion of first year students who bought used textbooks is between 23.2% and 42.1% higher than the proportion of second year students who bought used textbooks.
Unlock Deck
Unlock for access to all 52 flashcards in this deck.
Unlock Deck
k this deck
19
A study was conducted to determine if patients recovering from knee surgery should receive physical therapy two or three times per week.Suppose
Represents the proportion of patients who showed improvement after one month of therapy three times a week and
Represents the proportion of patients who showed improvement after one month of therapy twice a week.A 90% confidence interval for
-
Is (0.15,0.39).Give an interpretation of this confidence interval.
A)We are 90% confident,based on the data,that the proportion of patients who show improvement with therapy three times per week is between 15% and 39% lower than the proportion who show improvement with therapy twice a week.
B)We are 90% confident,based on the data,that the proportion of patients who show improvement with therapy three times per week is between 15% and 39% higher than the proportion who show improvement with therapy twice a week.
C)We know that 90% of all knee-surgery patients will show between 15% and 39% more improvement with therapy three times per week instead of twice a week.
D)We know that 90% of all knee-surgery patients will show between 15% and 39% more improvement with therapy twice a week instead of three times per week.
E)We are 90% confident,based on the data,that patients who receive therapy three times per week show between 15% and 39% more improvement after one month than patients who receive therapy twice a week.
Unlock Deck
Unlock for access to all 52 flashcards in this deck.
Unlock Deck
k this deck
20
A researcher wishes to determine whether the proportion of Canadian women who smoke differs from the proportion of Canadian men who smoke.He wants to test the hypothesis
:
=
where
represents the proportion of Canadian women who smoke and
represents the proportion of Canadian men who smoke.He randomly selects 100 married couples.Among the 100 women in the sample are 21 smokers.Among the 100 men are 29 smokers.Are the assumptions for a two-sample z-test for two population proportions met? If not,which assumption is violated and why?
Unlock Deck
Unlock for access to all 52 flashcards in this deck.
Unlock Deck
k this deck
21
A marketing survey involves product recognition in Ontario and British Columbia.Of 558 Ontario residents surveyed,193 knew the product while 196 out of 614 British Columbia residents knew the product.At the 0.05 significance level,do the data provide sufficient evidence to conclude that the recognition rate in Ontario differs from the recognition rate in British Columbia?
Unlock Deck
Unlock for access to all 52 flashcards in this deck.
Unlock Deck
k this deck
22
A two-sample z-test for two population proportions is to be performed using the P-value approach.The null hypothesis is
:
=
and the alternative is
:
≠
.Use the given sample data to find the P-value for the hypothesis test.Give an interpretation of the p-value.
A poll reported that 3 out of 50 first year university students surveyed did not have jobs,while 7 out of 50 second year university students did not have jobs during the academic year.
A)P-value = 0.1836;If there is no difference in the proportions,there is about a 18.36% chance of seeing the observed difference or larger by natural sampling variation.
B)P-value = 0.0918;If there is no difference in the proportions,there is about a 9.18% chance of seeing the exact observed difference by natural sampling variation.
C)P-value = 0.0072;If there is no difference in the proportions,there is about a 0.72% chance of seeing the observed difference or larger by natural sampling variation.
D)P-value = 0.1836;There is about a 18.36% chance that the two proportions are equal.
E)P-value = 0.0613;There is about a 6.13% chance that the two proportions are equal.
:
=
and the alternative is
:
≠
.Use the given sample data to find the P-value for the hypothesis test.Give an interpretation of the p-value.
A poll reported that 3 out of 50 first year university students surveyed did not have jobs,while 7 out of 50 second year university students did not have jobs during the academic year.
A)P-value = 0.1836;If there is no difference in the proportions,there is about a 18.36% chance of seeing the observed difference or larger by natural sampling variation.
B)P-value = 0.0918;If there is no difference in the proportions,there is about a 9.18% chance of seeing the exact observed difference by natural sampling variation.
C)P-value = 0.0072;If there is no difference in the proportions,there is about a 0.72% chance of seeing the observed difference or larger by natural sampling variation.
D)P-value = 0.1836;There is about a 18.36% chance that the two proportions are equal.
E)P-value = 0.0613;There is about a 6.13% chance that the two proportions are equal.
Unlock Deck
Unlock for access to all 52 flashcards in this deck.
Unlock Deck
k this deck
23
A study investigated the smoking status of people in two age groups.Let
Represent the proportion of people aged 20-24 who are smokers.Let
Represent the proportion of people aged 25-29 who are smokers.A 95% confidence interval for the difference in smoking rates for
-
Was found to be (0.045,0.112).Give an interpretation of this confidence interval.
A)We know that 95% of the proportion of smokers aged 25-29 is between 4.5% and 11.2% lower than the proportion of smokers aged 20-24.
B)We know that 95% of all random samples done on the population will show that the proportion of smokers aged 20-24 is between 4.5% and 11.2% higher than the proportion of smokers aged 25-29.
C)We are 95% confident that the proportion of smokers aged 25-29 is between 4.5% and 11.2% higher than the proportion of smokers aged 20-24.
D)We know that 95% of the proportion of smokers aged 20-24 is between 4.5% and 11.2% more than the proportion of smokers aged 25-29.
E)We are 95% confident that the proportion of smokers aged 20-24 is between 4.5% and 11.2% higher than the proportion of smokers aged 25-29.
Unlock Deck
Unlock for access to all 52 flashcards in this deck.
Unlock Deck
k this deck
24
A two-sample z-test for two population proportions is to be performed using the P-value approach.The null hypothesis is
:
=
and the alternative is
:
≠
.Use the given sample data to find the P-value for the hypothesis test.Give an interpretation of the p-value.
A poll reported that 30% of 60 Canadians between the ages of 25 and 29 had started saving money for retirement.Of the 40 Canadians surveyed between the ages of 21 and 24,25% had started saving for retirement.
A)P-value = 0.5824;There is about a 58.24% chance that the two proportions are equal.
B)P-value = 0.1812;If there is no difference in the proportions,there is about a 18.12% chance of seeing the observed difference or larger by natural sampling variation.
C)P-value = 0.2912;There is about a 24.96% chance that the two proportions are equal.
D)P-value = 0.2912;If there is no difference in the proportions,there is about a 24.96% chance of seeing the exact observed difference by natural sampling variation.
E)P-value = 0.5824;If there is no difference in the proportions,there is about a 58.24% chance of seeing the observed difference or larger by natural sampling variation.
:
=
and the alternative is
:
≠
.Use the given sample data to find the P-value for the hypothesis test.Give an interpretation of the p-value.
A poll reported that 30% of 60 Canadians between the ages of 25 and 29 had started saving money for retirement.Of the 40 Canadians surveyed between the ages of 21 and 24,25% had started saving for retirement.
A)P-value = 0.5824;There is about a 58.24% chance that the two proportions are equal.
B)P-value = 0.1812;If there is no difference in the proportions,there is about a 18.12% chance of seeing the observed difference or larger by natural sampling variation.
C)P-value = 0.2912;There is about a 24.96% chance that the two proportions are equal.
D)P-value = 0.2912;If there is no difference in the proportions,there is about a 24.96% chance of seeing the exact observed difference by natural sampling variation.
E)P-value = 0.5824;If there is no difference in the proportions,there is about a 58.24% chance of seeing the observed difference or larger by natural sampling variation.
Unlock Deck
Unlock for access to all 52 flashcards in this deck.
Unlock Deck
k this deck
25
7 of 8,500 people vaccinated against a certain disease later developed the disease.18 of 10,000 people vaccinated with a placebo later developed the disease.Test the claim that the vaccine is effective in lowering the incidence of the disease.Use a significance level of 0.02.
Unlock Deck
Unlock for access to all 52 flashcards in this deck.
Unlock Deck
k this deck
26
Use the given sample data to test the claim that p1 > p2.Use a significance level of 0.01.
Unlock Deck
Unlock for access to all 52 flashcards in this deck.
Unlock Deck
k this deck
27
In a random sample of 360 women,65% watched CBC News.In a random sample of 220 men,60% watched CBC News.Test the claim that the proportion of women who watch CBC News is higher than the proportion of men who watch CBC News.Use a significance level of 0.05.
Unlock Deck
Unlock for access to all 52 flashcards in this deck.
Unlock Deck
k this deck
28
A new manager,hired at a large warehouse,was told to reduce the employee sick leave.The manager introduced a new incentive program for employees with perfect attendance.Suppose the proportion of the employees sick prior to the new program is
And the employees sick after the new program is
.A study found a 98% confidence interval for
-
Is (-0.0668,0.1125).Give an interpretation of this confidence interval.
A)We know that 98% of the employees sick after the new program is between 6.68% less and 11.25% more than the employees sick prior to the new program.
B)We are 98% confident that the proportion of the employees sick prior to the new program is between 6.68% less and 11.25% more than the proportion of the employees sick after the new program.
C)We know that 98% of all random samples done on the population will show that the proportion of the employees sick prior to the new program is between 6.68% less and 11.25% more than the proportion of the employees sick after the new program.
D)We know that 98% of the employees sick prior to the new program is between 6.68% less and 11.25% more than the employees sick after the new program.
E)We are 98% confident that the proportion of the employees sick after the new program is between 6.68% less and 11.25% more than the proportion of the employees sick prior to the new program.
Unlock Deck
Unlock for access to all 52 flashcards in this deck.
Unlock Deck
k this deck
29
A two-sample z-test for two population proportions is to be performed using the P-value approach.The null hypothesis is
:
=
and the alternative is
:
≠
.Use the given sample data to find the P-value for the hypothesis test.Give an interpretation of the p-value.
A weight loss centre in the city provided a weight loss for 152 out of 200 participants.A weight loss centre in the suburb provided a weight loss for 109 out of 140 participants.
A)P-value = 0.6892;If there is no difference in the proportions,there is about a 68.92% chance of seeing the observed difference or larger by natural sampling variation.
B)P-value = 0.6892;There is about a 68.92% chance that the two proportions are equal.
C)P-value = 0.3446;If there is no difference in the proportions,there is about a 34.46% chance of seeing the observed difference or larger by natural sampling variation.
D)P-value = 0.3446;There is about a 34.46% chance that the two proportions are equal.
E)P-value = 0.6554;If there is no difference in the proportions,there is about a 65.54% chance of seeing the observed difference or larger by natural sampling variation.
:
=
and the alternative is
:
≠
.Use the given sample data to find the P-value for the hypothesis test.Give an interpretation of the p-value.
A weight loss centre in the city provided a weight loss for 152 out of 200 participants.A weight loss centre in the suburb provided a weight loss for 109 out of 140 participants.
A)P-value = 0.6892;If there is no difference in the proportions,there is about a 68.92% chance of seeing the observed difference or larger by natural sampling variation.
B)P-value = 0.6892;There is about a 68.92% chance that the two proportions are equal.
C)P-value = 0.3446;If there is no difference in the proportions,there is about a 34.46% chance of seeing the observed difference or larger by natural sampling variation.
D)P-value = 0.3446;There is about a 34.46% chance that the two proportions are equal.
E)P-value = 0.6554;If there is no difference in the proportions,there is about a 65.54% chance of seeing the observed difference or larger by natural sampling variation.
Unlock Deck
Unlock for access to all 52 flashcards in this deck.
Unlock Deck
k this deck
30
A two-sample z-test for two population proportions is to be performed using the P-value approach.The null hypothesis is
:
=
and the alternative is
:
≠
.Use the given sample data to find the P-value for the hypothesis test.Give an interpretation of the p-value.
n1 = 50 n2 = 75
X1 = 20 x2 = 15
A)P-value = 0.0073;There is about a 0.73% chance that the two proportions are equal.
B)P-value = 0.0073;If there is no difference in the proportions,there is about a 0.73% chance of seeing the observed difference or larger by natural sampling variation.
C)P-value = 0.0037;If there is no difference in the proportions,there is a 0.37% chance of seeing the exact observed difference by natural sampling variation.
D)P-value = 0.0146;If there is no difference in the proportions,there is about a 1.46% chance of seeing the observed difference or larger by natural sampling variation.
E)P-value = 0.0146;There is about a 1.46% chance that the two proportions are equal.
:
=
and the alternative is
:
≠
.Use the given sample data to find the P-value for the hypothesis test.Give an interpretation of the p-value.
n1 = 50 n2 = 75
X1 = 20 x2 = 15
A)P-value = 0.0073;There is about a 0.73% chance that the two proportions are equal.
B)P-value = 0.0073;If there is no difference in the proportions,there is about a 0.73% chance of seeing the observed difference or larger by natural sampling variation.
C)P-value = 0.0037;If there is no difference in the proportions,there is a 0.37% chance of seeing the exact observed difference by natural sampling variation.
D)P-value = 0.0146;If there is no difference in the proportions,there is about a 1.46% chance of seeing the observed difference or larger by natural sampling variation.
E)P-value = 0.0146;There is about a 1.46% chance that the two proportions are equal.
Unlock Deck
Unlock for access to all 52 flashcards in this deck.
Unlock Deck
k this deck
31
A two-sample z-test for two population proportions is to be performed using the P-value approach.The null hypothesis is
:
=
and the alternative is
:
≠
.Use the given sample data to find the P-value for the hypothesis test.Give an interpretation of the p-value.
A new manager started a program on employee sick leave.The manager later compares the sick leave rate prior to the program starting (65 out of 250 employees were sick)to the sick leave rate one month into the program (55 out of 253 employees were sick).
A)P-value = 0.1314;There is about a 13.14% chance that the two proportions are equal.
B)P-value = 0.2628;There is about a 26.28% chance that the two proportions are equal.
C)P-value = 0.7372;If there is no difference in the proportions,there is about a 73.72% chance of seeing the observed difference or larger by natural sampling variation.
D)P-value = 0.1314;If there is no difference in the proportions,there is about a 13.14% chance of seeing the observed difference or larger by natural sampling variation.
E)P-value = 0.2628;If there is no difference in the proportions,there is about a 26.28% chance of seeing the observed difference or larger by natural sampling variation.
:
=
and the alternative is
:
≠
.Use the given sample data to find the P-value for the hypothesis test.Give an interpretation of the p-value.
A new manager started a program on employee sick leave.The manager later compares the sick leave rate prior to the program starting (65 out of 250 employees were sick)to the sick leave rate one month into the program (55 out of 253 employees were sick).
A)P-value = 0.1314;There is about a 13.14% chance that the two proportions are equal.
B)P-value = 0.2628;There is about a 26.28% chance that the two proportions are equal.
C)P-value = 0.7372;If there is no difference in the proportions,there is about a 73.72% chance of seeing the observed difference or larger by natural sampling variation.
D)P-value = 0.1314;If there is no difference in the proportions,there is about a 13.14% chance of seeing the observed difference or larger by natural sampling variation.
E)P-value = 0.2628;If there is no difference in the proportions,there is about a 26.28% chance of seeing the observed difference or larger by natural sampling variation.
Unlock Deck
Unlock for access to all 52 flashcards in this deck.
Unlock Deck
k this deck
32
A two-sample z-test for two population proportions is to be performed using the P-value approach.The null hypothesis is
:
=
and the alternative is
:
≠
.Use the given sample data to find the P-value for the hypothesis test.Give an interpretation of the p-value.
n1 = 200 n2 = 100
X1 = 11 x2 = 8
A)P-value = 0.2005;There is about a 20.05% chance that the two proportions are equal
B)P-value = 0.401;There is about a 40.1% chance that the two proportions are equal.
C)P-value = 0.401;If there is no difference in the proportions,there is about a 40.1% chance of seeing the observed difference or larger by natural sampling variation.
D)P-value = 0.2005;If there is no difference in the proportions,there is about a 20.05% chance of seeing the observed difference or larger by natural sampling variation.
E)P-value = 0.401;If there is a difference in the proportions,there is a 40.1% chance of seeing the observed difference by natural sampling variation.
:
=
and the alternative is
:
≠
.Use the given sample data to find the P-value for the hypothesis test.Give an interpretation of the p-value.
n1 = 200 n2 = 100
X1 = 11 x2 = 8
A)P-value = 0.2005;There is about a 20.05% chance that the two proportions are equal
B)P-value = 0.401;There is about a 40.1% chance that the two proportions are equal.
C)P-value = 0.401;If there is no difference in the proportions,there is about a 40.1% chance of seeing the observed difference or larger by natural sampling variation.
D)P-value = 0.2005;If there is no difference in the proportions,there is about a 20.05% chance of seeing the observed difference or larger by natural sampling variation.
E)P-value = 0.401;If there is a difference in the proportions,there is a 40.1% chance of seeing the observed difference by natural sampling variation.
Unlock Deck
Unlock for access to all 52 flashcards in this deck.
Unlock Deck
k this deck
33
A two-sample z-test for two population proportions is to be performed using the P-value approach.The null hypothesis is
:
=
and the alternative is
:
≠
.Use the given sample data to find the P-value for the hypothesis test.Give an interpretation of the p-value.
A university found it retained 25 students out of 352 in 2009 and 36 students out of 334 in 2010.
A)P-value = 0.0455;If there is no difference in the proportions,there is about a 4.55% chance of seeing the observed difference or larger by natural sampling variation.
B)P-value = 0.9545;If there is no difference in the proportions,there is about a 95.45% chance of seeing the observed difference or larger by natural sampling variation.
C)P-value = 0.0455;There is about a 4.55% chance that the two proportions are equal.
D)P-value = 0.091;There is about a 9.1% chance that the two proportions are equal.
E)P-value = 0.091;If there is no difference in the proportions,there is about a 9.1% chance of seeing the observed difference or larger by natural sampling variation.
:
=
and the alternative is
:
≠
.Use the given sample data to find the P-value for the hypothesis test.Give an interpretation of the p-value.
A university found it retained 25 students out of 352 in 2009 and 36 students out of 334 in 2010.
A)P-value = 0.0455;If there is no difference in the proportions,there is about a 4.55% chance of seeing the observed difference or larger by natural sampling variation.
B)P-value = 0.9545;If there is no difference in the proportions,there is about a 95.45% chance of seeing the observed difference or larger by natural sampling variation.
C)P-value = 0.0455;There is about a 4.55% chance that the two proportions are equal.
D)P-value = 0.091;There is about a 9.1% chance that the two proportions are equal.
E)P-value = 0.091;If there is no difference in the proportions,there is about a 9.1% chance of seeing the observed difference or larger by natural sampling variation.
Unlock Deck
Unlock for access to all 52 flashcards in this deck.
Unlock Deck
k this deck
34
Use the given sample data to test the claim that p1 < p2.Use a significance level of 0.10.
n1 = 462 n2 = 380
x1 = 84 x2 = 95
n1 = 462 n2 = 380
x1 = 84 x2 = 95
Unlock Deck
Unlock for access to all 52 flashcards in this deck.
Unlock Deck
k this deck
35
Suppose the proportion of people losing weight at a city weight loss centre is
And the proportion of people losing weight at a suburban weight loss centre is
.A study found a 98% confidence interval for
-
Is (-0.1263,0.0891).Give an interpretation of this confidence interval.
A)We are 98% confident that the proportion of people losing weight at the city weight loss centre is between 12.63% less and 8.91% more than the proportion of people losing weight at the suburban weight loss centre.
B)We know that 98% of the people at the suburban weight loss centre lost between 12.63% less and 8.91% more than the people at the city weight loss centre.
C)We know that 98% of all random samples done on the population will show that the proportion of people losing weight at the city weight loss centre is between 12.63% less and 8.91% more than the proportion of people losing weight at the suburban weight loss centre.
D)We are 98% confident that the proportion of people losing weight at the suburban weight loss centre is between 12.63% less and 8.91% more than the proportion of people losing weight at the city weight loss centre.
E)We know that 98% of the people at the city weight loss centre lost between 12.63% less and 8.91% more than the people at the suburban weight loss centre.
Unlock Deck
Unlock for access to all 52 flashcards in this deck.
Unlock Deck
k this deck
36
A two-sample z-test for two population proportions is to be performed using the P-value approach.The null hypothesis is
:
=
and the alternative is
:
≠
.Use the given sample data to find the P-value for the hypothesis test.Give an interpretation of the p-value.
A poll reported that 41 of 100 men surveyed were in favour of increased security at airports,while 35 of 140 women were in favour of increased security.
A)P-value = 0.0512;If there is no difference in the proportions,there is about a 5.12% chance of seeing the observed difference or larger by natural sampling variation.
B)P-value = 0.0512;There is about a 5.12% chance that the two proportions are equal.
C)P-value = 0.4211;If there is no difference in the proportions,there is a 42.11% chance of seeing the exact observed difference by natural sampling variation.
D)P-value = 0.0086;There is about a 0.86% chance that the two proportions are equal.
E)P-value = 0.0086;If there is no difference in the proportions,there is about a 0.86% chance of seeing the observed difference or larger by natural sampling variation.
:
=
and the alternative is
:
≠
.Use the given sample data to find the P-value for the hypothesis test.Give an interpretation of the p-value.
A poll reported that 41 of 100 men surveyed were in favour of increased security at airports,while 35 of 140 women were in favour of increased security.
A)P-value = 0.0512;If there is no difference in the proportions,there is about a 5.12% chance of seeing the observed difference or larger by natural sampling variation.
B)P-value = 0.0512;There is about a 5.12% chance that the two proportions are equal.
C)P-value = 0.4211;If there is no difference in the proportions,there is a 42.11% chance of seeing the exact observed difference by natural sampling variation.
D)P-value = 0.0086;There is about a 0.86% chance that the two proportions are equal.
E)P-value = 0.0086;If there is no difference in the proportions,there is about a 0.86% chance of seeing the observed difference or larger by natural sampling variation.
Unlock Deck
Unlock for access to all 52 flashcards in this deck.
Unlock Deck
k this deck
37
Suppose that Statistics Canada wants to compare the current unemployment rate between Montreal and Toronto.Let
And
Represent the current unemployment rates in Montreal and the current A study found a 90% confidence interval for
-
Is (-0.0457,0.0424).Give an interpretation of this confidence interval.
A)We are 90% confident that the unemployment rate in Toronto is between 4.57% less and 4.24% more than the unemployment rate in Montreal.
B)We know that 90% of the unemployment rate in Toronto is between 4.57% less and 4.24% more than the unemployment rate in Montreal.
C)We are 90% confident that the unemployment rate in Montreal is between 4.57% less and 4.24% more than the unemployment rate in Toronto.
D)We know that 90% of the unemployment rate in Montreal is between 4.57% less and 4.24% more than the unemployment rate in Toronto.
E)We know that 90% of all random samples done on the population will show that the unemployment rate in Montreal is between 4.57% less and 4.24% more than the unemployment rate in Toronto.
Unlock Deck
Unlock for access to all 52 flashcards in this deck.
Unlock Deck
k this deck
38
A two-sample z-test for two population proportions is to be performed using the P-value approach.The null hypothesis is
:
=
and the alternative is
:
≠
.Use the given sample data to find the P-value for the hypothesis test.Give an interpretation of the p-value.
In City A,7420 people are unemployed in a random sample of 143000 people.In City B,7642 people are unemployed in a random sample of 142000 people.
A)P-value = 0.0214;If there is no difference in the proportions,there is about a 2.14% chance of seeing the observed difference or larger by natural sampling variation.
B)P-value = 0.0107;If there is no difference in the proportions,there is about a 1.07% chance of seeing the observed difference or larger by natural sampling variation.
C)P-value = 0.0214;There is about a 2.14% chance that the two proportions are equal.
D)P-value = 0.0107;There is about a 1.07% chance that the two proportions are equal.
E)P-value = 0.9893;If there is no difference in the proportions,there is about a 98.93% chance of seeing the observed difference or larger by natural sampling variation.
:
=
and the alternative is
:
≠
.Use the given sample data to find the P-value for the hypothesis test.Give an interpretation of the p-value.
In City A,7420 people are unemployed in a random sample of 143000 people.In City B,7642 people are unemployed in a random sample of 142000 people.
A)P-value = 0.0214;If there is no difference in the proportions,there is about a 2.14% chance of seeing the observed difference or larger by natural sampling variation.
B)P-value = 0.0107;If there is no difference in the proportions,there is about a 1.07% chance of seeing the observed difference or larger by natural sampling variation.
C)P-value = 0.0214;There is about a 2.14% chance that the two proportions are equal.
D)P-value = 0.0107;There is about a 1.07% chance that the two proportions are equal.
E)P-value = 0.9893;If there is no difference in the proportions,there is about a 98.93% chance of seeing the observed difference or larger by natural sampling variation.
Unlock Deck
Unlock for access to all 52 flashcards in this deck.
Unlock Deck
k this deck
39
A researcher finds that of 1,000 people who said that they attend a religious service at least once a week,31 stopped to help a person with car trouble.Of 1,200 people interviewed who had not attended a religious service at least once a month,22 stopped to help a person with car trouble.At the 0.05 significance level,do the data provide sufficient evidence to conclude that the two proportions are different?
Unlock Deck
Unlock for access to all 52 flashcards in this deck.
Unlock Deck
k this deck
40
In a random sample of 500 people aged 20-24,22% were smokers.In a random sample of 450 people aged 25-29,14% were smokers.Do the data provide sufficient evidence to conclude that the proportion of smokers in the 20-24 age group is different from the proportion of smokers in the 25-29 age group? Use a significance level of 0.01.
Unlock Deck
Unlock for access to all 52 flashcards in this deck.
Unlock Deck
k this deck
41
A poll checking on the level of public support for a tax increase reported that 19% of the respondents were in favour.The pollsters reported a sampling error of ±5%.When the responses were broken down by gender,support was 3% higher among women than men.The pollsters said the margin of error for this difference was ±6%.Why is the margin of error larger for the difference in support between the genders than for the overall level of support?
Unlock Deck
Unlock for access to all 52 flashcards in this deck.
Unlock Deck
k this deck
42
You wish to construct a 90% confidence interval to compare two proportions.If we wish to obtain a margin of error of at most 0.04,what sample size should we take from each group? Assume equal sample sizes.
A)423
B)846
C)1984
D)845
E)422
A)423
B)846
C)1984
D)845
E)422
Unlock Deck
Unlock for access to all 52 flashcards in this deck.
Unlock Deck
k this deck
43
Suppose that you perform a two-proportion z-test and reject the null hypothesis that there is no difference in the two proportions.If that conclusion is actually wrong,which type of error did you commit?
Unlock Deck
Unlock for access to all 52 flashcards in this deck.
Unlock Deck
k this deck
44
Suppose the proportion of first year students at a particular university who purchased used textbooks in the past year is
and the proportion of second year students at the university who purchased used textbooks in the past year is
.A study found a 95% confidence interval for
-
is (0.237,0.421).Does this interval suggest that first year students are more likely than second year students to buy used textbooks? Explain.
and the proportion of second year students at the university who purchased used textbooks in the past year is
.A study found a 95% confidence interval for
-
is (0.237,0.421).Does this interval suggest that first year students are more likely than second year students to buy used textbooks? Explain.
Unlock Deck
Unlock for access to all 52 flashcards in this deck.
Unlock Deck
k this deck
45
A two-sample z-test for two population proportions is to be performed using the P-value approach.The null hypothesis is
:
=
and the alternative is
:
≠
.Use the given sample data to find the P-value for the hypothesis test.Give an interpretation of the p-value.
A study investigated the smoking status of people in two age groups.A random sample of 100 people aged 20-24 revealed 24 who are smokers.A random sample of 120 people aged 25-29 revealed 15 who are smokers.
A)P-value = 0.0132;If there is no difference in the proportions,there is about a 1.32% chance of seeing the observed difference or larger by natural sampling variation.
B)P-value = 0.0264;If there is no difference in the proportions,there is about a 2.64% chance of seeing the observed difference or larger by natural sampling variation.
C)P-value = 0.9736;If there is no difference in the proportions,there is about a 97.36% chance of seeing the observed difference or larger by natural sampling variation.
D)P-value = 0.0264;There is about a 2.64% chance that the two proportions are equal.
E)P-value = 0.0132;There is about a 1.32% chance that the two proportions are equal.
:
=
and the alternative is
:
≠
.Use the given sample data to find the P-value for the hypothesis test.Give an interpretation of the p-value.
A study investigated the smoking status of people in two age groups.A random sample of 100 people aged 20-24 revealed 24 who are smokers.A random sample of 120 people aged 25-29 revealed 15 who are smokers.
A)P-value = 0.0132;If there is no difference in the proportions,there is about a 1.32% chance of seeing the observed difference or larger by natural sampling variation.
B)P-value = 0.0264;If there is no difference in the proportions,there is about a 2.64% chance of seeing the observed difference or larger by natural sampling variation.
C)P-value = 0.9736;If there is no difference in the proportions,there is about a 97.36% chance of seeing the observed difference or larger by natural sampling variation.
D)P-value = 0.0264;There is about a 2.64% chance that the two proportions are equal.
E)P-value = 0.0132;There is about a 1.32% chance that the two proportions are equal.
Unlock Deck
Unlock for access to all 52 flashcards in this deck.
Unlock Deck
k this deck
46
You wish to construct a 95% confidence interval to compare two proportions.If we wish to obtain a margin of error of at most 0.05,what sample size should we take from each group? Assume equal sample sizes.
A)769
B)1984
C)768
D)385
E)384
A)769
B)1984
C)768
D)385
E)384
Unlock Deck
Unlock for access to all 52 flashcards in this deck.
Unlock Deck
k this deck
47
You wish to construct a 90% confidence interval to compare two proportions.If we wish to obtain a margin of error of at most 0.05,what sample size should we take from each group? Assume equal sample sizes.
A)1984
B)271
C)270
D)542
E)541
A)1984
B)271
C)270
D)542
E)541
Unlock Deck
Unlock for access to all 52 flashcards in this deck.
Unlock Deck
k this deck
48
You wish to construct a 95% confidence interval to compare two proportions.If we wish to obtain a margin of error of at most 0.03,what sample size should we take from each group? Assume equal sample sizes.
A)1067
B)2134
C)2135
D)1068
E)1984
A)1067
B)2134
C)2135
D)1068
E)1984
Unlock Deck
Unlock for access to all 52 flashcards in this deck.
Unlock Deck
k this deck
49
Suppose the proportion of women who follow a regular exercise program is
and the proportion of men who follow a regular exercise program is
.A study found a 98% confidence interval for
-
is (-0.022,0.111).Does this study provide strong evidence of a gender-based difference in exercise? Explain.
and the proportion of men who follow a regular exercise program is
.A study found a 98% confidence interval for
-
is (-0.022,0.111).Does this study provide strong evidence of a gender-based difference in exercise? Explain.
Unlock Deck
Unlock for access to all 52 flashcards in this deck.
Unlock Deck
k this deck
50
You wish to construct a 90% confidence interval to compare two proportions.If we wish to obtain a margin of error of at most 0.03,what sample size should we take from each group? Assume equal sample sizes.
A)752
B)1504
C)1503
D)751
E)1984
A)752
B)1504
C)1503
D)751
E)1984
Unlock Deck
Unlock for access to all 52 flashcards in this deck.
Unlock Deck
k this deck
51
You wish to construct a 95% confidence interval to compare two proportions.If we wish to obtain a margin of error of at most 0.04,what sample size should we take from each group? Assume equal sample sizes.
A)1984
B)1201
C)601
D)1200
E)600
A)1984
B)1201
C)601
D)1200
E)600
Unlock Deck
Unlock for access to all 52 flashcards in this deck.
Unlock Deck
k this deck
52
A Member of Parliament wants to measure the level of support in his area for campaign finance reform and determine if there is a gender gap among voters with respect to this issue.One aide suggests that they find separate confidence intervals for the percent of men and the percent of women who favour reform and then see if the intervals overlap.Another aide suggests that they find a confidence interval for the difference in the proportions of men and women who favour reform.Which is the correct approach? Why?
Unlock Deck
Unlock for access to all 52 flashcards in this deck.
Unlock Deck
k this deck
Unlock Deck
Unlock for access to all 52 flashcards in this deck.


