Deck 22: Inferences About Means
Full screen (f)
Question
Question
Question
Question
Question
Question
Question
Question
Question
Question
Question
Question
Question
Question
Question
Question
Question
Question
Question
Question
Question
Question
Question
The football coach at a university randomly selected ten players and timed how long each player took to perform a certain drill.The times (in minutes)were: 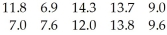
Determine a 95% confidence interval for the mean time for all players.
A)(12.57,12.67)
B)(8.57,12.57)
C)(8.57,12.67)
D)(8.47,12.67)
E)(8.47,12.57)
Determine a 95% confidence interval for the mean time for all players.
A)(12.57,12.67)
B)(8.57,12.57)
C)(8.57,12.67)
D)(8.47,12.67)
E)(8.47,12.57)
Question
Question
The principal of a high school randomly selected six students to take an aptitude test.Their scores were: 
Determine a 90% confidence interval for the mean score for all students.
A)(74.39,82.94)
B)(82.94,82.94)
C)(83.04,74.39)
D)(74.49,82.94)
E)(82.94,83.04)
Determine a 90% confidence interval for the mean score for all students.
A)(74.39,82.94)
B)(82.94,82.94)
C)(83.04,74.39)
D)(74.49,82.94)
E)(82.94,83.04)
Question
Question
Question
Question
Question
Question
Question
Question
The amounts (in millilitres)of juice in eight randomly selected juice bottles are: 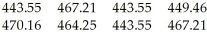
Construct a 98% confidence interval for the mean amount of juice in all such bottles.
A)(468.09,471.05)
B)(441.48,471.05)
C)(443.28,468.96)
D)(468.09,482.22)
E)(441.48,468.09)
Construct a 98% confidence interval for the mean amount of juice in all such bottles.
A)(468.09,471.05)
B)(441.48,471.05)
C)(443.28,468.96)
D)(468.09,482.22)
E)(441.48,468.09)
Question
Question
Question
Question
Question
Question
Question
Question
Question
Question
Question
Question
Question
A random sample of 30 households was selected from a particular neighborhood.The number of cars for each household is shown below.Estimate the mean number of cars per household for the population of households in this neighborhood.Give the 95% confidence interval. 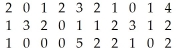
A)(1.5,2)
B)(1,2)
C)(1.5,1.7)
D)(1.3,1.7)
E)(0.9,2.1)
A)(1.5,2)
B)(1,2)
C)(1.5,1.7)
D)(1.3,1.7)
E)(0.9,2.1)
Question
A random sample of 30 long distance runners aged 20-25 was selected from a running club.The resting heart rates (in beats per minute)of the runners are shown below.Estimate the mean resting heart rate for the population of long distance runners aged 20-25.Give the 95% confidence interval. 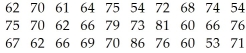
A)(65.1,71.1)
B)(64.1,70.1)
C)(64.0,72.2)
D)(62.9,73.0)
E)(62.9,72.2)
A)(65.1,71.1)
B)(64.1,70.1)
C)(64.0,72.2)
D)(62.9,73.0)
E)(62.9,72.2)
Question
Question
Question
Question
Question
Question
Question
You are considering moving to Richmond Hill,and are concerned about the average one-way commute time to downtown Toronto.Does the average one-way commute time exceed 25 minutes? You take a random sample of 50 Richmond Hill residents and find an average commute time of 29 minutes with a standard deviation of 7 minutes.
A)
B)
C)
D)
E)
A)
B)
C)
D)
E)
Question
Question
Question
Question
Question
Question
You want to see if the number of minutes cell phone users use each month has changed from its mean of 120 minutes 2 years ago.You take a random sample of 100 cell phone users and find an average of 135 minutes used.
A)
B)
C)
D)
E)
A)
B)
C)
D)
E)
Question
A consumer advocacy group thinks that reduced-fat cookies contain more fat than claimed.They test the hypothesis 
: μ = 2.5 grams against
: μ > 2.5 grams.
A)Upper-tailed
B)Two-tailed
C)Lower-tailed
: μ = 2.5 grams against
: μ > 2.5 grams.
A)Upper-tailed
B)Two-tailed
C)Lower-tailed
Question
Question
Question
Question
In the past,the mean battery life for a certain type of flashlight battery has been 8.8 hours.The manufacturer has introduced a change in the production method and wants to perform a hypothesis test to determine whether the mean battery life has increased as a result.The hypotheses are: 
Explain the result of a Type I error.
A)The manufacturer will decide the mean battery life is 8.8 hours when in fact it is greater than 8.8 hours.
B)The manufacturer will decide the mean battery life is 9.6 hours greater than it was prior to the change in the production method.
C)The manufacturer will decide the mean battery life is 9.6 hours lower than it was prior to the change in the production method.
D)The manufacturer will decide the mean battery life is greater than 8.8 hours when in fact it is greater than 8.8 hours .
E)The manufacturer will decide the mean battery life is greater than 8.8 hours when in fact it is 8.8 hours.
Question
Question
Question
Question
Are Canadians getting fatter? Researchers interested in this question take a random sample of 500 people and record an average weight of 190 pounds.Ten years ago,the average weight was 185 pounds.
A)
B)
C)
D)
E)
A)
B)
C)
D)
E)
Question
Has the introduction of more music download services changed the number of university students that download music for free from the internet? Two years ago,approximately 50,000 university students admitted to downloading music for free from the internet.
A)
B)
C)
D)
E)
A)
B)
C)
D)
E)
Question
Suzie has installed a new spam blocker program on her email.She used to receive an average of 20 spam emails a day.Is the new program working?
A)
B)
C)
D)
E)
A)
B)
C)
D)
E)
Question
Question
Question
Question
Question
Quality control engineers are trying to improve the number of unpopped kernels in their company's microwave popcorn.Changes to the oil have recently been made,so the engineers are testing the hypothesis 
: μ = 25 against
: μ < 25.
A)Upper-tailed
B)Two-sided
C)Lower-tailed
: μ = 25 against
: μ < 25.
A)Upper-tailed
B)Two-sided
C)Lower-tailed
Question
Question
In the past,the mean battery life for a certain type of flashlight battery has been 9.5 hours.The manufacturer has introduced a change in the production method and wants to perform a hypothesis test to determine whether the mean battery life has increased as a result.The hypotheses are: 
: μ = 9.5 hours
: μ > 9.5 hours
Explain the result of a Type II error.
A)The manufacturer will not decide the mean battery life is greater than 9.5 hours when in fact it is greater than 9.5 hours.
B)The manufacturer will decide the mean battery life is greater than 9.5 hours when in fact it is 9.5 hours.
C)The manufacturer will decide the mean battery life is greater than 9.5 hours when in fact it is greater than 9.5 hours.
D)The manufacturer will decide the mean battery life is 9.6 hours lower than it was prior to the change in the production method.
E)The manufacturer will decide the mean battery life is 8.1 hours greater than it was prior to the change in the production method.
Question
Question

Unlock Deck
Sign up to unlock the cards in this deck!
Unlock Deck
Unlock Deck
1/106
Play
Full screen (f)
Deck 22: Inferences About Means
1
P-value for t ≥ 2.13 for a sample of size 31
A)0.0520
B)0.0207
C)0.9793
D)0.0087
E)0.0347
A)0.0520
B)0.0207
C)0.9793
D)0.0087
E)0.0347
0.0207
2
P-value for |t| > 1.44 with 45 degrees of freedom
A)0.1568
B)0.9215
C)0.0808
D)0.0785
E)0.1916
A)0.1568
B)0.9215
C)0.0808
D)0.0785
E)0.1916
0.1568
3
95% confidence interval with df = 15
A)2.131
B)2.120
C)2.145
D)1.753
E)1.960
A)2.131
B)2.120
C)2.145
D)1.753
E)1.960
2.131
4
P-value for t ≤ 2.13 for a sample of size 31
A)0.9913
B)0.0207
C)0.9480
D)0.9793
E)0.9653
A)0.9913
B)0.0207
C)0.9480
D)0.9793
E)0.9653
Unlock Deck
Unlock for access to all 106 flashcards in this deck.
Unlock Deck
k this deck
5
P-value for t ≤ 1.44 with 45 degrees of freedom
A)0.0785
B)0.8431
C)0.1569
D)0.8914
E)0.9216
A)0.0785
B)0.8431
C)0.1569
D)0.8914
E)0.9216
Unlock Deck
Unlock for access to all 106 flashcards in this deck.
Unlock Deck
k this deck
6
You want to determine if the average gas price in your city has exceeded $1.30 per litre for regular unleaded gasoline.You take a random sample of prices from 8 gas stations ,recording the following prices: $1.33,$1.30,$1.05,$1.29,$1.37,$1.32,$1.30,$1.31.Have the conditions and assumptions for inference been met?
A)No,the nearly normal condition is not met.
B)No,the sample is not random.
C)No,the sample is not representative.
D)Yes,all conditions and assumptions have been met.
E)No,the sample is more than 10% of the population.
A)No,the nearly normal condition is not met.
B)No,the sample is not random.
C)No,the sample is not representative.
D)Yes,all conditions and assumptions have been met.
E)No,the sample is more than 10% of the population.
Unlock Deck
Unlock for access to all 106 flashcards in this deck.
Unlock Deck
k this deck
7
A 99% confidence interval from a sample of size 41
A)2.423
B)2.576
C)2.690
D)2.725
E)2.704
A)2.423
B)2.576
C)2.690
D)2.725
E)2.704
Unlock Deck
Unlock for access to all 106 flashcards in this deck.
Unlock Deck
k this deck
8
A 95% confidence interval with df = 29
A)2.042
B)2.462
C)2.048
D)1.960
E)2.045
A)2.042
B)2.462
C)2.048
D)1.960
E)2.045
Unlock Deck
Unlock for access to all 106 flashcards in this deck.
Unlock Deck
k this deck
9
80% confidence interval with df = 11
A)1.280
B)1.372
C)2.718
D)1.356
E)1.363
A)1.280
B)1.372
C)2.718
D)1.356
E)1.363
Unlock Deck
Unlock for access to all 106 flashcards in this deck.
Unlock Deck
k this deck
10
P-value for |t| ≥ 2.13 for a sample of size 31
A)0.1040
B)0.0694
C)0.0174
D)0.9793
E)0.0415
A)0.1040
B)0.0694
C)0.0174
D)0.9793
E)0.0415
Unlock Deck
Unlock for access to all 106 flashcards in this deck.
Unlock Deck
k this deck
11
P-value for |t| > 1.76 with 24 degrees of freedom
A)0.0781
B)0.1562
C)0.0911
D)0.9544
E)0.0456
A)0.0781
B)0.1562
C)0.0911
D)0.9544
E)0.0456
Unlock Deck
Unlock for access to all 106 flashcards in this deck.
Unlock Deck
k this deck
12
P-value for t ≤ 1.76 with 24 degrees of freedom
A)0.9772
B)0.0228
C)0.9544
D)0.9088
E)0.0456
A)0.9772
B)0.0228
C)0.9544
D)0.9088
E)0.0456
Unlock Deck
Unlock for access to all 106 flashcards in this deck.
Unlock Deck
k this deck
13
A 98% confidence interval with 9 degrees of freedom.
A)2.326
B)2.764
C)2.896
D)2.821
E)2.262
A)2.326
B)2.764
C)2.896
D)2.821
E)2.262
Unlock Deck
Unlock for access to all 106 flashcards in this deck.
Unlock Deck
k this deck
14
98% confidence interval with df = 20
A)2.518
B)1.325
C)2.539
D)2.330
E)2.528
A)2.518
B)1.325
C)2.539
D)2.330
E)2.528
Unlock Deck
Unlock for access to all 106 flashcards in this deck.
Unlock Deck
k this deck
15
An 80% confidence interval from a sample of size 8
A)1.895
B)1.282
C)1.383
D)1.415
E)1.397
A)1.895
B)1.282
C)1.383
D)1.415
E)1.397
Unlock Deck
Unlock for access to all 106 flashcards in this deck.
Unlock Deck
k this deck
16
A 90% confidence interval from a sample of size 20.
A)1.729
B)1.734
C)1.645
D)1.725
E)2.093
A)1.729
B)1.734
C)1.645
D)1.725
E)2.093
Unlock Deck
Unlock for access to all 106 flashcards in this deck.
Unlock Deck
k this deck
17
99% confidence interval with df = 24
A)1.711
B)2.779
C)2.492
D)2.807
E)2.797
A)1.711
B)2.779
C)2.492
D)2.807
E)2.797
Unlock Deck
Unlock for access to all 106 flashcards in this deck.
Unlock Deck
k this deck
18
P-value for t ≥ 1.76 with 24 degrees of freedom
A)0.9544
B)0.0456
C)0.0228
D)0.0592
E)0.0912
A)0.9544
B)0.0456
C)0.0228
D)0.0592
E)0.0912
Unlock Deck
Unlock for access to all 106 flashcards in this deck.
Unlock Deck
k this deck
19
90% confidence interval with df = 4.
A)2.353
B)1.645
C)4.604
D)2.132
E)1.533
A)2.353
B)1.645
C)4.604
D)2.132
E)1.533
Unlock Deck
Unlock for access to all 106 flashcards in this deck.
Unlock Deck
k this deck
20
P-value for t ≥ 1.44 with 45 degrees of freedom
A)0.9215
B)0.0784
C)0.1569
D)0.0915
E)0.9085
A)0.9215
B)0.0784
C)0.1569
D)0.0915
E)0.9085
Unlock Deck
Unlock for access to all 106 flashcards in this deck.
Unlock Deck
k this deck
21
Thirty randomly selected students took the calculus final.If the sample mean was 91 and the standard deviation was 11.7,construct a 99% confidence interval for the mean score of all students.
A)(87.37,94.63)
B)(85.13,96.87)
C)(85.74,96.26)
D)(85.11,96.89)
E)(87.37,96.87)
A)(87.37,94.63)
B)(85.13,96.87)
C)(85.74,96.26)
D)(85.11,96.89)
E)(87.37,96.87)
Unlock Deck
Unlock for access to all 106 flashcards in this deck.
Unlock Deck
k this deck
22
A bank needs information concerning the checking account balances of its local customers.A random sample of 14 accounts was checked and yielded a mean balance of $664.14 and a standard deviation of $297.29.Find a 98% confidence interval for the true mean checking account balance for local customers.
A)($492.52,$835.76)
B)($493.71,$834.57)
C)($455.65,$872.63)
D)($453.56,$874.72)
E)($455.65,$835.76)
A)($492.52,$835.76)
B)($493.71,$834.57)
C)($455.65,$872.63)
D)($453.56,$874.72)
E)($455.65,$835.76)
Unlock Deck
Unlock for access to all 106 flashcards in this deck.
Unlock Deck
k this deck
23
The football coach at a university randomly selected ten players and timed how long each player took to perform a certain drill.The times (in minutes)were:
Determine a 95% confidence interval for the mean time for all players.
A)(12.57,12.67)
B)(8.57,12.57)
C)(8.57,12.67)
D)(8.47,12.67)
E)(8.47,12.57)
Determine a 95% confidence interval for the mean time for all players.
A)(12.57,12.67)
B)(8.57,12.57)
C)(8.57,12.67)
D)(8.47,12.67)
E)(8.47,12.57)
Unlock Deck
Unlock for access to all 106 flashcards in this deck.
Unlock Deck
k this deck
24
How tall is your average statistics classmate? To determine this,you measure the height of a random sample of 15 of your 200 fellow students,finding a mean height of 166.6 cm and a standard deviation of 5.64 cm.Construct a 90% confidence interval for the mean height of your classmates.
A)(163.73,169.27)
B)(164.04,169.16)
C)(165.992,167.01)
D)(164.02,168.98)
E)(164.91,1 70.09)
A)(163.73,169.27)
B)(164.04,169.16)
C)(165.992,167.01)
D)(164.02,168.98)
E)(164.91,1 70.09)
Unlock Deck
Unlock for access to all 106 flashcards in this deck.
Unlock Deck
k this deck
25
The principal of a high school randomly selected six students to take an aptitude test.Their scores were:
Determine a 90% confidence interval for the mean score for all students.
A)(74.39,82.94)
B)(82.94,82.94)
C)(83.04,74.39)
D)(74.49,82.94)
E)(82.94,83.04)
Determine a 90% confidence interval for the mean score for all students.
A)(74.39,82.94)
B)(82.94,82.94)
C)(83.04,74.39)
D)(74.49,82.94)
E)(82.94,83.04)
Unlock Deck
Unlock for access to all 106 flashcards in this deck.
Unlock Deck
k this deck
26
An independent laboratory tests 100 light bulbs,finding that the mean life is 103 hours with a standard deviation of 11 hours.Decide whether or not the conditions and assumptions for inference with a t-test are satisfied.Explain your answer.
Unlock Deck
Unlock for access to all 106 flashcards in this deck.
Unlock Deck
k this deck
27
A sample of 51 statistics students at a large university had a mean final exam score of 76 with a standard deviation of 4.Find a 95% confidence interval for the mean final exam score for all statistics students at this university.
A)(75.6,76.1)
B)(75.6,76.4)
C)(79.4,82.6)
D)(74.9,77.1)
E)(75.9,76.1)
A)(75.6,76.1)
B)(75.6,76.4)
C)(79.4,82.6)
D)(74.9,77.1)
E)(75.9,76.1)
Unlock Deck
Unlock for access to all 106 flashcards in this deck.
Unlock Deck
k this deck
28
A researcher wants to estimate the mean cholesterol level of people in his city.He sets up a walk-in clinic,and measures the cholesterol of 85 people,finding a mean level of 224 and a standard deviation of 8.Have the conditions and assumptions for inference been met?
A)No,the sample does not meet the Nearly Normal condition.
B)No,the sample is more than 10% of the population.
C)Yes,all conditions and assumptions have been met.
D)No,the the sample data is likely to be skewed.
E)No,the sample is not random.
A)No,the sample does not meet the Nearly Normal condition.
B)No,the sample is more than 10% of the population.
C)Yes,all conditions and assumptions have been met.
D)No,the the sample data is likely to be skewed.
E)No,the sample is not random.
Unlock Deck
Unlock for access to all 106 flashcards in this deck.
Unlock Deck
k this deck
29
How much fat do reduced fat cookies typically have? You take a random sample of 50 reduced-fat cookies and test them in a lab,finding a mean fat content of 3.2 grams and a standard deviation of 1.1 grams of fat.Have the conditions and assumptions for inference been met?
A)No,the sample is not likely to be representative.
B)No,we have sampled more than 10% of the population.
C)No,the sample is not big enough to satisfy the nearly normal condition.
D)Yes,all conditions and assumptions are reasonably assumed to be met.
E)No,it is not a random sample.
A)No,the sample is not likely to be representative.
B)No,we have sampled more than 10% of the population.
C)No,the sample is not big enough to satisfy the nearly normal condition.
D)Yes,all conditions and assumptions are reasonably assumed to be met.
E)No,it is not a random sample.
Unlock Deck
Unlock for access to all 106 flashcards in this deck.
Unlock Deck
k this deck
30
A group of researchers wants to determine the mean annual household income for families receiving services at a large community centre.They randomly select ten families and record the following household incomes: $43,955,$42,740,$42,660,$43,800,$43,500,$44,250,$44,340,$40,390,$44,150,$44,200.Decide whether or not the conditions and assumptions for inference with a t-test are satisfied.Explain your answer.
Unlock Deck
Unlock for access to all 106 flashcards in this deck.
Unlock Deck
k this deck
31
A sociologist develops a test to measure attitudes about public transportation,and 27 randomly selected subjects are given the test.Their mean score is 76.2 and their standard deviation is 21.4.Construct the 95% confidence interval for the mean score of all such subjects.
A)(64.2,83.2)
B)(67.7,84.7)
C)(64.2,88.2)
D)(74.6,77.8)
E)(69.2,83.2)
A)(64.2,83.2)
B)(67.7,84.7)
C)(64.2,88.2)
D)(74.6,77.8)
E)(69.2,83.2)
Unlock Deck
Unlock for access to all 106 flashcards in this deck.
Unlock Deck
k this deck
32
A laboratory tested twelve chicken eggs and found that the mean amount of cholesterol was 237 milligrams with s = 14.0 milligrams.Construct a 95% confidence interval for the true mean cholesterol content of all such eggs.
A)(229.7,244.3)
B)(228.0,246.0)
C)(228.1,245.9)
D)(228.1,246.0)
E)(228.0,244.3)
A)(229.7,244.3)
B)(228.0,246.0)
C)(228.1,245.9)
D)(228.1,246.0)
E)(228.0,244.3)
Unlock Deck
Unlock for access to all 106 flashcards in this deck.
Unlock Deck
k this deck
33
The amounts (in millilitres)of juice in eight randomly selected juice bottles are:
Construct a 98% confidence interval for the mean amount of juice in all such bottles.
A)(468.09,471.05)
B)(441.48,471.05)
C)(443.28,468.96)
D)(468.09,482.22)
E)(441.48,468.09)
Construct a 98% confidence interval for the mean amount of juice in all such bottles.
A)(468.09,471.05)
B)(441.48,471.05)
C)(443.28,468.96)
D)(468.09,482.22)
E)(441.48,468.09)
Unlock Deck
Unlock for access to all 106 flashcards in this deck.
Unlock Deck
k this deck
34
How tall is your average statistics classmate? To determine this,you measure the height of a random sample of 15 of your 100 fellow students,finding a mean height of 166.6 cm and a standard deviation of 5.64 cm.Have the conditions and assumptions for inference been met?
A)No,the sample wasn't random.
B)Yes,all conditions and assumptions have been met.
C)No,the sample is more than 10% of the population.
D)No,the population is not likely to be Normal.
E)No,the sample is not representative.
A)No,the sample wasn't random.
B)Yes,all conditions and assumptions have been met.
C)No,the sample is more than 10% of the population.
D)No,the population is not likely to be Normal.
E)No,the sample is not representative.
Unlock Deck
Unlock for access to all 106 flashcards in this deck.
Unlock Deck
k this deck
35
You want to estimate the average gas price in your city for a litre of regular unleaded gasoline.You take a random sample of prices from 15 gas stations ,recording an average cost of $1.27 and a standard deviation of $0.06.Create a 95% confidence interval for the mean price per litre of gas.
A)($1.23,$1.41)
B)($1.24,$1.38)
C)($1.24,$1.30)
D)($1.21,$1.43)
E)($1.26,$1.38)
A)($1.23,$1.41)
B)($1.24,$1.38)
C)($1.24,$1.30)
D)($1.21,$1.43)
E)($1.26,$1.38)
Unlock Deck
Unlock for access to all 106 flashcards in this deck.
Unlock Deck
k this deck
36
A researcher wants to estimate the mean cholesterol level of people in his city.A random sample of 21 people yields a mean cholesterol level of 224 and a standard deviation of 12.Construct a 95% confidence interval.
A)(218.54,229.46)
B)(214.97,233.03)
C)(219.69,228.31)
D)(219.60,228.40)
E)(223.01,224.99)
A)(218.54,229.46)
B)(214.97,233.03)
C)(219.69,228.31)
D)(219.60,228.40)
E)(223.01,224.99)
Unlock Deck
Unlock for access to all 106 flashcards in this deck.
Unlock Deck
k this deck
37
Among a sample of 61 students selected at random from a university,the mean number of siblings is 1.5 with a standard deviation of 0.9.Find a 95% confidence interval for the mean number of siblings for all students at this university.
A)(1.39,1.53)
B)(1.47,1.53)
C)(68.53,71.47)
D)(1.39,1.61)
E)1.27 1.73)
A)(1.39,1.53)
B)(1.47,1.53)
C)(68.53,71.47)
D)(1.39,1.61)
E)1.27 1.73)
Unlock Deck
Unlock for access to all 106 flashcards in this deck.
Unlock Deck
k this deck
38
How many unpopped kernels are left when you pop a bag of microwave popcorn? Each day,quality control personnel take a random sample of 50 bags of popcorn.They pop each bag in a microwave and then count the number of unpopped kernels.Have the conditions and assumptions for inference been met?
A)No,the sample is more than 10% of the population size.
B)No,the sample does not meet the Nearly Normal condition.
C)Yes,all conditions and assumption are met.
D)No,the sample is not likely to be representative.
E)No,this is not a representative sample since the quality control personnel work for the company and are biased.
Unlock Deck
Unlock for access to all 106 flashcards in this deck.
Unlock Deck
k this deck
39
Students investigating the packaging of chocolate chip cookies purchased 10 450-gram bags of a particular brand.They carefully weighed the contents of each bag,recording the following weights (in grams): 467.6,427.9,464.8,447.8,447.8,456.3,459.1,444.9,439.3,450.6.The students plan to test the hypothesis that the mean weight agrees with the company's stated weight on each bag.Decide whether or not the conditions and assumptions for inference with a t-test are satisfied.Explain your answer.
Unlock Deck
Unlock for access to all 106 flashcards in this deck.
Unlock Deck
k this deck
40
How much fat do reduced fat cookies typically have? You take a random sample of 51 reduced-fat cookies and test them in a lab,finding a mean fat content of 3.2 grams and a standard deviation of 1.1 grams of fat.Create a 99% confidence interval for the mean grams of fat.
A)(2.80,3.60)
B)(3.14,3.26)
C)(2.79,3.61)
D)(2.78,3.62)
E)(2.10,4.30)
A)(2.80,3.60)
B)(3.14,3.26)
C)(2.79,3.61)
D)(2.78,3.62)
E)(2.10,4.30)
Unlock Deck
Unlock for access to all 106 flashcards in this deck.
Unlock Deck
k this deck
41
How tall is your average statistics classmate? To determine this,you measure the height of a random sample of 15 of your 100 fellow students,finding a 95% confidence interval for the mean height of 164.76 to 170.90 cm.
A)1.43 cm
B)6.14 cm
C)3.07 cm
D)2.11 cm
E)Not enough information is given.
A)1.43 cm
B)6.14 cm
C)3.07 cm
D)2.11 cm
E)Not enough information is given.
Unlock Deck
Unlock for access to all 106 flashcards in this deck.
Unlock Deck
k this deck
42
How many unpopped kernels are left when you pop a bag of microwave popcorn? Quality control personnel at Yummy Popcorn take a random sample of 50 bags of popcorn.They pop each bag in a microwave and then count the number of unpopped kernels.The following interval is produced:
T-interval for μ : with 99% Confidence,11 < μ(unpopped)< 25
A)We are 99% confident that the average number of unpopped kernels in microwave popcorn bags is between 11 and 25.
B)99% of all samples of Yummy popcorn will produce this confidence interval.
C)The average number of unpopped kernels in a bag of Yummy popcorn is between 11 and 25 kernels.
D)About 99% of the sampled bags had between 11 and 25 unpopped kernels.
E)We are 99% sure that the average number of unpopped kernels in bags of Yummy brand popcorn is between 11 and 25 kernels.
Unlock Deck
Unlock for access to all 106 flashcards in this deck.
Unlock Deck
k this deck
43
A researcher wants to estimate the mean cholesterol level of people in his city.A random sample of 21 people yields an average cholesterol level of 219,with a margin of error of ±12.Assume the researcher used a confidence level of 90%.
A)90% of the people sampled have cholesterol levels between 207 and 231.
B)We are 90% confident that 90% of people in the city have a cholesterol level between 207 and 231.
C)The researcher can be 90% confident that the mean cholesterol level for people in his city is between 207 and 231.
D)About 9 out of 10 people in the researcher's city have cholesterol levels between 207 and 231.
E)If we took many random samples of people in the city,about 9 out of 10 of them could produce a confidence interval of (207,231).
Unlock Deck
Unlock for access to all 106 flashcards in this deck.
Unlock Deck
k this deck
44
Alarmed at the rising gas prices in your town,you decide to estimate the average gas price for a litre of regular unleaded gasoline.From your sample of 25 gas stations,you calculate a 90% confidence interval of ($1.33,$1.41)
A)$0.08
B)$1.37
C)$0.04
D)$2.74
E)Not enough information is given.
A)$0.08
B)$1.37
C)$0.04
D)$2.74
E)Not enough information is given.
Unlock Deck
Unlock for access to all 106 flashcards in this deck.
Unlock Deck
k this deck
45
A random sample of clients at a weight loss centre were given a dietary supplement to see if it would promote weight loss.The centre reported that the 20 clients lost an average of 15.3 kg,and that a 95% confidence interval for the mean weight loss this supplement produced has a margin of error of ±4.5 kg.
A)95% of the clients in the study lost between 10.8 and 19.8 kg.
B)95% of the people who use this supplement will lose between 10.8 and 19.8 kg.
C)We are 95% confident that the mean weight loss produced by the supplement in weight loss centre clients is between 10.8 and 19.8 kg.
D)We are 95% sure that the average weight loss among the clients in this study was between 10.8 and 19.8 kg.
E)The average weight loss of clients who take this supplement will be between 10.8 and 19.8 kg.
Unlock Deck
Unlock for access to all 106 flashcards in this deck.
Unlock Deck
k this deck
46
A random sample of 30 households was selected from a particular neighborhood.The number of cars for each household is shown below.Estimate the mean number of cars per household for the population of households in this neighborhood.Give the 95% confidence interval.
A)(1.5,2)
B)(1,2)
C)(1.5,1.7)
D)(1.3,1.7)
E)(0.9,2.1)
A)(1.5,2)
B)(1,2)
C)(1.5,1.7)
D)(1.3,1.7)
E)(0.9,2.1)
Unlock Deck
Unlock for access to all 106 flashcards in this deck.
Unlock Deck
k this deck
47
A random sample of 30 long distance runners aged 20-25 was selected from a running club.The resting heart rates (in beats per minute)of the runners are shown below.Estimate the mean resting heart rate for the population of long distance runners aged 20-25.Give the 95% confidence interval.
A)(65.1,71.1)
B)(64.1,70.1)
C)(64.0,72.2)
D)(62.9,73.0)
E)(62.9,72.2)
A)(65.1,71.1)
B)(64.1,70.1)
C)(64.0,72.2)
D)(62.9,73.0)
E)(62.9,72.2)
Unlock Deck
Unlock for access to all 106 flashcards in this deck.
Unlock Deck
k this deck
48
A credit union took a random sample of 40 accounts and obtained the following 90% confidence interval for the mean checking account balance at the institution: $2,193 < μ(balance)< $3,828.
A)We are 90% confident that the mean checking account balance in the U.S.is between $2,193 and $3,828.
B)About 9 out of 10 people have a checking account balance between $2,193 and $3,828.
C)If we took random samples of checking accounts at this credit union,about nine out of ten of them would produce this confidence interval.
D)We are 90% confident that the mean checking account balance at this credit union is between $2,193 and $3,828,based on this sample.
E)We are 90% sure that the mean balance for checking accounts in the sample was between $2,193 and $3,828.
Unlock Deck
Unlock for access to all 106 flashcards in this deck.
Unlock Deck
k this deck
49
A scientist in Smallville tested the cholesterol of a random sample of 35 town residents.He constructed the following confidence interval:
T-interval for μ: with 99.00% Confidence,188 < μ(Cholesterol)< 206
A)197
B)18
C)1.09
D)9
E)Not enough information is given.
T-interval for μ: with 99.00% Confidence,188 < μ(Cholesterol)< 206
A)197
B)18
C)1.09
D)9
E)Not enough information is given.
Unlock Deck
Unlock for access to all 106 flashcards in this deck.
Unlock Deck
k this deck
50
How much fat do reduced fat cookies typically have? You take a random sample of 51 reduced-fat cookies and test them in a lab,constructing the following confidence interval:
T-Interval for μ: with 90.00% Confidence,2.3 < μ(grams of fat)< 3.4
A)0.55 grams of fat
B)2.85 grams of fat
C)1.48 grams of fat
D)1.10 grams of fat
E)Not enough information is given.
T-Interval for μ: with 90.00% Confidence,2.3 < μ(grams of fat)< 3.4
A)0.55 grams of fat
B)2.85 grams of fat
C)1.48 grams of fat
D)1.10 grams of fat
E)Not enough information is given.
Unlock Deck
Unlock for access to all 106 flashcards in this deck.
Unlock Deck
k this deck
51
How tall is the average student on your campus? To determine this,you measure the height,in centimetres,of a random sample of 9 of your fellow 100 students and calculate the following confidence interval with 95% confidence:
155.72 < μ(height)< 181.20
A)The average height of your classmates is between 155.72 and 181.20 cm.
B)We're 95% sure that the average height of your statistics classmates is between 155.72 and 181.20 cm.
C)There's a 95% chance of a classmate being between 155.72 and 181.20 cm tall.
D)95 of your 100 classmates are between 155.72 and 181.20 cm tall.
E)We can be 95% sure that statistics students are between 155.72 and 181.20 cm tall.
Unlock Deck
Unlock for access to all 106 flashcards in this deck.
Unlock Deck
k this deck
52
Based on a sample of 32 randomly selected years,a 90% confidence interval for the mean annual precipitation in one city is from 119.1 cm to 125.9 cm
A)1.7 cm
B)6.8 cm
C)3.4 cm
D)2.0 cm
E)Not enough information is given.
A)1.7 cm
B)6.8 cm
C)3.4 cm
D)2.0 cm
E)Not enough information is given.
Unlock Deck
Unlock for access to all 106 flashcards in this deck.
Unlock Deck
k this deck
53
Based on a sample of size 42,a 95% confidence interval for the mean score of all students on an aptitude test is from 57.2 to 64.8.
A)3.8
B)0.05
C)7.6
D)1.15
E)Not enough information is given.
A)3.8
B)0.05
C)7.6
D)1.15
E)Not enough information is given.
Unlock Deck
Unlock for access to all 106 flashcards in this deck.
Unlock Deck
k this deck
54
You are considering moving to Richmond Hill,and are concerned about the average one-way commute time to downtown Toronto.Does the average one-way commute time exceed 25 minutes? You take a random sample of 50 Richmond Hill residents and find an average commute time of 29 minutes with a standard deviation of 7 minutes.
A)
B)
C)
D)
E)
A)
B)
C)
D)
E)
Unlock Deck
Unlock for access to all 106 flashcards in this deck.
Unlock Deck
k this deck
55
To determine the mean number of unpopped kernels in your favorite brand of microwave popcorn,you pop a random sample of 50 bags of popcorn and construct of 98% confidence interval of (12.5,15.4).
A)1.23 unpopped kernels
B)1.45 unpopped kernels
C)1.50 unpopped kernels
D)2.90 unpopped kernels
E)Not enough information is given.
A)1.23 unpopped kernels
B)1.45 unpopped kernels
C)1.50 unpopped kernels
D)2.90 unpopped kernels
E)Not enough information is given.
Unlock Deck
Unlock for access to all 106 flashcards in this deck.
Unlock Deck
k this deck
56
You want to estimate the average gas price in your city for a litre of regular unleaded gasoline.From your sample of 15 gas stations,you calculate a 95% confidence interval of ($1.34,$1.40)
A)You are 95% sure that the average price for a litre of regular unleaded gasoline in your city is between $1.34 and $1.40.
B)You are 95% confident that the average price for a litre of regular unleaded gasoline in the country is within $0.03 of $1.37.
C)If you took many samples of gas stations in your city,about 95% of them would produce this confidence interval.
D)You are 95% sure that gas stations in this sample have average costs between $1.34 and $1.40.
E)95% of all samples of gas stations will have average costs between $1.34 and $1.40.
Unlock Deck
Unlock for access to all 106 flashcards in this deck.
Unlock Deck
k this deck
57
How much fat do reduced fat cookies typically have? You take a random sample of 51 reduced-fat cookies and test them in a lab,finding a mean fat content of 4.2 grams.You calculate a 95% confidence interval and find that the margin of error is ±0.8 grams.
A)You are 95% confident that the mean fat in reduced fat cookies is between 3.4 and 5 grams of fat.
B)We are 95% confident that the mean fat in all cookies is between 3.4 and 5 grams.
C)95% of the cookies in the sample had between 3.4 and 5 grams of fat.
D)We are 95% sure that the average amount of fat in the cookies in this study was between 3.4 and 5 grams.
E)95% of reduced fat cookies have between 3.4 and 5 grams of fat.
Unlock Deck
Unlock for access to all 106 flashcards in this deck.
Unlock Deck
k this deck
58
Analysis of a random sample of 250 Nova Scotia nurses produced a 95% confidence interval for the mean annual salary of $42,807 < μ(Nurse Salary)< $49,699.
A)About 95% of Nova Scotia nurses earn between $42,807 and $49,699.
B)We are 95% confident that the average nurse salary in the Canada is between $42,807 and $49,699.
C)About 95% of the nurses surveyed earn between $42,807 and $49,699.
D)We are 95% confident that the interval from $42,807 to $49,699 contains the true mean salary of all Nova Scotia nurses.
E)If we took many random samples of Nova Scotia nurses,about 95% of them would produce this confidence interval.
Unlock Deck
Unlock for access to all 106 flashcards in this deck.
Unlock Deck
k this deck
59
Data collected by child development scientists produced the following 90% confidence interval for the average age (in months)at which children say their first word: 10.6 < μ(age)< 13.1.
A)We are 90% sure that the average age at which children in this sample said their first word was between 10.6 and 13.1 months.
B)If we took many random samples of children,about 90% of them would produce this confidence interval.
C)We are 90% sure that a child will say his first word when he is between 10.6 and 13.1 months old.
D)90% of the children in this sample said their first word when they were between 10.6 and 13.1 months old.
E)Based on this sample,we can say,with 90% confidence,that the mean age at which children say their first word is between 10.6 and 13.1 months.
Unlock Deck
Unlock for access to all 106 flashcards in this deck.
Unlock Deck
k this deck
60
You want to see if the number of minutes cell phone users use each month has changed from its mean of 120 minutes 2 years ago.You take a random sample of 100 cell phone users and find an average of 135 minutes used.
A)
B)
C)
D)
E)
A)
B)
C)
D)
E)
Unlock Deck
Unlock for access to all 106 flashcards in this deck.
Unlock Deck
k this deck
61
A consumer advocacy group thinks that reduced-fat cookies contain more fat than claimed.They test the hypothesis
: μ = 2.5 grams against
: μ > 2.5 grams.
A)Upper-tailed
B)Two-tailed
C)Lower-tailed
: μ = 2.5 grams against
: μ > 2.5 grams.
A)Upper-tailed
B)Two-tailed
C)Lower-tailed
Unlock Deck
Unlock for access to all 106 flashcards in this deck.
Unlock Deck
k this deck
62
You are concerned about the high price of gas in your city.You want to determine if the mean price for a litre of gas has exceeded $1.40.
A)Upper-tailed
B)Two-sided
C)Lower-tailed
A)Upper-tailed
B)Two-sided
C)Lower-tailed
Unlock Deck
Unlock for access to all 106 flashcards in this deck.
Unlock Deck
k this deck
63
A large software company gives job applicants a test of programming ability,and the mean for the test has been 160 in the past.Twenty-five applicants are randomly selected from one large university and they produce a mean score of 165,with a standard deviation of 13.At a significance level of 0.05,does this indicate that the sample comes from a population with a mean score greater than 160?
A)Yes.With a P-value of 0.0024,we reject the null hypothesis of μ=160.There is sufficient evidence that the population mean score is greater than 160.
B)No.With a P-value of 0.0664,we fail to reject the null hypothesis of μ=160.There is not sufficient evidence that the population mean score is greater than 160.
C)No.With a P-value of 0.9336,we fail to reject the null hypothesis of μ=160.There is not sufficient evidence that the population mean score is greater than 160.
D)Yes.With a P-value of 0.0332,we reject the null hypothesis of μ=160.There is sufficient evidence that the population mean score is greater than 160.
E)No.With a P-value of 0.9668,we fail to reject the null hypothesis of μ=160.There is not sufficient evidence that the population mean score is greater than 160.
Unlock Deck
Unlock for access to all 106 flashcards in this deck.
Unlock Deck
k this deck
64
A test of sobriety involves measuring the subject's motor skills.Twenty randomly selected sober subjects take the test and produce a mean score of 41.0 with a standard deviation of 3.4.At a significance level of 0.01,test the claim that the true mean score for all sober subjects is equal to 39.0.
A)Reject the null hypothesis of μ = 39.0 with a P-value of 0.00823.There is strong evidence that the true mean score for sober subjects is not 39.0.
B)Reject the null hypothesis of μ = 39.0 with a P-value of 0.01647.There is sufficient evidence that the true mean score for sober subjects is different from 39.0.
C)Fail to reject the null hypothesis of μ = 39.0 with a P-value of 0.01647.There is not sufficient evidence that the true mean score for sober subjects is different from 39.0.
D)Fail to reject the null hypothesis of μ = 39.0 with a P-value of 0.02647.There is not sufficient evidence that the true mean score for sober subjects is different from 39.0.
E)There is not enough information to perform the test.
Unlock Deck
Unlock for access to all 106 flashcards in this deck.
Unlock Deck
k this deck
65
In the past,the mean battery life for a certain type of flashlight battery has been 8.8 hours.The manufacturer has introduced a change in the production method and wants to perform a hypothesis test to determine whether the mean battery life has increased as a result.The hypotheses are:
Explain the result of a Type I error.
A)The manufacturer will decide the mean battery life is 8.8 hours when in fact it is greater than 8.8 hours.
B)The manufacturer will decide the mean battery life is 9.6 hours greater than it was prior to the change in the production method.
C)The manufacturer will decide the mean battery life is 9.6 hours lower than it was prior to the change in the production method.
D)The manufacturer will decide the mean battery life is greater than 8.8 hours when in fact it is greater than 8.8 hours .
E)The manufacturer will decide the mean battery life is greater than 8.8 hours when in fact it is 8.8 hours.
Unlock Deck
Unlock for access to all 106 flashcards in this deck.
Unlock Deck
k this deck
66
In the past,the mean running time for a certain type of flashlight battery has been 9.0 hours.The manufacturer has introduced a change in the production method and wants to perform a hypothesis test to determine whether the mean running time has changed as a result.
A)Two-sided
B)Upper-tailed
C)Lower-tailed
A)Two-sided
B)Upper-tailed
C)Lower-tailed
Unlock Deck
Unlock for access to all 106 flashcards in this deck.
Unlock Deck
k this deck
67
Is the mean lifetime of particular type of car engine greater than 350,000 km? To test this claim,a sample of 23 engines is measured,yielding an average of 365,000 km and a standard deviation of 18,500 km.Use a significance level of 0.01.
A)Reject the null hypothesis of μ= 350,000 with a P-value of 0.0134.There is sufficient evidence that the engines last longer than 350,000 km on average.
B)Fail to reject the null hypothesis of μ= 350,000 with a P-value of 0.9933.There is not sufficient evidence that the engines last longer than 350,000 km on average.
C)Reject the null hypothesis of μ= 350,000 with a P-value of 0.0004.There is sufficient evidence that the engines last longer than 350,000 km on average.
D)Fail to reject the null hypothesis with a P-value of 0.07352.There is not sufficient evidence that the engines last longer than 350,000 km on average.
E)There is not enough information to perform the test.
Unlock Deck
Unlock for access to all 106 flashcards in this deck.
Unlock Deck
k this deck
68
A manufacturer produces refrigerators that are claimed to maintain a true mean temperature of 7°C,ideal for certain beverages.The owner of a beverage company wants to conduct a test to determine if the true mean temperature of the refrigerators is different from this value.
A)Upper-tailed
B)Lower-tailed
C)Two-sided
A)Upper-tailed
B)Lower-tailed
C)Two-sided
Unlock Deck
Unlock for access to all 106 flashcards in this deck.
Unlock Deck
k this deck
69
Are Canadians getting fatter? Researchers interested in this question take a random sample of 500 people and record an average weight of 190 pounds.Ten years ago,the average weight was 185 pounds.
A)
B)
C)
D)
E)
A)
B)
C)
D)
E)
Unlock Deck
Unlock for access to all 106 flashcards in this deck.
Unlock Deck
k this deck
70
Has the introduction of more music download services changed the number of university students that download music for free from the internet? Two years ago,approximately 50,000 university students admitted to downloading music for free from the internet.
A)
B)
C)
D)
E)
A)
B)
C)
D)
E)
Unlock Deck
Unlock for access to all 106 flashcards in this deck.
Unlock Deck
k this deck
71
Suzie has installed a new spam blocker program on her email.She used to receive an average of 20 spam emails a day.Is the new program working?
A)
B)
C)
D)
E)
A)
B)
C)
D)
E)
Unlock Deck
Unlock for access to all 106 flashcards in this deck.
Unlock Deck
k this deck
72
Marc wants to know if the mean age of the prison population in his city is less than 26 years.He obtains a random sample of 25 prisoners,and finds a mean age of 24.4 years and a standard deviation of 9.2 years.At a significance level of 0.05,what is his conclusion?
A)Fail to reject the null hypothesis of μ = 26 with a P-value of 0.8034.There is not sufficient evidence that the mean age is less than 26 years.
B)Reject the null hypothesis of μ = 26 with a P-value of 0.018.There is sufficient evidence that the mean age is less than 26 years.
C)Fail to reject the null hypothesis of μ = 26 with a P-value of 0.1966.There is not sufficient evidence that the mean age is less than 26 years.
D)Reject the null hypothesis of μ = 26 with a P-value of 0.0425.The evidence suggests that the mean age is less than 26 years.
E)There is not enough information to perform the test.
Unlock Deck
Unlock for access to all 106 flashcards in this deck.
Unlock Deck
k this deck
73
The owner of a football team claims that the average attendance at games is over 74,100,and he is therefore justified in moving the team to a city with a larger stadium.An independent investigator will conduct a hypothesis test to determine whether his claim is accurate.
A)Upper-tailed
B)Two-sided
C)Lower-tailed
A)Upper-tailed
B)Two-sided
C)Lower-tailed
Unlock Deck
Unlock for access to all 106 flashcards in this deck.
Unlock Deck
k this deck
74
Is the mean weight of female college students still 59.4 kg? To test this,you take a random sample of 20 students,finding a mean of 61.65 kg with a standard deviation of 6.39 kg.Use a significance level of 0.10.
A)Fail to reject the null hypothesis of μ= 59.4 with a P-value of 0.1318.There is not sufficient evidence that the mean weight of female students has changed.
B)Reject the null hypothesis of μ= 59.4 with a P-value of 0.0659.There is sufficient evidence that the mean weight of female students has changed.
C)Fail to reject the null hypothesis of μ= 59.4 with a P-value of 0.9341.There is not sufficient evidence that the mean weight of female students has changed.
D)Fail to reject the null hypothesis of μ= 59.4 with a P-value of 0.8682.There is not sufficient evidence that the mean weight of female students has changed.
E)There is not enough information to perform the test.
Unlock Deck
Unlock for access to all 106 flashcards in this deck.
Unlock Deck
k this deck
75
In 1990,the average duration of long-distance telephone calls originating in one town was 7.2 minutes.A long-distance telephone company wants to perform a hypothesis test to determine whether the average duration of long-distance phone calls has changed from the 1990 mean of 7.2 minutes.
A)Lower-tailed
B)Two-sided
C)Upper-tailed
A)Lower-tailed
B)Two-sided
C)Upper-tailed
Unlock Deck
Unlock for access to all 106 flashcards in this deck.
Unlock Deck
k this deck
76
Quality control engineers are trying to improve the number of unpopped kernels in their company's microwave popcorn.Changes to the oil have recently been made,so the engineers are testing the hypothesis
: μ = 25 against
: μ < 25.
A)Upper-tailed
B)Two-sided
C)Lower-tailed
: μ = 25 against
: μ < 25.
A)Upper-tailed
B)Two-sided
C)Lower-tailed
Unlock Deck
Unlock for access to all 106 flashcards in this deck.
Unlock Deck
k this deck
77
A health insurer has determined that the "reasonable and customary" fee for a certain medical procedure is $1200.They suspect that the average fee charged by one particular clinic for this procedure is higher than $1200.The insurer wants to perform a hypothesis test to determine whether their suspicion is correct.
A)Lower-tailed
B)Two-sided
C)Upper-tailed
A)Lower-tailed
B)Two-sided
C)Upper-tailed
Unlock Deck
Unlock for access to all 106 flashcards in this deck.
Unlock Deck
k this deck
78
In the past,the mean battery life for a certain type of flashlight battery has been 9.5 hours.The manufacturer has introduced a change in the production method and wants to perform a hypothesis test to determine whether the mean battery life has increased as a result.The hypotheses are:
: μ = 9.5 hours
: μ > 9.5 hours
Explain the result of a Type II error.
A)The manufacturer will not decide the mean battery life is greater than 9.5 hours when in fact it is greater than 9.5 hours.
B)The manufacturer will decide the mean battery life is greater than 9.5 hours when in fact it is 9.5 hours.
C)The manufacturer will decide the mean battery life is greater than 9.5 hours when in fact it is greater than 9.5 hours.
D)The manufacturer will decide the mean battery life is 9.6 hours lower than it was prior to the change in the production method.
E)The manufacturer will decide the mean battery life is 8.1 hours greater than it was prior to the change in the production method.
Unlock Deck
Unlock for access to all 106 flashcards in this deck.
Unlock Deck
k this deck
79
A manufacturer claims that the mean amount of juice in its 500 mL bottles is 501.2 mL.A consumer advocacy group wants to perform a hypothesis test to determine whether the mean amount is actually less than this.
A)Two-sided
B)Lower-tailed
C)Upper-tailed
A)Two-sided
B)Lower-tailed
C)Upper-tailed
Unlock Deck
Unlock for access to all 106 flashcards in this deck.
Unlock Deck
k this deck
80
At one school,the average amount of time that tenth-graders spend watching television each week is 21.6 hours.The principal introduces a campaign to encourage the students to watch less television.One year later,the principal wants to perform a hypothesis test to determine whether the average amount of time spent watching television per week has decreased from the previous mean of 21.6 hours.
A)Upper-tailed
B)Two-sided
C)Lower-tailed
A)Upper-tailed
B)Two-sided
C)Lower-tailed
Unlock Deck
Unlock for access to all 106 flashcards in this deck.
Unlock Deck
k this deck
Unlock Deck
Unlock for access to all 106 flashcards in this deck.


