Deck 5: Demand Estimation
Full screen (f)
Question
Question
Question
Question
Question
Question
Question
Question
Question
Question
Question
Question
Question
Question
Question
Question
Question
Question
Question
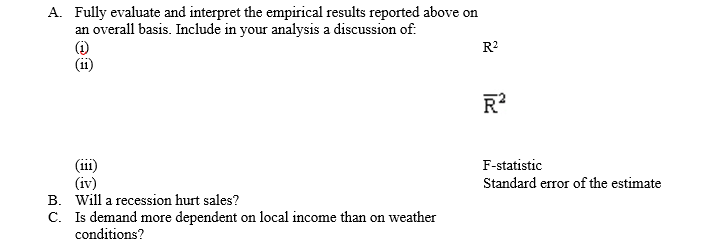
After controlling for the influence of all X variables, the standard deviation of the dependent Y variable is given by:
A) R2
B)
C) SEE
D)
A) R2
B)
C) SEE
D)
Question
Question
One-Tail t-tests. Martin's Footwear, Inc., of Boston, Massachusetts has retained you to aid the firm in an evaluation of its marketing strategy. Martin's "Happy Feet" running shoes are marketed through local retail outlets in the eastern United States. A move to extend Martin's market to Midwestern and western states is currently being contemplated.
A marketing research group conducted an empirical analysis of demand for Martin's "Happy Feet" during 2008 in thirty-six regional markets and found the following (standard errors in parentheses):
A marketing research group conducted an empirical analysis of demand for Martin's "Happy Feet" during 2008 in thirty-six regional markets and found the following (standard errors in parentheses):
Question
Question
Demand Curve Estimation. The Real Kool Toys Company manufactures and sells educational toys. An empirical demand function for one of the firm's products has been estimated over the last 21 quarters using regression analysis. The estimated demand function is:
 Standard Error of the Estimate = 1,000
Here QY is quantity (measured in units) of Product Y demanded in the current period, A is hundreds of dollars of advertising ($00), I is thousands of dollars of disposable income per capita ($000), and PX is the price ($) of another toy manufactured by a competitor, ABC Toys. The terms in parentheses are the standard errors of the coefficients.

Standard Error of the Estimate = 1,000Here QY is quantity (measured in units) of Product Y demanded in the current period, A is hundreds of dollars of advertising ($00), I is thousands of dollars of disposable income per capita ($000), and PX is the price ($) of another toy manufactured by a competitor, ABC Toys. The terms in parentheses are the standard errors of the coefficients.
Question
Question
Question
Regression Statistics. June Ward, controller for NAFTA, Inc., has asked you to analyze demand in 30 regional markets for Beaver's Cleavers, a new brush cutting device, dubbed Product Y. A statistical analysis of demand in these markets shows (standard errors in parentheses):
 Standard Error of the Estimate = 40
Here, QY is market demand for Product Y, P is the price of Y in dollars, A is dollars of advertising expenditures, PX is the average price in dollars of another (unidentified) product, and I is dollars of household income. In a typical market, the price of Y is $100, PX is $50, and disposable income per family averages $80,000.

Standard Error of the Estimate = 40Here, QY is market demand for Product Y, P is the price of Y in dollars, A is dollars of advertising expenditures, PX is the average price in dollars of another (unidentified) product, and I is dollars of household income. In a typical market, the price of Y is $100, PX is $50, and disposable income per family averages $80,000.
Question
Elasticity Estimation. The Lincoln National Life Insurance Company offers a wide variety of insurance products, including whole-life and term policies. The company has compiled the following data concerning policy sales during recent years:
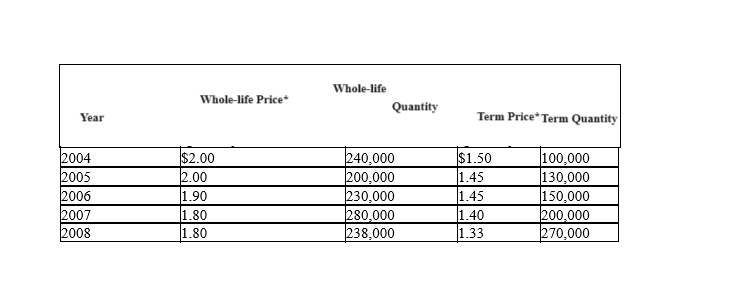 *Price is quoted in terms of cost per $1,000 of coverage.

*Price is quoted in terms of cost per $1,000 of coverage. Question
Question
Regression Statistics. Financial Planning Associates, Ltd., has hired you to analyze demand in 30 regional markets for custom financial plans for high net worth individuals (Product Y). A statistical analysis of demand in these markets shows (standard errors in parentheses):
 Standard Error of the Estimate = 5
Here, QY is market demand for Product Y, P is the price of Y in dollars, A is dollars of advertising expenditures, PX is the average price in dollars of another (unidentified) product, and I is dollars of household income. In a typical market, the price of Y is $2,000, PX is $1,000, advertising expenditures are $120,000, and average family income is $200,000.

Standard Error of the Estimate = 5Here, QY is market demand for Product Y, P is the price of Y in dollars, A is dollars of advertising expenditures, PX is the average price in dollars of another (unidentified) product, and I is dollars of household income. In a typical market, the price of Y is $2,000, PX is $1,000, advertising expenditures are $120,000, and average family income is $200,000.
Question
Expected Demand Estimation. Snack Foods International, Ltd. has hired you to analyze demand in 25 regional markets for a new Product Y, called Angelica Pickles. A statistical analysis of demand in these markets shows (standard errors in parentheses):
 Standard Error of the Estimate = 75
Here, QY is market demand for Product Y, P is the price of Y in dollars, A is dollars of advertising expenditures, PX is the average price in dollars of another (unidentified) product, and I is dollars of household income. In a typical market, the price of Y is $1,500, PX is $500, advertising expenditures are $50,000, and disposable income per household is $45,000.

Standard Error of the Estimate = 75Here, QY is market demand for Product Y, P is the price of Y in dollars, A is dollars of advertising expenditures, PX is the average price in dollars of another (unidentified) product, and I is dollars of household income. In a typical market, the price of Y is $1,500, PX is $500, advertising expenditures are $50,000, and disposable income per household is $45,000.
Question
Question
Question
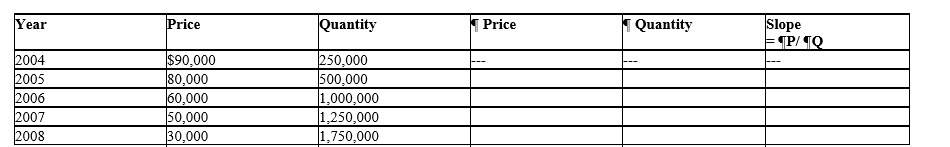
The Identification Problem. Business is booming for Complex Controls, Inc., a leading supplier of analog/digital circuits and systems used for measurement and control. The average price received by CCI for the XKE device, and the number sold (output) over the past six quarters are as follows:
 Quarterly demand and supply curves for CCI services are:

where Q is output (000), P is price, T is a trend factor, and T = 1 during Q-1 and increases by one unit per quarter.

Quarterly demand and supply curves for CCI services are: where Q is output (000), P is price, T is a trend factor, and T = 1 during Q-1 and increases by one unit per quarter.
Question
Question
Question
Demand Curve Estimation. Linux Servers, Inc., is a leading supplier of high-speed servers with enormous storage capacity. Average price and annual unit sales data for the VAX-7500 high-speed machine are as follows:


Question
Question
Question
R2 and t statistics. Boris Yeltsin Products, Inc., has hired you to analyze demand in 30 regional markets for Product Y, a new vodka beverage. A statistical analysis of demand in these markets shows (standard errors in parentheses):
 Standard Error of the Estimate = 20
Here, QY is market demand for Product Y, P is the price of Y in dollars, A is dollars of advertising expenditures, PX is the average price in dollars of another (unidentified) product, and I is dollars of household income. In a typical market, the price of Y is $500, PX is $600, advertising expenditures are $10,000, and average per capita income is $40,000.

Standard Error of the Estimate = 20Here, QY is market demand for Product Y, P is the price of Y in dollars, A is dollars of advertising expenditures, PX is the average price in dollars of another (unidentified) product, and I is dollars of household income. In a typical market, the price of Y is $500, PX is $600, advertising expenditures are $10,000, and average per capita income is $40,000.
Question
Price Elasticity Estimation. Thomas Magnum, a financial analyst for Detroit Wheels, Inc., has been hired to analyze demand in 20 regional markets for Product Y, a major item. A statistical analysis of demand in these markets shows (standard errors in parentheses):
 Standard Error of the Estimate = 10
Here, QY is market demand for Product Y, P is the price of Y in dollars, A is dollars of advertising expenditures, PX is the average price in dollars of another (unidentified) product, and I is dollars of household income. In a typical market, the price of Y is $100, PX is $75, advertising expenditures are $50,000, and average family income is $80,000.

Standard Error of the Estimate = 10Here, QY is market demand for Product Y, P is the price of Y in dollars, A is dollars of advertising expenditures, PX is the average price in dollars of another (unidentified) product, and I is dollars of household income. In a typical market, the price of Y is $100, PX is $75, advertising expenditures are $50,000, and average family income is $80,000.
Question
Multiple Regression. Maastrict Controls, Ltd., is a regional producer of sophisticated precision control devices. To assess the potential payoff to adopting the recommendations of a Total Quality Management (TQM) seminar attended by managerial staff, the company has decided to analyze the sales effects of price and product quality for a range of leading products. The company recently compiled and used a regression analysis approach to study the following unit sales, price, and product quality information:
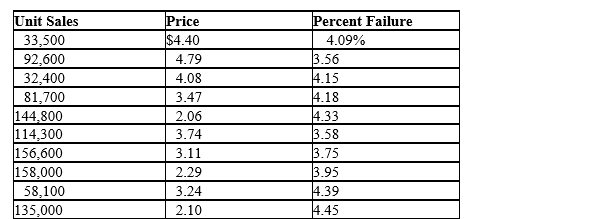 As a first step in the analysis, the company ran simple regressions of unit sales on each of the potentially important independent variables of price and the percent failure rate (product quality):
SALES = 220440 - 35980 PRICE

SALES = 178434 - 56659 PRICE + 115808 FAILURE
As a first step in the analysis, the company ran simple regressions of unit sales on each of the potentially important independent variables of price and the percent failure rate (product quality):SALES = 220440 - 35980 PRICE
SALES = 178434 - 56659 PRICE + 115808 FAILURE
Question
Correlation and Simple Regression. Market Analysis, Inc., has conducted a survey to learn the income characteristics of an N = 10 sample of department store customers. The survey asked each customer his or her age and household annual income. Survey results were as follows


The regression equation is:
INCOME = 50.4 + 2.03 AGE
The regression equation is:
INCOME = 50.4 + 2.03 AGE
Question
Correlation and Simple Regression. Test Markets, Inc., has conducted a survey to learn the income characteristics of an n = 10 sample of construction workers. The survey asked worker his or her annual income and number of years work experience. Survey results are:

The regression equation is:
INCOME = 13325 + 4497 EXPERIENCE
The regression equation is:
INCOME = 13325 + 4497 EXPERIENCE
Question
Demand Estimation. The Wallpaper Shop, Inc., is a rapidly growing chain of wallpaper shops that caters to the do-it-yourself home remodeling market. During the past year, 15 stores were operated in small to medium-size metropolitan markets. An in-house study of sales by these outlets revealed the following (standard errors in parentheses):
 Standard Error of the Estimate = 800.
Here, Q is the number of customers served, P is the average price per customer, PX is the average cost of professionally wallpapering a small room, A is advertising expenditures (in dollars), I is disposable income per capita (in dollars), and GR is the rate of population growth per year (in percent).

Standard Error of the Estimate = 800.Here, Q is the number of customers served, P is the average price per customer, PX is the average cost of professionally wallpapering a small room, A is advertising expenditures (in dollars), I is disposable income per capita (in dollars), and GR is the rate of population growth per year (in percent).
Question
z-Statistics. Fantastic Footwear, Inc., of Freeport, Maine, has retained you to aid the firm in an evaluation of its marketing strategy. Fantastic Footwear shoes are marketed through "factory outlet" malls located along the eastern seaboard. A move to extend the company's market to Midwestern and Western states is currently being contemplated.
A marketing research group conducted an empirical analysis of demand for the company's shoes during 2008 in twenty regional markets and found the following (standard errors in parentheses):
 Standard error of the estimate = 500
where Q = quantity sold (in pairs of shoes), P = price (in dollars), PX is the average price of shoes in competitor stores, and M is the distance in miles to the nearest competing factory outlet mall.
Champaign-Urbana, Illinois is a potential Midwestern market with economic characteristics typical of those eastern markets included in the empirical analysis. In Champaign-Urbana, expected levels are: P = $60, PX = $80 and M = 200 miles.

A marketing research group conducted an empirical analysis of demand for the company's shoes during 2008 in twenty regional markets and found the following (standard errors in parentheses):
Standard error of the estimate = 500where Q = quantity sold (in pairs of shoes), P = price (in dollars), PX is the average price of shoes in competitor stores, and M is the distance in miles to the nearest competing factory outlet mall.
Champaign-Urbana, Illinois is a potential Midwestern market with economic characteristics typical of those eastern markets included in the empirical analysis. In Champaign-Urbana, expected levels are: P = $60, PX = $80 and M = 200 miles.
Question
Elasticity Estimation. Breakaway Tours, Inc., has estimated the following multiplicative demand function for packaged holiday tours in the Flushing, New York, market using quarterly data covering the past five years (20 observations):
 Standard Error of the Estimate = 10.
Here, Qy is the quantity of tours sold, Py is average tour price, Px is average price for some other good, Ay is tour advertising, Ax is advertising of some other good, and I is per capita disposable income. The standard errors of the exponents in the preceding multiplicative demand function are
Standard Error of the Estimate = 10.Here, Qy is the quantity of tours sold, Py is average tour price, Px is average price for some other good, Ay is tour advertising, Ax is advertising of some other good, and I is per capita disposable income. The standard errors of the exponents in the preceding multiplicative demand function are
Question
Multiple Regression. Kitchen Products, Ltd., is a regional distributor of Regal Bread Making Machine. The company wishes to assess the relative importance of price reductions versus an increase in personal selling efforts as means for enhancing product promotion. To this end, the company recently used a regression analysis approach to study the following monthly unit sales, price, and personal selling expense information for the Bozeman, Montana market:
As a first step in the analysis, the company ran simple regressions of unit sales on each of the potentially important independent variables of price and personal selling expenses:
The first simple regression equation is:
SALES = 371 - 2.59 PRICE

The multiple regression equation is:
SALES = 195 - 4.33 PRICE + 0.231 SELLEXP
As a first step in the analysis, the company ran simple regressions of unit sales on each of the potentially important independent variables of price and personal selling expenses:
The first simple regression equation is:
SALES = 371 - 2.59 PRICE
The multiple regression equation is:
SALES = 195 - 4.33 PRICE + 0.231 SELLEXP
Question
One-tail t tests. A study of the demand for imported motorcycles recently appeared in an industry newsletter. According to the study, demand for motorcycle imports is described by the function:
 Standard error of the estimate = 30
Here QY is the quantity of motorcycles imported (000), PY is average motorcycle price ($), PX is the average price of imported compact cars, AY is motorcycle industry advertising ($000,000), AX is industry advertising of compact cars ($000,000), and I is average disposable family income ($000). The standard errors of the exponents in the multiplicative demand function above are:
And finally, this demand function was estimated using two years of monthly data (24 observations).

Standard error of the estimate = 30Here QY is the quantity of motorcycles imported (000), PY is average motorcycle price ($), PX is the average price of imported compact cars, AY is motorcycle industry advertising ($000,000), AX is industry advertising of compact cars ($000,000), and I is average disposable family income ($000). The standard errors of the exponents in the multiplicative demand function above are:
And finally, this demand function was estimated using two years of monthly data (24 observations).
Question
Profit Probability Estimation. Intimate Lighting, Inc., is a rapidly growing lighting accessory outlets that caters to the do-it-yourself home remodeling market. During the past year, 18 stores were operated in small to medium-size metropolitan markets. An in-house study of sales by these outlets revealed the following (standard errors in parentheses):
 Standard Error of the Estimate = 500.
Here, Q is unit sales, P is unit price, PX is the average unit price at competitor stores, A is advertising expenditures, and I is income per capita.
A. Tucson, Arizona was a typical market covered by this analysis. In the Tucson market, "own" price was $60, competitor price was $45, advertising was $13,500, and income was an average $80,000. Calculate and interpret the expected level of unit sales, as well as the 95% and 99% confidence regions for actual sales.
B. Calculate the 95% and 99% confidence regions for actual revenues in the Tucson market.
C. Estimate the probability that the Tucson store made a profit during this period if total costs were $1,735,200.
Standard Error of the Estimate = 500.Here, Q is unit sales, P is unit price, PX is the average unit price at competitor stores, A is advertising expenditures, and I is income per capita.
A. Tucson, Arizona was a typical market covered by this analysis. In the Tucson market, "own" price was $60, competitor price was $45, advertising was $13,500, and income was an average $80,000. Calculate and interpret the expected level of unit sales, as well as the 95% and 99% confidence regions for actual sales.
B. Calculate the 95% and 99% confidence regions for actual revenues in the Tucson market.
C. Estimate the probability that the Tucson store made a profit during this period if total costs were $1,735,200.

Unlock Deck
Sign up to unlock the cards in this deck!
Unlock Deck
Unlock Deck
1/49
Play
Full screen (f)
Deck 5: Demand Estimation
1
If a decrease in price causes total revenue to increase, an estimate of the absolute value of the price elasticity of demand will be:
A) greater than zero but less than one.
B) equal to one.
C) greater than one.
D) equal to zero.
A) greater than zero but less than one.
B) equal to one.
C) greater than one.
D) equal to zero.
C
2
Movement along a demand curve is indicated by the quantity effect of a change in:
A) advertising.
B) price of other goods.
C) income.
D) price.
A) advertising.
B) price of other goods.
C) income.
D) price.
D
3
Endogenous determinants of demand include:
A) competitor prices.
B) the weather.
C) interest rates.
D) firm advertising.
A) competitor prices.
B) the weather.
C) interest rates.
D) firm advertising.
D
4
If P1 = $5, Q1 = 10,000, P2 = $6 and Q2 = 5,000, then at point P2 an estimate of the point price elasticity eP equals:
A) -6
B) -2.5
C) -4.25
D) -0.12
A) -6
B) -2.5
C) -4.25
D) -0.12
Unlock Deck
Unlock for access to all 49 flashcards in this deck.
Unlock Deck
k this deck
5
The demand for most consumer goods is insensitive to changes in:
A) competitor prices.
B) the weather.
C) advertising.
D) the corporate income tax rate.
A) competitor prices.
B) the weather.
C) advertising.
D) the corporate income tax rate.
Unlock Deck
Unlock for access to all 49 flashcards in this deck.
Unlock Deck
k this deck
6
A decrease in demand can be expected following:
A) an increase in price.
B) a decrease in price.
C) a decrease in advertising.
D) an increase in the price of substitutes.
A) an increase in price.
B) a decrease in price.
C) a decrease in advertising.
D) an increase in the price of substitutes.
Unlock Deck
Unlock for access to all 49 flashcards in this deck.
Unlock Deck
k this deck
7
In a simple regression model, the correlation coefficient is:
A) equal to one.
B) greater than one.
C) less than one.
D) the square root of the coefficient of determination.
A) equal to one.
B) greater than one.
C) less than one.
D) the square root of the coefficient of determination.
Unlock Deck
Unlock for access to all 49 flashcards in this deck.
Unlock Deck
k this deck
8
A method for predicting buyer response to hypothetical changes in product quality is provided by:
A) field studies.
B) regression analysis.
C) consumer surveys.
D) market experiments.
A) field studies.
B) regression analysis.
C) consumer surveys.
D) market experiments.
Unlock Deck
Unlock for access to all 49 flashcards in this deck.
Unlock Deck
k this deck
9
If P1 = $5, Q1 = 10,000, P2 = $6 and Q2 = 5,000, then at point P1 an estimate of the point price elasticity eP equals:
A) -6
B) -2.5
C) -4.25
D) -0.12
A) -6
B) -2.5
C) -4.25
D) -0.12
Unlock Deck
Unlock for access to all 49 flashcards in this deck.
Unlock Deck
k this deck
10
Multicollinearity is caused by:
A) high correlation among the X variables.
B) a linear XY relation.
C) a log-linear XY relation.
D) high correlation between Y and at least one X variable.
A) high correlation among the X variables.
B) a linear XY relation.
C) a log-linear XY relation.
D) high correlation between Y and at least one X variable.
Unlock Deck
Unlock for access to all 49 flashcards in this deck.
Unlock Deck
k this deck
11
When considering effects on the automobile market, a decrease in auto worker health benefits leads to:
A) a shift in demand.
B) movement along the supply curve.
C) movement along the demand curve.
D) a shift in supply.
A) a shift in demand.
B) movement along the supply curve.
C) movement along the demand curve.
D) a shift in supply.
Unlock Deck
Unlock for access to all 49 flashcards in this deck.
Unlock Deck
k this deck
12
A multiple regression model necessarily involves:
A) a linear relation.
B) more than one X variable.
C) a multiplicative relation.
D) more than one Y variable.
A) a linear relation.
B) more than one X variable.
C) a multiplicative relation.
D) more than one Y variable.
Unlock Deck
Unlock for access to all 49 flashcards in this deck.
Unlock Deck
k this deck
13
Heteroskedasticity is produced by:
A) normally distributed residuals.
B) randomly distributed residuals.
C) autocorrelation.
D) nonconstant variance in the disturbance term.
A) normally distributed residuals.
B) randomly distributed residuals.
C) autocorrelation.
D) nonconstant variance in the disturbance term.
Unlock Deck
Unlock for access to all 49 flashcards in this deck.
Unlock Deck
k this deck
14
If P1 = $5, Q1 = 10,000, P2 = $6 and Q2 = 5,000, then a linear estimate of the demand curve is:
A) P = $7 - $0.002Q
B) P = $5 + $10,000Q
C) Q = 7 - 0.002P
D) Q = 35,000 - 5,000P
A) P = $7 - $0.002Q
B) P = $5 + $10,000Q
C) Q = 7 - 0.002P
D) Q = 35,000 - 5,000P
Unlock Deck
Unlock for access to all 49 flashcards in this deck.
Unlock Deck
k this deck
15
Demand estimation in a controlled environment is possible with:
A) market experiments.
B) field studies.
C) regression analysis.
D) consumer surveys.
A) market experiments.
B) field studies.
C) regression analysis.
D) consumer surveys.
Unlock Deck
Unlock for access to all 49 flashcards in this deck.
Unlock Deck
k this deck
16
A linear model implies:
A) a constant effect of X on Y.
B) constant elasticity.
C) a log-linear relation.
D) a constant effect of Y on X.
A) a constant effect of X on Y.
B) constant elasticity.
C) a log-linear relation.
D) a constant effect of Y on X.
Unlock Deck
Unlock for access to all 49 flashcards in this deck.
Unlock Deck
k this deck
17
The long-run effect on demand of competitor product-development strategies is:
A) less than the short-run effect.
B) the same as the short-run effect.
C) unrelated to the short-run effect.
D) greater than the short-run effect.
A) less than the short-run effect.
B) the same as the short-run effect.
C) unrelated to the short-run effect.
D) greater than the short-run effect.
Unlock Deck
Unlock for access to all 49 flashcards in this deck.
Unlock Deck
k this deck
18
Demand is always reduced by unanticipated changes in:
A) technology that reduces production costs.
B) foreign competition.
C) government regulation that limits profits.
D) energy prices that increase production costs.
A) technology that reduces production costs.
B) foreign competition.
C) government regulation that limits profits.
D) energy prices that increase production costs.
Unlock Deck
Unlock for access to all 49 flashcards in this deck.
Unlock Deck
k this deck
19
After controlling for the influence of all X variables, the standard deviation of the dependent Y variable is given by:
A) R2
B)
C) SEE
D)
A) R2
B)
C) SEE
D)
Unlock Deck
Unlock for access to all 49 flashcards in this deck.
Unlock Deck
k this deck
20
A deterministic relation is:
A) a simultaneous relation.
B) an imprecise link between two variables.
C) an association that is known with certainty.
D) a concurrent association.
A) a simultaneous relation.
B) an imprecise link between two variables.
C) an association that is known with certainty.
D) a concurrent association.
Unlock Deck
Unlock for access to all 49 flashcards in this deck.
Unlock Deck
k this deck
21
One-Tail t-tests. Martin's Footwear, Inc., of Boston, Massachusetts has retained you to aid the firm in an evaluation of its marketing strategy. Martin's "Happy Feet" running shoes are marketed through local retail outlets in the eastern United States. A move to extend Martin's market to Midwestern and western states is currently being contemplated.
A marketing research group conducted an empirical analysis of demand for Martin's "Happy Feet" during 2008 in thirty-six regional markets and found the following (standard errors in parentheses):
A marketing research group conducted an empirical analysis of demand for Martin's "Happy Feet" during 2008 in thirty-six regional markets and found the following (standard errors in parentheses):
Unlock Deck
Unlock for access to all 49 flashcards in this deck.
Unlock Deck
k this deck
22
A. If , there is a perfect direct line ar relation between the dependent variable and the independent variable.
B. is the proportion of total variation in the independent variables that is explained by the dependent variable.
C. when a given regression model is unable to explain of the variation in the dependent variable.
D. When a simple regression model is unable to explain of demand variation, the coefficient of correlation equals .
E. In a simple regression model with only one independent variable, the correlation coefficient falls in the range between 1 and 0
Unlock Deck
Unlock for access to all 49 flashcards in this deck.
Unlock Deck
k this deck
23
Demand Curve Estimation. The Real Kool Toys Company manufactures and sells educational toys. An empirical demand function for one of the firm's products has been estimated over the last 21 quarters using regression analysis. The estimated demand function is:
Standard Error of the Estimate = 1,000
Here QY is quantity (measured in units) of Product Y demanded in the current period, A is hundreds of dollars of advertising ($00), I is thousands of dollars of disposable income per capita ($000), and PX is the price ($) of another toy manufactured by a competitor, ABC Toys. The terms in parentheses are the standard errors of the coefficients.
Standard Error of the Estimate = 1,000Here QY is quantity (measured in units) of Product Y demanded in the current period, A is hundreds of dollars of advertising ($00), I is thousands of dollars of disposable income per capita ($000), and PX is the price ($) of another toy manufactured by a competitor, ABC Toys. The terms in parentheses are the standard errors of the coefficients.
Unlock Deck
Unlock for access to all 49 flashcards in this deck.
Unlock Deck
k this deck
24
The number of observations beyond the minimum needed to calculate a given regression statistic is called:
A) a measure of the goodness of fit for a multiple regression model.
B) degrees of freedom.
C) the square of the coefficient of multiple correlation.
D) a measure of statistical significance for the share of dependent variable variation explained by the regression model.
A) a measure of the goodness of fit for a multiple regression model.
B) degrees of freedom.
C) the square of the coefficient of multiple correlation.
D) a measure of statistical significance for the share of dependent variable variation explained by the regression model.
Unlock Deck
Unlock for access to all 49 flashcards in this deck.
Unlock Deck
k this deck
25
A. The standard error of the estimate . be bued to determine a range within which the independent variables can be predicted with varying degrees of statistical confidence based on the regression coefficients and the value for the variable.
B. The best estimate of the value for the dependent variable is
, as predicted by the regression equation
C. If the u error terms are normally distributed about the regression equation, there is a probability that observations of the dependent variable will lie within roughly three standard errors of the estimate.
D. If , there is a perfect inverse line ar relation between the dependent variable and a single independent variable.
E. If , the dependent and independent variables are autonomous.
Unlock Deck
Unlock for access to all 49 flashcards in this deck.
Unlock Deck
k this deck
26
Regression Statistics. June Ward, controller for NAFTA, Inc., has asked you to analyze demand in 30 regional markets for Beaver's Cleavers, a new brush cutting device, dubbed Product Y. A statistical analysis of demand in these markets shows (standard errors in parentheses):
Standard Error of the Estimate = 40
Here, QY is market demand for Product Y, P is the price of Y in dollars, A is dollars of advertising expenditures, PX is the average price in dollars of another (unidentified) product, and I is dollars of household income. In a typical market, the price of Y is $100, PX is $50, and disposable income per family averages $80,000.
Standard Error of the Estimate = 40Here, QY is market demand for Product Y, P is the price of Y in dollars, A is dollars of advertising expenditures, PX is the average price in dollars of another (unidentified) product, and I is dollars of household income. In a typical market, the price of Y is $100, PX is $50, and disposable income per family averages $80,000.
Unlock Deck
Unlock for access to all 49 flashcards in this deck.
Unlock Deck
k this deck
27
Elasticity Estimation. The Lincoln National Life Insurance Company offers a wide variety of insurance products, including whole-life and term policies. The company has compiled the following data concerning policy sales during recent years:
*Price is quoted in terms of cost per $1,000 of coverage.
*Price is quoted in terms of cost per $1,000 of coverage. Unlock Deck
Unlock for access to all 49 flashcards in this deck.
Unlock Deck
k this deck
28
A. Constant elasticities of demand are observed at different points along a linear demand curve.
B. In the linear model approach, the effect on demand of a one-unit change in any independent variable is assumed to be constant.
C. In the log-linear model approach, the effect of a one-unit change in any independent variable will tend to vary.
D. The elasticities of demand are different at various points along a multiplicative demand curve.
E. Log-linear models assume constant elasticities.
Unlock Deck
Unlock for access to all 49 flashcards in this deck.
Unlock Deck
k this deck
29
Regression Statistics. Financial Planning Associates, Ltd., has hired you to analyze demand in 30 regional markets for custom financial plans for high net worth individuals (Product Y). A statistical analysis of demand in these markets shows (standard errors in parentheses):
Standard Error of the Estimate = 5
Here, QY is market demand for Product Y, P is the price of Y in dollars, A is dollars of advertising expenditures, PX is the average price in dollars of another (unidentified) product, and I is dollars of household income. In a typical market, the price of Y is $2,000, PX is $1,000, advertising expenditures are $120,000, and average family income is $200,000.
Standard Error of the Estimate = 5Here, QY is market demand for Product Y, P is the price of Y in dollars, A is dollars of advertising expenditures, PX is the average price in dollars of another (unidentified) product, and I is dollars of household income. In a typical market, the price of Y is $2,000, PX is $1,000, advertising expenditures are $120,000, and average family income is $200,000.
Unlock Deck
Unlock for access to all 49 flashcards in this deck.
Unlock Deck
k this deck
30
Expected Demand Estimation. Snack Foods International, Ltd. has hired you to analyze demand in 25 regional markets for a new Product Y, called Angelica Pickles. A statistical analysis of demand in these markets shows (standard errors in parentheses):
Standard Error of the Estimate = 75
Here, QY is market demand for Product Y, P is the price of Y in dollars, A is dollars of advertising expenditures, PX is the average price in dollars of another (unidentified) product, and I is dollars of household income. In a typical market, the price of Y is $1,500, PX is $500, advertising expenditures are $50,000, and disposable income per household is $45,000.
Standard Error of the Estimate = 75Here, QY is market demand for Product Y, P is the price of Y in dollars, A is dollars of advertising expenditures, PX is the average price in dollars of another (unidentified) product, and I is dollars of household income. In a typical market, the price of Y is $1,500, PX is $500, advertising expenditures are $50,000, and disposable income per household is $45,000.
Unlock Deck
Unlock for access to all 49 flashcards in this deck.
Unlock Deck
k this deck
31
Tests of the b = 0 hypothesis are:
A) tests for the share of dependent variable variation explained by the regression model.
B) one-tail t tests.
C) two-tail t tests
D) tests of direction or comparative magnitude.
A) tests for the share of dependent variable variation explained by the regression model.
B) one-tail t tests.
C) two-tail t tests
D) tests of direction or comparative magnitude.
Unlock Deck
Unlock for access to all 49 flashcards in this deck.
Unlock Deck
k this deck
32
Suppose Q1 = 50 when P1 = $25, and Q2 = 20 when P2 = $40. A linear estimate of the demand curve is:
A) P = $50 - $0.5Q
B) P = $50 + $0.5Q
C) Q = 100 + 2P
D) Q = 100 - 0.5P
A) P = $50 - $0.5Q
B) P = $50 + $0.5Q
C) Q = 100 + 2P
D) Q = 100 - 0.5P
Unlock Deck
Unlock for access to all 49 flashcards in this deck.
Unlock Deck
k this deck
33
The Identification Problem. Business is booming for Complex Controls, Inc., a leading supplier of analog/digital circuits and systems used for measurement and control. The average price received by CCI for the XKE device, and the number sold (output) over the past six quarters are as follows:
Quarterly demand and supply curves for CCI services are:
where Q is output (000), P is price, T is a trend factor, and T = 1 during Q-1 and increases by one unit per quarter.
Quarterly demand and supply curves for CCI services are: where Q is output (000), P is price, T is a trend factor, and T = 1 during Q-1 and increases by one unit per quarter.
Unlock Deck
Unlock for access to all 49 flashcards in this deck.
Unlock Deck
k this deck
34
A. Demand estimation is made difficult by the fact that customer self-interest often mitigates against the accuracy of demand information gained through consumer interviews.
B. Customers are often more clear about their method of product selection than they are about the actual products selected.
C. A positive relation between product demand and price is a natural byproduct of falling advertising expenditures.
D. Providing suppliers with demand information can have the effect of reducing the price effect of an anticipated increase in demand.
E. If suppliers operate in an industry facing increasing average costs, an increase in productive capacity leads to an increase in the quantity demanded.
Unlock Deck
Unlock for access to all 49 flashcards in this deck.
Unlock Deck
k this deck
35
A. The identification problem relates to the difficulty encountered in properly isolating dependent variables that influence a given independent variable.
B. To accurately model the demand function for a given product, the demand effects of all relevant dependent variables must be incorporated.
C. Solving the identification problem is made easier by the fact that many factors influence both demand and supply.
D. Accurate demand estimation requires consideration of all relevant independent variables and use of a theoretically appropriate empirical model.
E. The process of accurately modeling the link between dependent Y variables and independent X variables is easier for static as opposed to dynamic demand relations.
Unlock Deck
Unlock for access to all 49 flashcards in this deck.
Unlock Deck
k this deck
36
Demand Curve Estimation. Linux Servers, Inc., is a leading supplier of high-speed servers with enormous storage capacity. Average price and annual unit sales data for the VAX-7500 high-speed machine are as follows:
Unlock Deck
Unlock for access to all 49 flashcards in this deck.
Unlock Deck
k this deck
37
A multiplicative model is:
A) a plot of XY data.
B) the relation between one dependent Y variable and one independent X variable.
C) a straight-line relation.
D) a nonlinear relation that involves X variable interactions.
A) a plot of XY data.
B) the relation between one dependent Y variable and one independent X variable.
C) a straight-line relation.
D) a nonlinear relation that involves X variable interactions.
Unlock Deck
Unlock for access to all 49 flashcards in this deck.
Unlock Deck
k this deck
38
In a multiplicative demand model, the income elasticity of demand can be influenced by:
A) income.
B) price.
C) price of other goods.
D) all of these.
A) income.
B) price.
C) price of other goods.
D) all of these.
Unlock Deck
Unlock for access to all 49 flashcards in this deck.
Unlock Deck
k this deck
39
R2 and t statistics. Boris Yeltsin Products, Inc., has hired you to analyze demand in 30 regional markets for Product Y, a new vodka beverage. A statistical analysis of demand in these markets shows (standard errors in parentheses):
Standard Error of the Estimate = 20
Here, QY is market demand for Product Y, P is the price of Y in dollars, A is dollars of advertising expenditures, PX is the average price in dollars of another (unidentified) product, and I is dollars of household income. In a typical market, the price of Y is $500, PX is $600, advertising expenditures are $10,000, and average per capita income is $40,000.
Standard Error of the Estimate = 20Here, QY is market demand for Product Y, P is the price of Y in dollars, A is dollars of advertising expenditures, PX is the average price in dollars of another (unidentified) product, and I is dollars of household income. In a typical market, the price of Y is $500, PX is $600, advertising expenditures are $10,000, and average per capita income is $40,000.
Unlock Deck
Unlock for access to all 49 flashcards in this deck.
Unlock Deck
k this deck
40
Price Elasticity Estimation. Thomas Magnum, a financial analyst for Detroit Wheels, Inc., has been hired to analyze demand in 20 regional markets for Product Y, a major item. A statistical analysis of demand in these markets shows (standard errors in parentheses):
Standard Error of the Estimate = 10
Here, QY is market demand for Product Y, P is the price of Y in dollars, A is dollars of advertising expenditures, PX is the average price in dollars of another (unidentified) product, and I is dollars of household income. In a typical market, the price of Y is $100, PX is $75, advertising expenditures are $50,000, and average family income is $80,000.
Standard Error of the Estimate = 10Here, QY is market demand for Product Y, P is the price of Y in dollars, A is dollars of advertising expenditures, PX is the average price in dollars of another (unidentified) product, and I is dollars of household income. In a typical market, the price of Y is $100, PX is $75, advertising expenditures are $50,000, and average family income is $80,000.
Unlock Deck
Unlock for access to all 49 flashcards in this deck.
Unlock Deck
k this deck
41
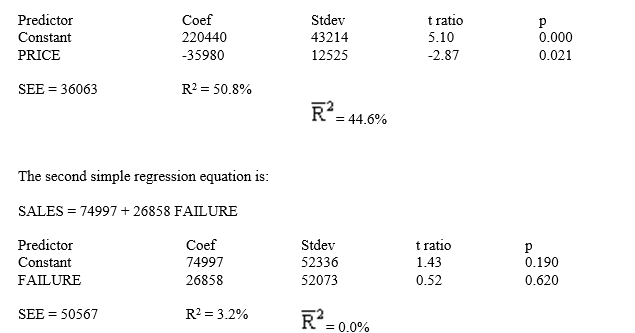
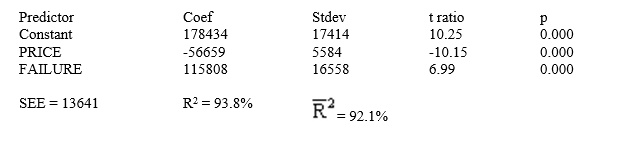
Multiple Regression. Maastrict Controls, Ltd., is a regional producer of sophisticated precision control devices. To assess the potential payoff to adopting the recommendations of a Total Quality Management (TQM) seminar attended by managerial staff, the company has decided to analyze the sales effects of price and product quality for a range of leading products. The company recently compiled and used a regression analysis approach to study the following unit sales, price, and product quality information:
As a first step in the analysis, the company ran simple regressions of unit sales on each of the potentially important independent variables of price and the percent failure rate (product quality):
SALES = 220440 - 35980 PRICE
SALES = 178434 - 56659 PRICE + 115808 FAILURE
As a first step in the analysis, the company ran simple regressions of unit sales on each of the potentially important independent variables of price and the percent failure rate (product quality):SALES = 220440 - 35980 PRICE
SALES = 178434 - 56659 PRICE + 115808 FAILURE
Unlock Deck
Unlock for access to all 49 flashcards in this deck.
Unlock Deck
k this deck
42
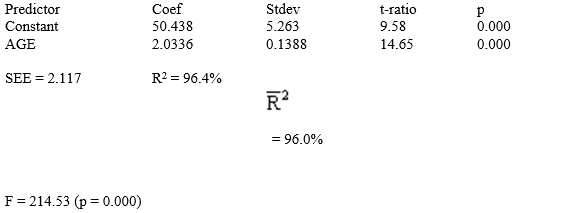
Correlation and Simple Regression. Market Analysis, Inc., has conducted a survey to learn the income characteristics of an N = 10 sample of department store customers. The survey asked each customer his or her age and household annual income. Survey results were as follows
The regression equation is:
INCOME = 50.4 + 2.03 AGE
The regression equation is:
INCOME = 50.4 + 2.03 AGE
Unlock Deck
Unlock for access to all 49 flashcards in this deck.
Unlock Deck
k this deck
43
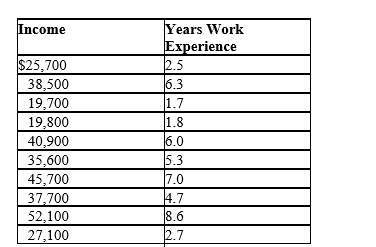
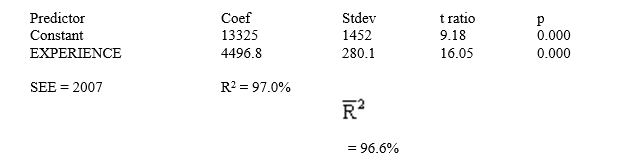
Correlation and Simple Regression. Test Markets, Inc., has conducted a survey to learn the income characteristics of an n = 10 sample of construction workers. The survey asked worker his or her annual income and number of years work experience. Survey results are:
The regression equation is:
INCOME = 13325 + 4497 EXPERIENCE
The regression equation is:
INCOME = 13325 + 4497 EXPERIENCE
Unlock Deck
Unlock for access to all 49 flashcards in this deck.
Unlock Deck
k this deck
44
Demand Estimation. The Wallpaper Shop, Inc., is a rapidly growing chain of wallpaper shops that caters to the do-it-yourself home remodeling market. During the past year, 15 stores were operated in small to medium-size metropolitan markets. An in-house study of sales by these outlets revealed the following (standard errors in parentheses):
Standard Error of the Estimate = 800.
Here, Q is the number of customers served, P is the average price per customer, PX is the average cost of professionally wallpapering a small room, A is advertising expenditures (in dollars), I is disposable income per capita (in dollars), and GR is the rate of population growth per year (in percent).
Standard Error of the Estimate = 800.Here, Q is the number of customers served, P is the average price per customer, PX is the average cost of professionally wallpapering a small room, A is advertising expenditures (in dollars), I is disposable income per capita (in dollars), and GR is the rate of population growth per year (in percent).
Unlock Deck
Unlock for access to all 49 flashcards in this deck.
Unlock Deck
k this deck
45
z-Statistics. Fantastic Footwear, Inc., of Freeport, Maine, has retained you to aid the firm in an evaluation of its marketing strategy. Fantastic Footwear shoes are marketed through "factory outlet" malls located along the eastern seaboard. A move to extend the company's market to Midwestern and Western states is currently being contemplated.
A marketing research group conducted an empirical analysis of demand for the company's shoes during 2008 in twenty regional markets and found the following (standard errors in parentheses):
Standard error of the estimate = 500
where Q = quantity sold (in pairs of shoes), P = price (in dollars), PX is the average price of shoes in competitor stores, and M is the distance in miles to the nearest competing factory outlet mall.
Champaign-Urbana, Illinois is a potential Midwestern market with economic characteristics typical of those eastern markets included in the empirical analysis. In Champaign-Urbana, expected levels are: P = $60, PX = $80 and M = 200 miles.
A marketing research group conducted an empirical analysis of demand for the company's shoes during 2008 in twenty regional markets and found the following (standard errors in parentheses):
Standard error of the estimate = 500where Q = quantity sold (in pairs of shoes), P = price (in dollars), PX is the average price of shoes in competitor stores, and M is the distance in miles to the nearest competing factory outlet mall.
Champaign-Urbana, Illinois is a potential Midwestern market with economic characteristics typical of those eastern markets included in the empirical analysis. In Champaign-Urbana, expected levels are: P = $60, PX = $80 and M = 200 miles.
Unlock Deck
Unlock for access to all 49 flashcards in this deck.
Unlock Deck
k this deck
46
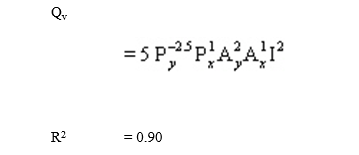
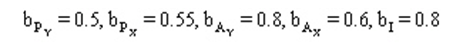
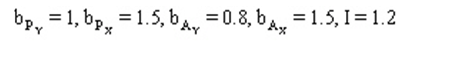
Elasticity Estimation. Breakaway Tours, Inc., has estimated the following multiplicative demand function for packaged holiday tours in the Flushing, New York, market using quarterly data covering the past five years (20 observations):
Standard Error of the Estimate = 10.
Here, Qy is the quantity of tours sold, Py is average tour price, Px is average price for some other good, Ay is tour advertising, Ax is advertising of some other good, and I is per capita disposable income. The standard errors of the exponents in the preceding multiplicative demand function are
Standard Error of the Estimate = 10.Here, Qy is the quantity of tours sold, Py is average tour price, Px is average price for some other good, Ay is tour advertising, Ax is advertising of some other good, and I is per capita disposable income. The standard errors of the exponents in the preceding multiplicative demand function are
Unlock Deck
Unlock for access to all 49 flashcards in this deck.
Unlock Deck
k this deck
47
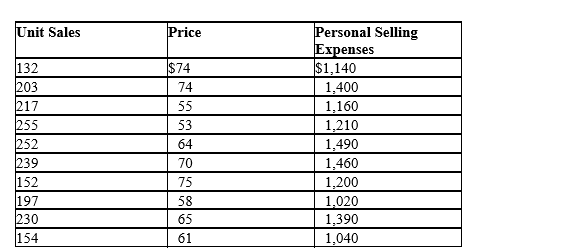
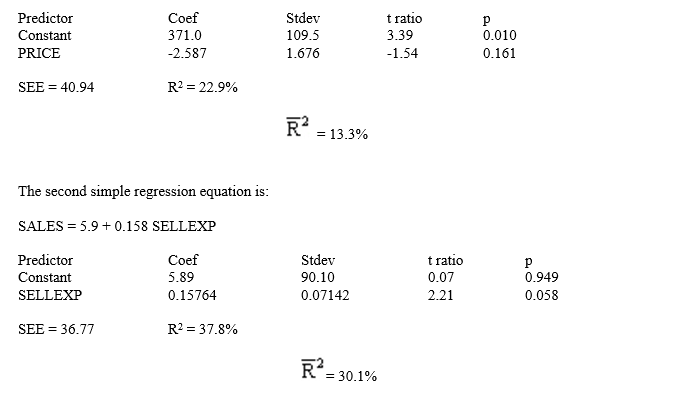
Multiple Regression. Kitchen Products, Ltd., is a regional distributor of Regal Bread Making Machine. The company wishes to assess the relative importance of price reductions versus an increase in personal selling efforts as means for enhancing product promotion. To this end, the company recently used a regression analysis approach to study the following monthly unit sales, price, and personal selling expense information for the Bozeman, Montana market:
As a first step in the analysis, the company ran simple regressions of unit sales on each of the potentially important independent variables of price and personal selling expenses:
The first simple regression equation is:
SALES = 371 - 2.59 PRICE
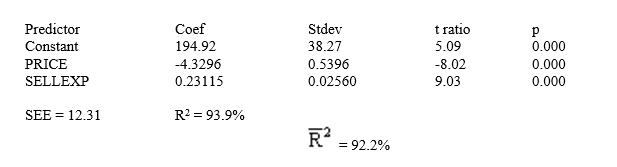
The multiple regression equation is:
SALES = 195 - 4.33 PRICE + 0.231 SELLEXP
As a first step in the analysis, the company ran simple regressions of unit sales on each of the potentially important independent variables of price and personal selling expenses:
The first simple regression equation is:
SALES = 371 - 2.59 PRICE
The multiple regression equation is:
SALES = 195 - 4.33 PRICE + 0.231 SELLEXP
Unlock Deck
Unlock for access to all 49 flashcards in this deck.
Unlock Deck
k this deck
48
One-tail t tests. A study of the demand for imported motorcycles recently appeared in an industry newsletter. According to the study, demand for motorcycle imports is described by the function:
Standard error of the estimate = 30
Here QY is the quantity of motorcycles imported (000), PY is average motorcycle price ($), PX is the average price of imported compact cars, AY is motorcycle industry advertising ($000,000), AX is industry advertising of compact cars ($000,000), and I is average disposable family income ($000). The standard errors of the exponents in the multiplicative demand function above are:
And finally, this demand function was estimated using two years of monthly data (24 observations).
Standard error of the estimate = 30Here QY is the quantity of motorcycles imported (000), PY is average motorcycle price ($), PX is the average price of imported compact cars, AY is motorcycle industry advertising ($000,000), AX is industry advertising of compact cars ($000,000), and I is average disposable family income ($000). The standard errors of the exponents in the multiplicative demand function above are:
And finally, this demand function was estimated using two years of monthly data (24 observations).
Unlock Deck
Unlock for access to all 49 flashcards in this deck.
Unlock Deck
k this deck
49
Profit Probability Estimation. Intimate Lighting, Inc., is a rapidly growing lighting accessory outlets that caters to the do-it-yourself home remodeling market. During the past year, 18 stores were operated in small to medium-size metropolitan markets. An in-house study of sales by these outlets revealed the following (standard errors in parentheses):
Standard Error of the Estimate = 500.
Here, Q is unit sales, P is unit price, PX is the average unit price at competitor stores, A is advertising expenditures, and I is income per capita.
A. Tucson, Arizona was a typical market covered by this analysis. In the Tucson market, "own" price was $60, competitor price was $45, advertising was $13,500, and income was an average $80,000. Calculate and interpret the expected level of unit sales, as well as the 95% and 99% confidence regions for actual sales.
B. Calculate the 95% and 99% confidence regions for actual revenues in the Tucson market.
C. Estimate the probability that the Tucson store made a profit during this period if total costs were $1,735,200.
Standard Error of the Estimate = 500.Here, Q is unit sales, P is unit price, PX is the average unit price at competitor stores, A is advertising expenditures, and I is income per capita.
A. Tucson, Arizona was a typical market covered by this analysis. In the Tucson market, "own" price was $60, competitor price was $45, advertising was $13,500, and income was an average $80,000. Calculate and interpret the expected level of unit sales, as well as the 95% and 99% confidence regions for actual sales.
B. Calculate the 95% and 99% confidence regions for actual revenues in the Tucson market.
C. Estimate the probability that the Tucson store made a profit during this period if total costs were $1,735,200.
Unlock Deck
Unlock for access to all 49 flashcards in this deck.
Unlock Deck
k this deck
Unlock Deck
Unlock for access to all 49 flashcards in this deck.


