Deck 15: Financial Statement Analysis
Full screen (f)
Question
Question
Question
Question
Question
Question
Question
Question
Question
Question
Question
Question
Question
Question
Question
Question
Question
Question
Question
Question
Question
Question
Question
Question
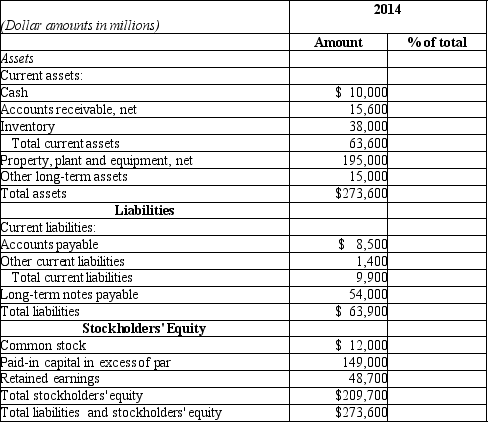
La Paz Company reported the following information
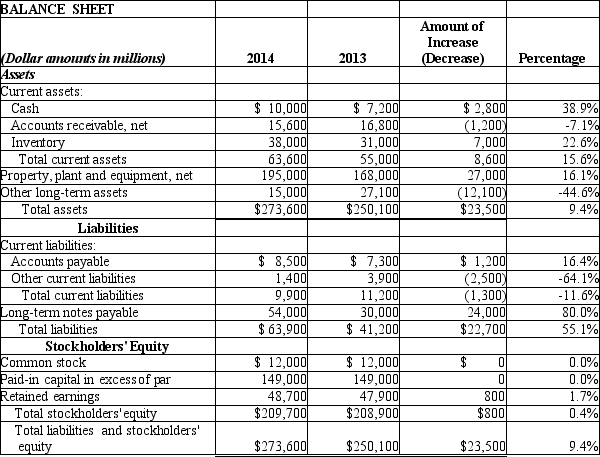
Which of the following statements is an accurate conclusion about 2014 balances, based on the above data?
A) Although assets grew by over 9%, there was very little rise in stockholders' equity.
B) Total assets dropped slightly in 2014, but there was a significant reduction in total liabilities.
C) The increase in long-term liabilities was offset nearly dollar for dollar by a decrease in current liabilities.
D) The nearly 45% decrease in other long-term assets contributed to an overall decline in total assets.
Question
Question
Question
Question
Question
Question
Question
Question
Question
Question
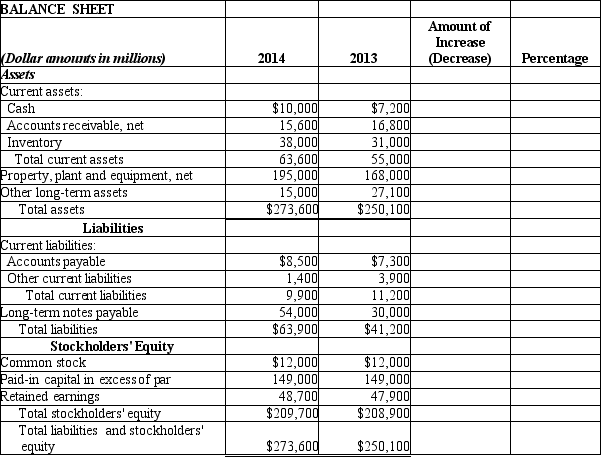
Portofino Company provides the following comparative balance sheet data. Please complete a horizontal analysis using the format shown here:
Question
Question
Question
Question
Question
Question
Question
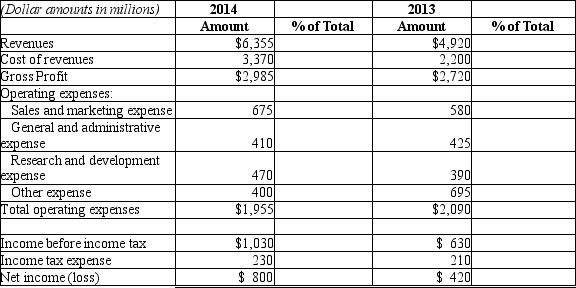
Please complete the vertical analysis on the income statement data in the format below:
Question
Question
Question
Question
Question
Question
Question
Question
Question
Question
Question
Question
Question
Question
Please complete the vertical analysis on the balance sheet data in the format below: 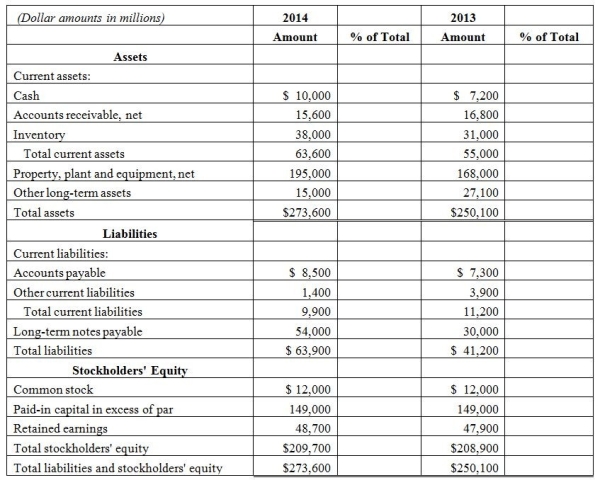
Question
Please complete a vertical analysis on the balance sheet data shown in the format below:
Question
Question
Question
Question
Please refer to the following data: 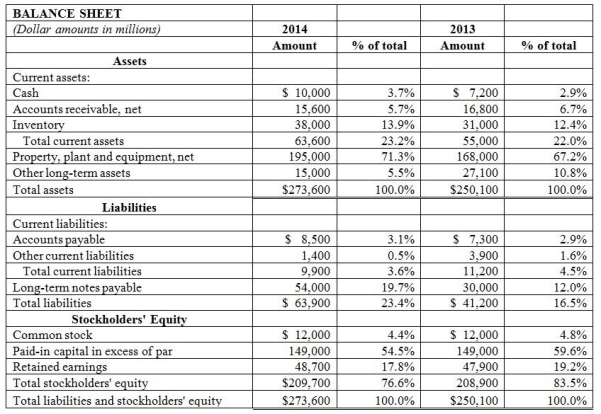 Which of the following is a valid conclusion from the above data?
A) The company shifted toward greater debt financing and less equity financing over the 2-year period.
B) The company relied heavily on retained earnings to finance asset growth in 2014.
C) Current asset and current liability data suggest a liquidity problem in 2014.
D) The balance in Retained earnings declined over a 2-year period.
Which of the following is a valid conclusion from the above data?A) The company shifted toward greater debt financing and less equity financing over the 2-year period.
B) The company relied heavily on retained earnings to finance asset growth in 2014.
C) Current asset and current liability data suggest a liquidity problem in 2014.
D) The balance in Retained earnings declined over a 2-year period.
Question
Question
Question
Question
Question
Question
Question
Question
Question
Question
Question
Question
Question
Question
Question
Question
Question
Question
Question
Question

Unlock Deck
Sign up to unlock the cards in this deck!
Unlock Deck
Unlock Deck
1/161
Play
Full screen (f)
Deck 15: Financial Statement Analysis
1
The following is a summary of information presented on the financial statements of The Cake Company on December 31, 2014.
-
What would a horizontal analysis report with respect to current liabilities?
A) That current liabilities are 38.46% of total capital
B) A 50.00% increase in current liabilities
C) A current ratio of .87
D) A 33.33% increase in current liabilities
-
What would a horizontal analysis report with respect to current liabilities?
A) That current liabilities are 38.46% of total capital
B) A 50.00% increase in current liabilities
C) A current ratio of .87
D) A 33.33% increase in current liabilities
B
2
Benchmarking is the comparison of a company's current year results with an earlier year's performance.
False
3
Please refer to the following trend analysis of Pathways Company:
-
Which of the following is a correct conclusion from the above analysis?
A) Net sales in 2013 were equal to 90.5% of year 2012 net sales.
B) Net sales in 2013 were up 90.5% over the previous year.
C) Net sales in 2013 were equal to 90.5% of 2010 net sales.
D) Net sales in 2013 were down 90.5% from year 2010.
Net sales in 2013 were equal to 90.5% of 2010 net sales.
4
If an analyst wishes to see how sales revenue of a company has changed from one year to the next, which of the following types of financial statement analysis would be used?
A) Vertical analysis
B) Horizontal analysis
C) Ratio analysis
D) Common-size financial statement analysis
A) Vertical analysis
B) Horizontal analysis
C) Ratio analysis
D) Common-size financial statement analysis
Unlock Deck
Unlock for access to all 161 flashcards in this deck.
Unlock Deck
k this deck
5
Which of the following BEST describes horizontal analysis?
A) Comparing figures year to year
B) Showing each figure as a percentage of some other amount, such as total assets
C) Comparing a company's financial figures with other companies that are leaders
D) Calculating key ratios to evaluate performance
A) Comparing figures year to year
B) Showing each figure as a percentage of some other amount, such as total assets
C) Comparing a company's financial figures with other companies that are leaders
D) Calculating key ratios to evaluate performance
Unlock Deck
Unlock for access to all 161 flashcards in this deck.
Unlock Deck
k this deck
6
Investors and creditors generally evaluate a company by using one year's data.
Unlock Deck
Unlock for access to all 161 flashcards in this deck.
Unlock Deck
k this deck
7
The following is a summary of information presented on the financial statements of The Cake Company on December 31, 2014.
-
What would horizontal analysis report with respect to long-term liabilities?
A) That long-term liabilities decreased by $30,000
B) That long-term liabilities decreased by 40%
C) That long-term liabilities decreased by 60%
D) That long-term liabilities decreased by 67%
-
What would horizontal analysis report with respect to long-term liabilities?
A) That long-term liabilities decreased by $30,000
B) That long-term liabilities decreased by 40%
C) That long-term liabilities decreased by 60%
D) That long-term liabilities decreased by 67%
Unlock Deck
Unlock for access to all 161 flashcards in this deck.
Unlock Deck
k this deck
8
The following data on Alpha Products, Inc. is available.
Alpha Products, Inc
Comparative Balance Sheet
December 31, 2013 and December 31, 2014
What was the percent increase or decrease in net property, plant and equipment from 2013 to 2014?
A) 12.2% decrease
B) 12.2% increase
C) 13.8% increase
D) 13.8% decrease
Alpha Products, Inc
Comparative Balance Sheet
December 31, 2013 and December 31, 2014
What was the percent increase or decrease in net property, plant and equipment from 2013 to 2014?
A) 12.2% decrease
B) 12.2% increase
C) 13.8% increase
D) 13.8% decrease
Unlock Deck
Unlock for access to all 161 flashcards in this deck.
Unlock Deck
k this deck
9
A company reported the following amounts of net income:
-
Which of the following is the percentage change in net income from 2012 to 2013?
A) 2.00%
B) 10.00%
C) 8.33%
D) 7.69%
-
Which of the following is the percentage change in net income from 2012 to 2013?
A) 2.00%
B) 10.00%
C) 8.33%
D) 7.69%
Unlock Deck
Unlock for access to all 161 flashcards in this deck.
Unlock Deck
k this deck
10
Horizontal analysis compares each item in the income statement to the net sales amount.
Unlock Deck
Unlock for access to all 161 flashcards in this deck.
Unlock Deck
k this deck
11
If an analyst wishes to see how gross profit of a company has changed from one year to the next, vertical analysis would be the best approach.
Unlock Deck
Unlock for access to all 161 flashcards in this deck.
Unlock Deck
k this deck
12
Please refer to the following trend analysis of Pathways Company:
-
Which of the following is a correct conclusion from the above analysis?
A) Net sales in 2014 were equal 102.3% of net sales for the previous year.
B) Net sales in 2014 were up 2.3% over the previous year.
C) Net sales in 2014 were 2.3% higher than 2010 net sales.
D) Net sales in 2014 were down 90.5% from year 2010.
Unlock Deck
Unlock for access to all 161 flashcards in this deck.
Unlock Deck
k this deck
13
The net income for a company was $540,000 this year and $630,000 last year. Net income decreased by 17%.
Unlock Deck
Unlock for access to all 161 flashcards in this deck.
Unlock Deck
k this deck
14
A company reported the following amounts of net income:
-
Which of the following is the percentage change in net income from 2011 to 2012?
A) 33.33%
B) 8.33%
C) 10.00%
D) 30.00%
-
Which of the following is the percentage change in net income from 2011 to 2012?
A) 33.33%
B) 8.33%
C) 10.00%
D) 30.00%
Unlock Deck
Unlock for access to all 161 flashcards in this deck.
Unlock Deck
k this deck
15
Which of the following BEST describes trend analysis?
A) Calculating key ratios to evaluate performance
B) Showing each figure as a percentage of some other amount, such as total assets
C) Comparing a company's financial figures with other companies that are leaders
D) Showing each year's figures as a percentage of amounts for a base year
A) Calculating key ratios to evaluate performance
B) Showing each figure as a percentage of some other amount, such as total assets
C) Comparing a company's financial figures with other companies that are leaders
D) Showing each year's figures as a percentage of amounts for a base year
Unlock Deck
Unlock for access to all 161 flashcards in this deck.
Unlock Deck
k this deck
16
The following is a summary of information presented on the financial statements of The Cake Company on December 31, 2014.
-
What would horizontal analysis report with respect to net income before income tax expense and net income?
A) That both net income before income tax expense and net income are 45.45% of net sales revenue
B) A $25,000 increase in both net income before income tax expense and net income
C) A 45.45% increase in both net income before income tax expense and net income
D) A 145% increase in both net income before income tax expense and net income
Unlock Deck
Unlock for access to all 161 flashcards in this deck.
Unlock Deck
k this deck
17
The following is a summary of information presented on the financial statements of The Cake Company on December 31, 2014.
-
What would a horizontal analysis report with respect to current assets?
A) An inventory turnover of 8 times
B) A 30% increase in current assets
C) A current ratio of .87
D) Current assets that are 33.33% of total assets
-
What would a horizontal analysis report with respect to current assets?
A) An inventory turnover of 8 times
B) A 30% increase in current assets
C) A current ratio of .87
D) Current assets that are 33.33% of total assets
Unlock Deck
Unlock for access to all 161 flashcards in this deck.
Unlock Deck
k this deck
18
The following is a summary of information presented on the financial statements of The Cake Company on December 31, 2014.
-
What would horizontal analysis report with respect to selling and general expenses?
A) An 11.11% increase in selling and general expenses
B) That selling and general expenses are 10.00% of net sales revenue
C) A 10.00% decrease in selling and general expenses
D) That selling and general expenses are 8.57% of net sales revenue
Unlock Deck
Unlock for access to all 161 flashcards in this deck.
Unlock Deck
k this deck
19
If an analyst wishes to see how operating expenses of a company have changed from one year to the next, using a horizontal analysis would be the best approach.
Unlock Deck
Unlock for access to all 161 flashcards in this deck.
Unlock Deck
k this deck
20
The following is a summary of information presented on the financial statements of The Cake Company on December 31, 2014.
-
What would horizontal analysis report with respect to net sales revenue?
A) A 5% increase in net sales revenue
B) A dividend yield of $8.20
C) That cost of goods sold is 79.19% of net sales revenue
D) An accounts receivable turnover of 7.24 times
-
What would horizontal analysis report with respect to net sales revenue?
A) A 5% increase in net sales revenue
B) A dividend yield of $8.20
C) That cost of goods sold is 79.19% of net sales revenue
D) An accounts receivable turnover of 7.24 times
Unlock Deck
Unlock for access to all 161 flashcards in this deck.
Unlock Deck
k this deck
21
Perform a horizontal analysis of the following company's balance sheet. Include both the amount and the percentage of change for each account.
Unlock Deck
Unlock for access to all 161 flashcards in this deck.
Unlock Deck
k this deck
22
If an analyst wishes to see how a company's net income as a percentage of net sales has changed from one year to the next, a vertical analysis would be the most appropriate approach.
Unlock Deck
Unlock for access to all 161 flashcards in this deck.
Unlock Deck
k this deck
23
Which of the following is the base amount when performing vertical analysis of an income statement?
A) Total expenses
B) Net sales
C) Sales revenue
D) Gross profit
A) Total expenses
B) Net sales
C) Sales revenue
D) Gross profit
Unlock Deck
Unlock for access to all 161 flashcards in this deck.
Unlock Deck
k this deck
24
La Paz Company reported the following information
Which of the following statements is an accurate conclusion about 2014 balances, based on the above data?
A) Although assets grew by over 9%, there was very little rise in stockholders' equity.
B) Total assets dropped slightly in 2014, but there was a significant reduction in total liabilities.
C) The increase in long-term liabilities was offset nearly dollar for dollar by a decrease in current liabilities.
D) The nearly 45% decrease in other long-term assets contributed to an overall decline in total assets.
Unlock Deck
Unlock for access to all 161 flashcards in this deck.
Unlock Deck
k this deck
25
If an analyst wishes to see how a company's operating expenses as a percentage of net sales have changed from one year to the next, which of the following types of financial statement analysis would be used?
A) Vertical analysis
B) Horizontal analysis
C) Ratio analysis
D) Common-size financial statement analysis
A) Vertical analysis
B) Horizontal analysis
C) Ratio analysis
D) Common-size financial statement analysis
Unlock Deck
Unlock for access to all 161 flashcards in this deck.
Unlock Deck
k this deck
26
Please refer to the vertical analysis of a section of a balance sheet, shown below:
- Which of the following statements accurately describes the 13.9% shown for Inventory in 2014?
A) In 2014, inventory grew 13.9% over the previous year.
B) In 2014, inventory is equal to 13.9% of total assets.
C) In 2014, inventory was equal to 13.9% of the cash balance.
D) Inventory declined as a percentage of total assets over the 2-year period.
Unlock Deck
Unlock for access to all 161 flashcards in this deck.
Unlock Deck
k this deck
27
Which of the following is the definition of vertical analysis?
A) Vertical analysis is the practice of comparing a company with other companies that are leaders.
B) Vertical analysis is the analysis in which percentages are computed by selecting a base year as 100% and expressing amounts for following years as a percentage of the base amount.
C) Vertical analysis is the study of percentage changes in comparative financial statements.
D) Vertical analysis is the analysis of a financial statement that reveals the relationship of each statement item to a specified base, which is the 100% figure.
Unlock Deck
Unlock for access to all 161 flashcards in this deck.
Unlock Deck
k this deck
28
Perform a horizontal analysis of the following company's income statement. Include both the amount and the percentage of change for each account.
Unlock Deck
Unlock for access to all 161 flashcards in this deck.
Unlock Deck
k this deck
29
Pathways Company provides the following historical data:
Using the year 2010 as a base year, provide a trend analysis using the following format:
Using the year 2010 as a base year, provide a trend analysis using the following format:
Unlock Deck
Unlock for access to all 161 flashcards in this deck.
Unlock Deck
k this deck
30
In a vertical analysis of the income statement, each line item is shown as a percentage of net income.
Unlock Deck
Unlock for access to all 161 flashcards in this deck.
Unlock Deck
k this deck
31
Please refer to the partial balance sheet data provided below:
- Which of the following accurately describes the 3.6% figure shown for total current liabilities in 2014?
A) In 2014, total current liabilities increased as a percentage of total liabilities and stockholders' equity over the prior year.
B) In 2014, total current liabilities was equal to 3.6% of total liabilities.
C) In 2014, total current liabilities was equal to 3.6% of total liabilities and stockholders' equity.
D) In 2014, total current liabilities decreased as a percentage of net sales revenue.
Unlock Deck
Unlock for access to all 161 flashcards in this deck.
Unlock Deck
k this deck
32
Please refer to the vertical analysis of a section of a balance sheet, shown below:
-Which of the following statements is valid regarding the data shown above?
A) Cash grew 3.7% over the previous year balance.
B) In 2014, Inventory represented 13.9% of net sales revenues.
C) Other long-term assets dropped 5.5% over the 2-year period.
D) Property, plant and equipment grew as a percentage of total assets over the 2-year period.
Unlock Deck
Unlock for access to all 161 flashcards in this deck.
Unlock Deck
k this deck
33
Please refer to the vertical analysis of a section of a balance sheet, shown below:
- Which of the following statements accurately describes the data shown for total current assets?
A) Current assets grew as a percentage of total assets over the 2-year period.
B) Current assets are equal to 23.2% of net sales in 2014.
C) In 2014, current assets grew by 23.2% compared to 2013.
D) In 2014, current assets as a percentage of total assets declined over the previous year.
Unlock Deck
Unlock for access to all 161 flashcards in this deck.
Unlock Deck
k this deck
34
Portofino Company provides the following comparative balance sheet data. Please complete a horizontal analysis using the format shown here:
Unlock Deck
Unlock for access to all 161 flashcards in this deck.
Unlock Deck
k this deck
35
Which of the following is the base amount when performing vertical analysis of a balance sheet?
A) Total assets
B) Total cash and cash equivalents
C) Net income
D) Gross profit
A) Total assets
B) Total cash and cash equivalents
C) Net income
D) Gross profit
Unlock Deck
Unlock for access to all 161 flashcards in this deck.
Unlock Deck
k this deck
36
Vertical analysis is used with the income statement, but not with the balance sheet.
Unlock Deck
Unlock for access to all 161 flashcards in this deck.
Unlock Deck
k this deck
37
In a vertical analysis of the income statement, each line item is shown as a percentage of gross profit.
Unlock Deck
Unlock for access to all 161 flashcards in this deck.
Unlock Deck
k this deck
38
If an analyst wishes to see a company's current assets as a percentage of total assets, a vertical analysis would be the best approach.
Unlock Deck
Unlock for access to all 161 flashcards in this deck.
Unlock Deck
k this deck
39
Portofino Company provides the following comparative income statement data. Please complete a horizontal analysis using the format shown here:
Unlock Deck
Unlock for access to all 161 flashcards in this deck.
Unlock Deck
k this deck
40
La Paz Company reported the following data:
Which of the following statements is an accurate conclusion about the 2014 results, based on the above data?
A) Revenues fell and expenses rose over the 2-year period, resulting in a drop in net income.
B) Net income improved, despite a rise in operating expenses.
C) Gross profit declined over two years, resulting in a drop in net income.
D) The increase in net income resulted primarily from an increase in gross profit coupled with a decrease in operating expenses.
Unlock Deck
Unlock for access to all 161 flashcards in this deck.
Unlock Deck
k this deck
41
Please complete the vertical analysis on the income statement data in the format below:
Unlock Deck
Unlock for access to all 161 flashcards in this deck.
Unlock Deck
k this deck
42
Oglethorpe Company reports the following information from the vertical analysis of their income statement:
Net income:
4.2 % in 2014
3.9% in 2013
Which of the following statements could be logically concluded from the above data?
A) The company made a higher gross profit in 2014 than in 2013.
B) The company made higher net income in 2014 than in 2013.
C) The company has improved the profit they make per dollar of sales in 2014.
D) The company's total net income increased by 0.3% in 2014.
Unlock Deck
Unlock for access to all 161 flashcards in this deck.
Unlock Deck
k this deck
43
Olivera Company provides the following data for the year 2013:
- On a vertical analysis, what percentage would be shown for income tax expense?
A) 2.3%
B) 6.3%
C) 2.9%
D) 3.4%
- On a vertical analysis, what percentage would be shown for income tax expense?
A) 2.3%
B) 6.3%
C) 2.9%
D) 3.4%
Unlock Deck
Unlock for access to all 161 flashcards in this deck.
Unlock Deck
k this deck
44
Olivera Company provides the following data for the year 2013:
-
On a vertical analysis, what percentage would be shown for operating income?
A) 12.9%
B) 33.6%
C) 12.1%
D) 31.4%
-
On a vertical analysis, what percentage would be shown for operating income?
A) 12.9%
B) 33.6%
C) 12.1%
D) 31.4%
Unlock Deck
Unlock for access to all 161 flashcards in this deck.
Unlock Deck
k this deck
45
Benchmarking is often done by comparing a company against either a key competitor or against the industry average.
Unlock Deck
Unlock for access to all 161 flashcards in this deck.
Unlock Deck
k this deck
46
Olivera Company provides the following data for the year 2013:
On a vertical analysis, what percentage would be shown for cost of goods sold?
A) 59.4%
B) 61.0%
C) 63.4%
D) 64.1%
On a vertical analysis, what percentage would be shown for cost of goods sold?
A) 59.4%
B) 61.0%
C) 63.4%
D) 64.1%
Unlock Deck
Unlock for access to all 161 flashcards in this deck.
Unlock Deck
k this deck
47
Please refer to the following data:
Which of the following statements is a valid conclusion based on this data?
A) Profitability in 2014 took a dive as operating expenses increased by 30.8%.
B) Profitability in 2014 improved greatly, as net income increased significantly as a percentage of sales.
C) Net income in 2014 increased 12.6% over the prior year.
D) Net income in 2014 went down because gross profit as a percentage of sales declined over the 2-year period.
Unlock Deck
Unlock for access to all 161 flashcards in this deck.
Unlock Deck
k this deck
48
Common-size statements allow the comparison of two or more companies with different amounts of net sales and assets.
Unlock Deck
Unlock for access to all 161 flashcards in this deck.
Unlock Deck
k this deck
49
Olivera Company provides the following data for the year 2013:
- On a vertical analysis, what percentage would be shown for net income?
A) 12.1%
B) 8.8%
C) 9.8%
D) 27.3%
- On a vertical analysis, what percentage would be shown for net income?
A) 12.1%
B) 8.8%
C) 9.8%
D) 27.3%
Unlock Deck
Unlock for access to all 161 flashcards in this deck.
Unlock Deck
k this deck
50
Please refer to the partial balance sheet data provided below:
-Which of the following would be a valid conclusion from the above data?
A) Stockholders' equity was equal to 76.6% of total liabilities in 2014.
B) Stockholders' equity declined to 76.6% of net sales in 2014.
C) Stockholders' equity was up 76.6% over a 2-year period.
D) Stockholders' equity, as a percentage of total liabilities and stockholders' equity, declined over a 2-year period.
Unlock Deck
Unlock for access to all 161 flashcards in this deck.
Unlock Deck
k this deck
51
A common-size statement reports only percentages-no dollar amounts.
Unlock Deck
Unlock for access to all 161 flashcards in this deck.
Unlock Deck
k this deck
52
The common-size statement percentages are the same percentages that appear in horizontal analysis.
Unlock Deck
Unlock for access to all 161 flashcards in this deck.
Unlock Deck
k this deck
53
The Arlington Company prepared a common-size income statement to compare its results with its key competitor, Bardo Company. Please refer to the following data:
-
Based on this data, an analyst could conclude that Arlington's total gross profit is higher than Bardo's.
-
Based on this data, an analyst could conclude that Arlington's total gross profit is higher than Bardo's.
Unlock Deck
Unlock for access to all 161 flashcards in this deck.
Unlock Deck
k this deck
54
Oglethorpe Company reports the following information from the vertical analysis of their balance sheet:
Current assets:
23.5 % in 2014
23.9% in 2013
Which of the following statements could be logically concluded from the above data?
A) The company's current ratio declined.
B) The company's current assets declined in proportion to its total assets.
C) The company's ability to pay current liabilities declined.
D) The company's total current assets declined by 0.4%.
Unlock Deck
Unlock for access to all 161 flashcards in this deck.
Unlock Deck
k this deck
55
Please complete the vertical analysis on the balance sheet data in the format below:
Unlock Deck
Unlock for access to all 161 flashcards in this deck.
Unlock Deck
k this deck
56
Please complete a vertical analysis on the balance sheet data shown in the format below:
Unlock Deck
Unlock for access to all 161 flashcards in this deck.
Unlock Deck
k this deck
57
Olivera Company provides the following data for the year 2013:
-
On a vertical analysis, what percentage would be shown for operating expenses?
A) 22.9%
B) 66.4%
C) 23.9%
D) 24.5%
-
On a vertical analysis, what percentage would be shown for operating expenses?
A) 22.9%
B) 66.4%
C) 23.9%
D) 24.5%
Unlock Deck
Unlock for access to all 161 flashcards in this deck.
Unlock Deck
k this deck
58
Olivera Company provides the following data for the year 2013:
On a vertical analysis, what percentage would be shown for gross profit?
A) 35.9%
B) 35.6%
C) 56.1%
D) 44.1%
On a vertical analysis, what percentage would be shown for gross profit?
A) 35.9%
B) 35.6%
C) 56.1%
D) 44.1%
Unlock Deck
Unlock for access to all 161 flashcards in this deck.
Unlock Deck
k this deck
59
Please complete the vertical analysis of the income statement data shown on the form below:
Unlock Deck
Unlock for access to all 161 flashcards in this deck.
Unlock Deck
k this deck
60
Please refer to the following data: Which of the following is a valid conclusion from the above data?
A) The company shifted toward greater debt financing and less equity financing over the 2-year period.
B) The company relied heavily on retained earnings to finance asset growth in 2014.
C) Current asset and current liability data suggest a liquidity problem in 2014.
D) The balance in Retained earnings declined over a 2-year period.
Which of the following is a valid conclusion from the above data?A) The company shifted toward greater debt financing and less equity financing over the 2-year period.
B) The company relied heavily on retained earnings to finance asset growth in 2014.
C) Current asset and current liability data suggest a liquidity problem in 2014.
D) The balance in Retained earnings declined over a 2-year period.
Unlock Deck
Unlock for access to all 161 flashcards in this deck.
Unlock Deck
k this deck
61
Days' sales in receivables is a measure of a company's ability to collect receivables.
Unlock Deck
Unlock for access to all 161 flashcards in this deck.
Unlock Deck
k this deck
62
The Arlington Company prepared a common-size income statement to compare its results with its key competitor, Bardo Company. Please refer to the following data:
-
Which of the following statements can be correctly concluded from the above data?
A) Bardo Company produced higher total net income than Arlington.
B) Bardo produces higher gross profit per dollar of sales than Arlington.
C) Bardo places a higher priority on research and development than Arlington.
D) Bardo's total operating expenses are lower than Arlington's.
Unlock Deck
Unlock for access to all 161 flashcards in this deck.
Unlock Deck
k this deck
63
The Arlington Company prepared a common-size income statement to compare its results with its key competitor, Bardo Company. Please refer to the following data:
-
Based on the above data, an analyst could conclude that Arlington's total net income is higher than the industry average.
-
Based on the above data, an analyst could conclude that Arlington's total net income is higher than the industry average.
Unlock Deck
Unlock for access to all 161 flashcards in this deck.
Unlock Deck
k this deck
64
The Arlington Company prepared a common-size income statement to compare its results with its key competitor, Bardo Company. Please refer to the following data:
-
Based on this data, an analyst could conclude that Arlington's performance is not as good as Bardo's because it has much higher sales and marketing expenses.
-
Based on this data, an analyst could conclude that Arlington's performance is not as good as Bardo's because it has much higher sales and marketing expenses.
Unlock Deck
Unlock for access to all 161 flashcards in this deck.
Unlock Deck
k this deck
65
If you are comparing your company's results with those of other companies in the industry, the process is called:
A) a horizontal analysis.
B) a trend analysis.
C) benchmarking.
D) sensitivity analysis.
A) a horizontal analysis.
B) a trend analysis.
C) benchmarking.
D) sensitivity analysis.
Unlock Deck
Unlock for access to all 161 flashcards in this deck.
Unlock Deck
k this deck
66
Arlington Company wishes to compare itself to a key competitor, but that company is much larger in size than Arlington. Please refer to the following income statement information:
Please prepare a common-size income statement for the two companies using the following format.
(Round all amounts to the nearest tenth of a percent.)
Please prepare a common-size income statement for the two companies using the following format.
(Round all amounts to the nearest tenth of a percent.)
Unlock Deck
Unlock for access to all 161 flashcards in this deck.
Unlock Deck
k this deck
67
Arlington Company has prepared the following common-size income statement to compare its performance with industry averages:
-
Based on the above data, an analyst could conclude that Arlington achieves better results than the industry average by controlling its operating expenses more effectively.
-
Based on the above data, an analyst could conclude that Arlington achieves better results than the industry average by controlling its operating expenses more effectively.
Unlock Deck
Unlock for access to all 161 flashcards in this deck.
Unlock Deck
k this deck
68
Which of the following is the definition of benchmarking?
A) Benchmarking is the study of percentage changes in financial statement line items year to year.
B) Benchmarking is the analysis of a financial statement that shows each item as a percentage of net sales or total assets.
C) Benchmarking is the practice of comparing a company with other companies in that industry.
D) Benchmarking is the comparison of two companies using horizontal analysis.
Unlock Deck
Unlock for access to all 161 flashcards in this deck.
Unlock Deck
k this deck
69
If an analyst wishes to compare several different companies that vary in size, which of the following types of financial statement analysis would be used?
A) Vertical analysis
B) Horizontal analysis
C) Ratio analysis
D) Common-size financial statement analysis
A) Vertical analysis
B) Horizontal analysis
C) Ratio analysis
D) Common-size financial statement analysis
Unlock Deck
Unlock for access to all 161 flashcards in this deck.
Unlock Deck
k this deck
70
The current ratio is widely used to measure a company's ability to pay current liabilities.
Unlock Deck
Unlock for access to all 161 flashcards in this deck.
Unlock Deck
k this deck
71
The Arlington Company prepared a common-size income statement to compare its results with its key competitor, Bardo Company. Please refer to the following data:
-
Which of the following statements can be correctly concluded from the above data?
A) Arlington's cost of goods sold is lower than Bardo's on a per unit basis.
B) Arlington produces a higher amount of gross profit than Bardo.
C) Arlington makes less total net income than Bardo.
D) Bardo has more effective cost control than Arlington in the area of operating expenses.
Unlock Deck
Unlock for access to all 161 flashcards in this deck.
Unlock Deck
k this deck
72
The inventory turnover ratio indicates how rapidly inventory is sold.
Unlock Deck
Unlock for access to all 161 flashcards in this deck.
Unlock Deck
k this deck
73
Rate of return on net sales is a measure of a company's profitability.
Unlock Deck
Unlock for access to all 161 flashcards in this deck.
Unlock Deck
k this deck
74
Arlington Company has prepared the following common-size income statement to compare its performance with industry averages:
Which of the following statements can be correctly concluded from the above data?
A) Arlington's gross profit per dollar of sales is higher than the industry average.
B) Arlington's net income is higher than the industry average.
C) Arlington achieves better results than the industry by earning higher revenues.
D) Arlington achieves better profitability than the industry, primarily by controlling operating expenses more effectively.
Unlock Deck
Unlock for access to all 161 flashcards in this deck.
Unlock Deck
k this deck
75
The Arlington Company wishes to compare its performance with industry averages. Please refer to the data below:
Please prepare common-sized income statement using the format below. (Round all amounts to the nearest tenth of a percent.)
Please prepare common-sized income statement using the format below. (Round all amounts to the nearest tenth of a percent.)
Unlock Deck
Unlock for access to all 161 flashcards in this deck.
Unlock Deck
k this deck
76
Arlington Company has prepared the following common-size income statement to compare its performance with industry averages:
-
This is an example of benchmarking.
-
This is an example of benchmarking.
Unlock Deck
Unlock for access to all 161 flashcards in this deck.
Unlock Deck
k this deck
77
Which of the following is NOT true of benchmarking?
A) It is used to compare companies of different sizes.
B) It uses vertical analysis as its primary methodology.
C) It is used to compare a company against its competitors.
D) It is used to compare a company's results against industry averages.
A) It is used to compare companies of different sizes.
B) It uses vertical analysis as its primary methodology.
C) It is used to compare a company against its competitors.
D) It is used to compare a company's results against industry averages.
Unlock Deck
Unlock for access to all 161 flashcards in this deck.
Unlock Deck
k this deck
78
Benchmarking means comparing a company's financial results to:
A) industry standards or competitors.
B) its own results in prior years.
C) its budget for the coming year.
D) the expectations of the capital markets.
A) industry standards or competitors.
B) its own results in prior years.
C) its budget for the coming year.
D) the expectations of the capital markets.
Unlock Deck
Unlock for access to all 161 flashcards in this deck.
Unlock Deck
k this deck
79
Which of the following balance sheet displays shows only percentages?
A) Horizontal analysis balance sheet
B) A common-size balance sheet
C) A vertical analysis balance sheet
D) A balance sheet as shown in the annual report of a company
A) Horizontal analysis balance sheet
B) A common-size balance sheet
C) A vertical analysis balance sheet
D) A balance sheet as shown in the annual report of a company
Unlock Deck
Unlock for access to all 161 flashcards in this deck.
Unlock Deck
k this deck
80
The inventory turnover ratio is a measure of the company's ability to pay all of its current liabilities if they come due immediately.
Unlock Deck
Unlock for access to all 161 flashcards in this deck.
Unlock Deck
k this deck
Unlock Deck
Unlock for access to all 161 flashcards in this deck.


