Deck 17: Financial Statement Analysis
Full screen (f)
Question
Question
Question
Question
The following is summary of information presented on the financial statements of a company on December 31, 2015. 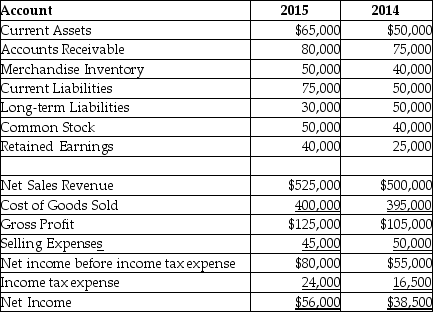 What would a horizontal analysis report show with respect to current liabilities?
A)current liabilities are 38.46% of total capital
B)a 50.00% increase in current liabilities
C)a current ratio of .87
D)a 33.33% increase in current liabilities
What would a horizontal analysis report show with respect to current liabilities?A)current liabilities are 38.46% of total capital
B)a 50.00% increase in current liabilities
C)a current ratio of .87
D)a 33.33% increase in current liabilities
Question
Question
Question
Question
Question
Question
Question
Question
Question
Question
Question
Question
Question
The following is summary of information presented on the financial statements of a company on December 31, 2015. 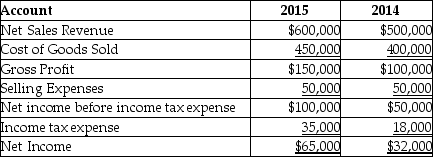 What would a horizontal analysis report show with respect to net income?
A)both net income before income tax expense and net income are 45.45% of net sales revenue
B)a $25,000 increase in net income
C)a 45.45% increase in net income
D)a 103% increase in net income
What would a horizontal analysis report show with respect to net income?A)both net income before income tax expense and net income are 45.45% of net sales revenue
B)a $25,000 increase in net income
C)a 45.45% increase in net income
D)a 103% increase in net income
Question
Question
Question
Question
Atlantis Inc. reported the following data: 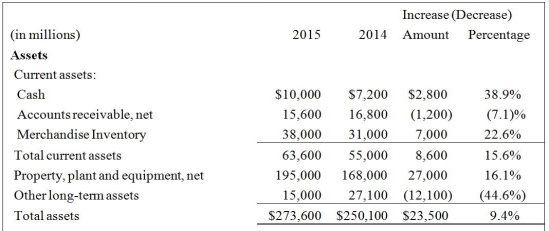
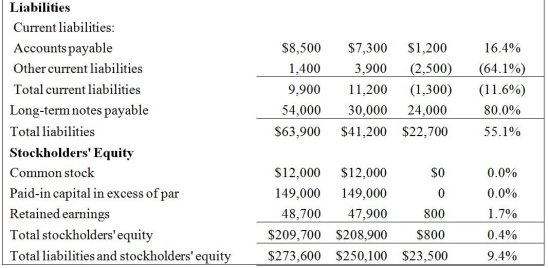 The horizontal report shows that the amount of total liabilities has:
A)increased by $22,700.
B)increased by $2,500.
C)decreased by $2,500.
D)increased by $24,000.
The horizontal report shows that the amount of total liabilities has:A)increased by $22,700.
B)increased by $2,500.
C)decreased by $2,500.
D)increased by $24,000.
Question
Question
Data for Atlantis Inc. is given below: 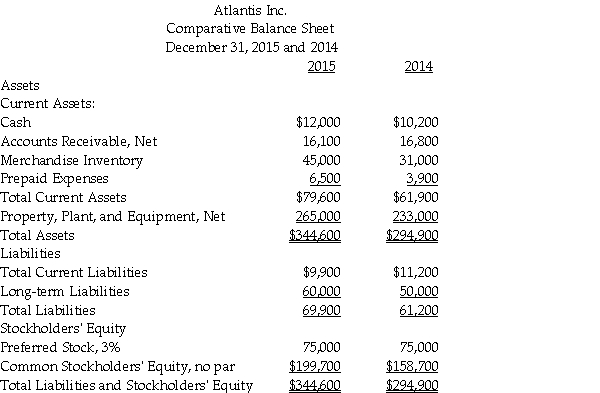 Prepare a horizontal analysis of the comparative balance sheet of Atlantis Inc. Round percentage changes to one decimal place.
Prepare a horizontal analysis of the comparative balance sheet of Atlantis Inc. Round percentage changes to one decimal place. Question
The following is summary of information presented on the financial statements of a company on December 31, 2015. 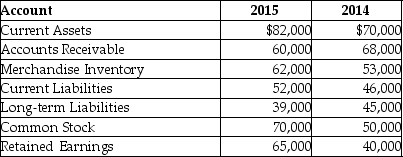 What would a horizontal analysis report show with respect to long-term liabilities?
A)long-term liabilities decreased by $30,000
B)long-term liabilities decreased by 40%
C)long-term liabilities decreased by 13.33%
D)long-term liabilities decreased by $10,000
What would a horizontal analysis report show with respect to long-term liabilities?A)long-term liabilities decreased by $30,000
B)long-term liabilities decreased by 40%
C)long-term liabilities decreased by 13.33%
D)long-term liabilities decreased by $10,000
Question
The trend analysis report of Doppler Inc. is given below:  Which of the following is a correct conclusion from the above analysis?
A)Net income for the year 2015 has increased by 115% over that for the year 2013.
B)Net income for the year 2015 has decreased by 15% over that for the year 2013.
C)Net income for the year 2015 has decreased by 115% over that for the year 2013
D)Net income for the year 2015 has increased by 15% over that for the year 2013.
Which of the following is a correct conclusion from the above analysis?A)Net income for the year 2015 has increased by 115% over that for the year 2013.
B)Net income for the year 2015 has decreased by 15% over that for the year 2013.
C)Net income for the year 2015 has decreased by 115% over that for the year 2013
D)Net income for the year 2015 has increased by 15% over that for the year 2013.
Question
Data for Nobell Inc. follow:  Prepare a horizontal analysis of the comparative income statement of Nobell Inc. Round percentage changes to one decimal place. Please use a multiple step income statement.
Prepare a horizontal analysis of the comparative income statement of Nobell Inc. Round percentage changes to one decimal place. Please use a multiple step income statement. Question
Question
Question
The following is summary of information presented on the financial statements of a company on December 31, 2015. 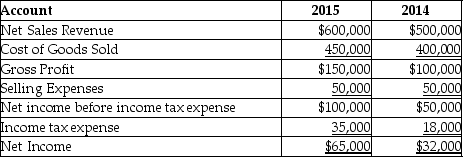 What would a horizontal analysis report show with respect to net sales revenue?
A)a 20% increase in net sales revenue
B)a 120% decrease in net sales revenue
C)a decrease of $ 50,000 in net sales revenue
D)an increase of $50,000 in net sales revenue
What would a horizontal analysis report show with respect to net sales revenue?A)a 20% increase in net sales revenue
B)a 120% decrease in net sales revenue
C)a decrease of $ 50,000 in net sales revenue
D)an increase of $50,000 in net sales revenue
Question
Data for Nobell Inc. is as follows: 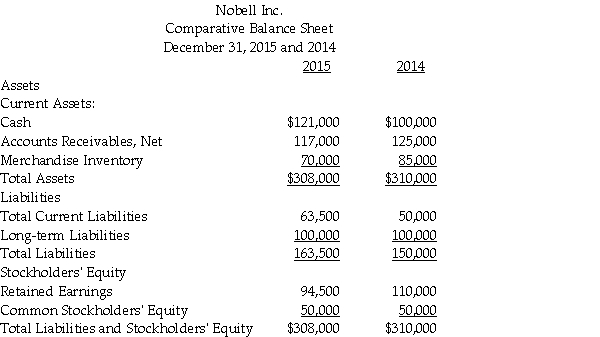 Prepare a horizontal analysis of the comparative balance sheet of Nobell Inc. Round percentage changes to one decimal place.
Prepare a horizontal analysis of the comparative balance sheet of Nobell Inc. Round percentage changes to one decimal place. Question
Atlantis Inc. provides the following historical data:  Prepare the trend analysis report Use 2011 as the base year, and round answers to the nearest percent.
Prepare the trend analysis report Use 2011 as the base year, and round answers to the nearest percent. Question
The trend analysis report of Doppler Inc. is given below: 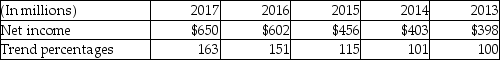 Which of the following is a correct conclusion from the above analysis?
A)Net income for the year 2016 is 151% of that for the year 2013.
B)Net income for the year 2016 is 151% of previous year.
C)Net income for the year 2016 decreased by 151% from 2015.
D)Net income for the year 2017 increased by 163% from 2016.
Which of the following is a correct conclusion from the above analysis?A)Net income for the year 2016 is 151% of that for the year 2013.
B)Net income for the year 2016 is 151% of previous year.
C)Net income for the year 2016 decreased by 151% from 2015.
D)Net income for the year 2017 increased by 163% from 2016.
Question
Question
Question
Question
Question
Donald Corp. reported the following on its comparative income statement:  Prepare a horizontal analysis of revenues and cost of goods sold, both in dollar amounts and in percentages, for 2016 and 2017. Round your percentage answers to two decimal places.
Prepare a horizontal analysis of revenues and cost of goods sold, both in dollar amounts and in percentages, for 2016 and 2017. Round your percentage answers to two decimal places. Question
Atlantis Inc. reported the following data: 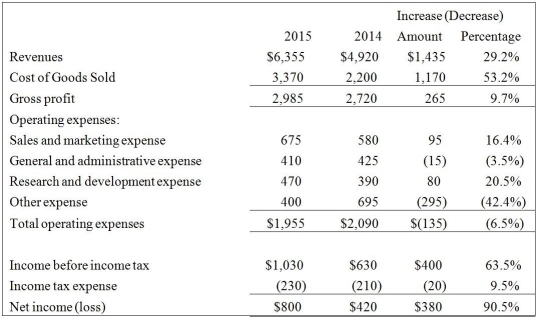 The horizontal analysis report shows that the cost of goods sold has:
A)increased by 29.2%.
B)decreased by 29.2%.
C)increased by 53.2%.
D)decreased by 53.2%
The horizontal analysis report shows that the cost of goods sold has:A)increased by 29.2%.
B)decreased by 29.2%.
C)increased by 53.2%.
D)decreased by 53.2%
Question
Data for Atlantis Inc. follow: 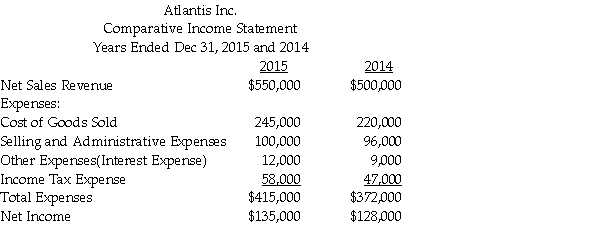 Prepare a horizontal analysis of the comparative income statement of Atlantis Inc. Round percentage changes to one decimal place. Use a multiple step format for the income statement.
Prepare a horizontal analysis of the comparative income statement of Atlantis Inc. Round percentage changes to one decimal place. Use a multiple step format for the income statement. Question
Donald Corp. reported the following revenues and net income amounts.  Calculate Donald's trend analysis for revenues and cost of goods sold. Use 2013 as the base year, and round to the nearest percent.
Calculate Donald's trend analysis for revenues and cost of goods sold. Use 2013 as the base year, and round to the nearest percent. Question
Question
Prepare the vertical analysis report of the balance sheet data given below: Round off the percentages to two decimal places 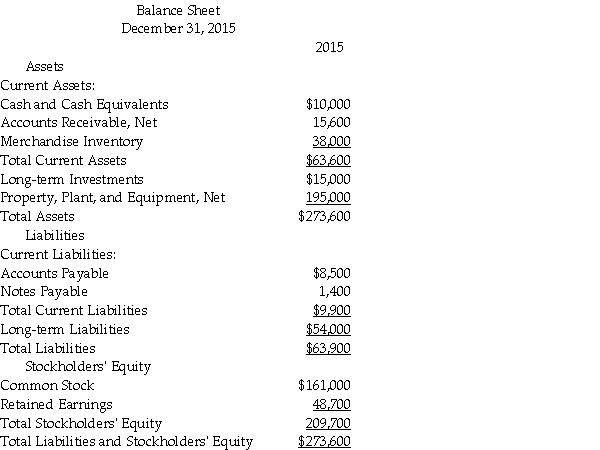
Question
Prepare a vertical analysis report of the income statement shown below. Round off the percentages to two decimal places. 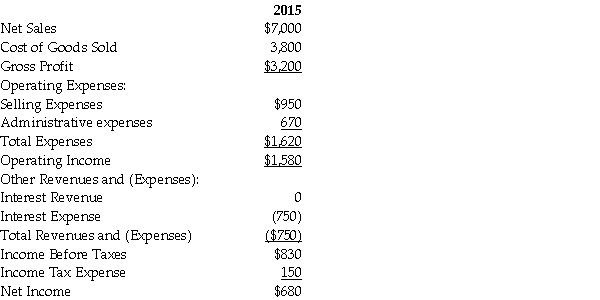
Question
The vertical analysis statement of Nobell Inc. is as below:  The figure 16.5% shown for net income in 2015 signifies that:
A)net income is 16.5% of net sales revenues.
B)net income is increased by 16.5% over the previous year.
C)net income is 16.5% of gross profit.
D)net income is equal to 16.5 times of the income before income tax.
The figure 16.5% shown for net income in 2015 signifies that:A)net income is 16.5% of net sales revenues.
B)net income is increased by 16.5% over the previous year.
C)net income is 16.5% of gross profit.
D)net income is equal to 16.5 times of the income before income tax.
Question
Question
Atlantis Inc. has the following data: 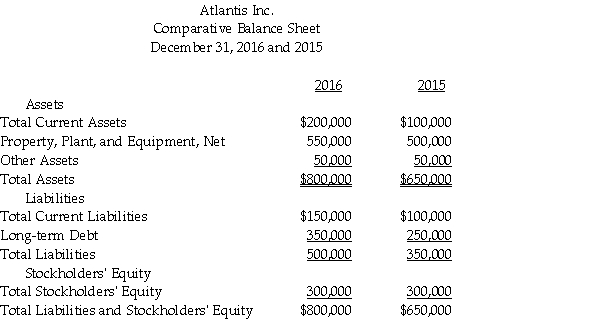 Perform a vertical analysis of Atlantis's balance sheet for each year. Round your percentage answers to one decimal place.
Perform a vertical analysis of Atlantis's balance sheet for each year. Round your percentage answers to one decimal place. Question
Question
Question
Question
The vertical analysis statement of Nobell Inc. is as below: 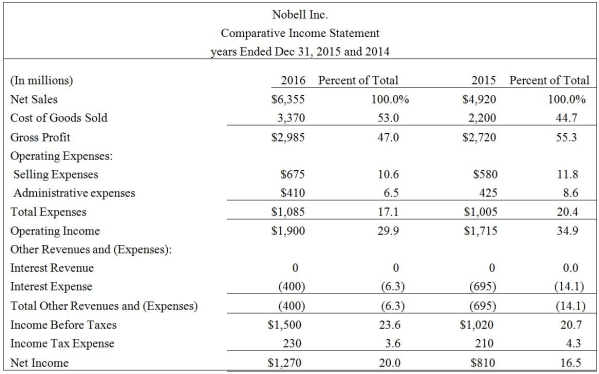 The figure 47.0% shown for gross profit in 2016 signifies that:
A)gross profit is equal to 47.0% of net income.
B)gross profit is increased by 47.0% over the previous year.
C)gross profit is 47.0% of net sales revenue.
D)gross profit is 47.0% of cost of goods sold.
The figure 47.0% shown for gross profit in 2016 signifies that:A)gross profit is equal to 47.0% of net income.
B)gross profit is increased by 47.0% over the previous year.
C)gross profit is 47.0% of net sales revenue.
D)gross profit is 47.0% of cost of goods sold.
Question
Prepare a comparative common-size income statement for Nobell Inc. using the 2015 and 2014 data. Round off the percentages to one decimal place. 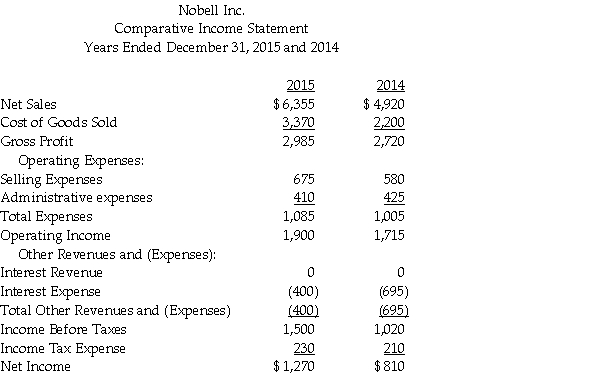
Question
Question
Olivera Inc. provides the following data for the year 2015: 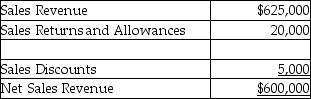 On vertical analysis report, gross profit as a percentage of net sales will be:
A)35.9%
B)41.67%
C)56.1%
D)44.1%
On vertical analysis report, gross profit as a percentage of net sales will be:A)35.9%
B)41.67%
C)56.1%
D)44.1%
Question
Question
Data for Martin Corp and Tortoize Inc. as follows: 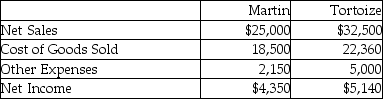 Prepare a comparative common-size income statement for Martin Corp and Tortoize Inc. for the year ending December 31, 2016. Round off the percentages to two decimal places. Use a multiple step format for the income statement.
Prepare a comparative common-size income statement for Martin Corp and Tortoize Inc. for the year ending December 31, 2016. Round off the percentages to two decimal places. Use a multiple step format for the income statement. Question
Question
Question
Question
Shelcal Inc. provides the following data for the year 2015: 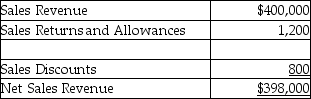 On vertical analysis report, cost of goods sold as a percentage of net sales will amount to:
A)59.42%
B)61.15%
C)63.48%
D)64.07%
On vertical analysis report, cost of goods sold as a percentage of net sales will amount to:A)59.42%
B)61.15%
C)63.48%
D)64.07%
Question
Question
Question
Question
Question
Question
Question
Question
Question
Question
Question
Question
Question
Question
Question
Question
Question
Question
Question
Question
Question

Unlock Deck
Sign up to unlock the cards in this deck!
Unlock Deck
Unlock Deck
1/112
Play
Full screen (f)
Deck 17: Financial Statement Analysis
1
Which of the following best describes horizontal analysis?
A)comparing figures from year to year for the same company
B)expressing each figure as a percentage of a budgeted figure
C)comparing a company's financial statements with other companies
D)calculating key ratios to evaluate performance
A)comparing figures from year to year for the same company
B)expressing each figure as a percentage of a budgeted figure
C)comparing a company's financial statements with other companies
D)calculating key ratios to evaluate performance
A
2
A summary of significant accounting policies and explanations of specific items on the financial statements will be given in:
A)the balance sheet.
B)the income statement.
C)notes to financial statements.
D)the report of independent registered public accounting firm.
A)the balance sheet.
B)the income statement.
C)notes to financial statements.
D)the report of independent registered public accounting firm.
C
3
An unqualified opinion in an audit report states that the financial statements are presented fairly, in all material respects.
True
4
The following is summary of information presented on the financial statements of a company on December 31, 2015. What would a horizontal analysis report show with respect to current liabilities?
A)current liabilities are 38.46% of total capital
B)a 50.00% increase in current liabilities
C)a current ratio of .87
D)a 33.33% increase in current liabilities
What would a horizontal analysis report show with respect to current liabilities?A)current liabilities are 38.46% of total capital
B)a 50.00% increase in current liabilities
C)a current ratio of .87
D)a 33.33% increase in current liabilities
Unlock Deck
Unlock for access to all 112 flashcards in this deck.
Unlock Deck
k this deck
5
If an analyst wants to see how assets of a company have changed from one year to the next, horizontal analysis must be used.
Unlock Deck
Unlock for access to all 112 flashcards in this deck.
Unlock Deck
k this deck
6
An external auditor is responsible for assessing the effectiveness of a company's internal controls.
Unlock Deck
Unlock for access to all 112 flashcards in this deck.
Unlock Deck
k this deck
7
Which of the following types of financial statement analysis would be used to see how sales revenue of a company has changed from one year to the next?
A)vertical analysis of balance sheet
B)horizontal analysis of income statement
C)horizontal analysis of balance sheet
D)vertical analysis of income statement
A)vertical analysis of balance sheet
B)horizontal analysis of income statement
C)horizontal analysis of balance sheet
D)vertical analysis of income statement
Unlock Deck
Unlock for access to all 112 flashcards in this deck.
Unlock Deck
k this deck
8
The audit report attests to the fairness of the presentation of the financial statements.
Unlock Deck
Unlock for access to all 112 flashcards in this deck.
Unlock Deck
k this deck
9
Management's discussion and analysis section of the annual report is the company's attempt to explain its financial statements and to discuss its performance.
Unlock Deck
Unlock for access to all 112 flashcards in this deck.
Unlock Deck
k this deck
10
Trend analysis is a form of horizontal analysis.
Unlock Deck
Unlock for access to all 112 flashcards in this deck.
Unlock Deck
k this deck
11
An adverse opinion is issued if the auditor finds that the financial statements are not presented fairly.
Unlock Deck
Unlock for access to all 112 flashcards in this deck.
Unlock Deck
k this deck
12
An annual report provides information about a company's financial condition.
Unlock Deck
Unlock for access to all 112 flashcards in this deck.
Unlock Deck
k this deck
13
The audit report is prepared by an internal auditor of a company.
Unlock Deck
Unlock for access to all 112 flashcards in this deck.
Unlock Deck
k this deck
14
The study of percentage changes in comparative financial statements is called horizontal analysis.
Unlock Deck
Unlock for access to all 112 flashcards in this deck.
Unlock Deck
k this deck
15
Horizontal analysis compares each item in the income statement to the net sales amount.
Unlock Deck
Unlock for access to all 112 flashcards in this deck.
Unlock Deck
k this deck
16
Which of the following best describes trend analysis?
A)calculating key ratios to evaluate performance
B)expressing each figure as a percentage of a budgeted figure
C)comparing a company's financial statements with that of other companies
D)expressing each year's figures as a percentage of the base year figures
A)calculating key ratios to evaluate performance
B)expressing each figure as a percentage of a budgeted figure
C)comparing a company's financial statements with that of other companies
D)expressing each year's figures as a percentage of the base year figures
Unlock Deck
Unlock for access to all 112 flashcards in this deck.
Unlock Deck
k this deck
17
The following is summary of information presented on the financial statements of a company on December 31, 2015. What would a horizontal analysis report show with respect to net income?
A)both net income before income tax expense and net income are 45.45% of net sales revenue
B)a $25,000 increase in net income
C)a 45.45% increase in net income
D)a 103% increase in net income
What would a horizontal analysis report show with respect to net income?A)both net income before income tax expense and net income are 45.45% of net sales revenue
B)a $25,000 increase in net income
C)a 45.45% increase in net income
D)a 103% increase in net income
Unlock Deck
Unlock for access to all 112 flashcards in this deck.
Unlock Deck
k this deck
18
If an analyst wants to see how gross profit of a company has changed from one year to the next, vertical analysis would be used.
Unlock Deck
Unlock for access to all 112 flashcards in this deck.
Unlock Deck
k this deck
19
The income statement is also known as the:
A)statement of operations.
B)statement of cash flows.
C)statement of stockholders' equity.
D)statement of financial position.
A)statement of operations.
B)statement of cash flows.
C)statement of stockholders' equity.
D)statement of financial position.
Unlock Deck
Unlock for access to all 112 flashcards in this deck.
Unlock Deck
k this deck
20
A quarterly report filed with the Securities and Exchange Commission is called a Form 10-K.
Unlock Deck
Unlock for access to all 112 flashcards in this deck.
Unlock Deck
k this deck
21
Atlantis Inc. reported the following data: The horizontal report shows that the amount of total liabilities has:
A)increased by $22,700.
B)increased by $2,500.
C)decreased by $2,500.
D)increased by $24,000.
The horizontal report shows that the amount of total liabilities has:A)increased by $22,700.
B)increased by $2,500.
C)decreased by $2,500.
D)increased by $24,000.
Unlock Deck
Unlock for access to all 112 flashcards in this deck.
Unlock Deck
k this deck
22
Vertical analysis involves comparing each figure in the financial statements with a corresponding figure of the previous year.
Unlock Deck
Unlock for access to all 112 flashcards in this deck.
Unlock Deck
k this deck
23
Data for Atlantis Inc. is given below: Prepare a horizontal analysis of the comparative balance sheet of Atlantis Inc. Round percentage changes to one decimal place.
Prepare a horizontal analysis of the comparative balance sheet of Atlantis Inc. Round percentage changes to one decimal place. Unlock Deck
Unlock for access to all 112 flashcards in this deck.
Unlock Deck
k this deck
24
The following is summary of information presented on the financial statements of a company on December 31, 2015. What would a horizontal analysis report show with respect to long-term liabilities?
A)long-term liabilities decreased by $30,000
B)long-term liabilities decreased by 40%
C)long-term liabilities decreased by 13.33%
D)long-term liabilities decreased by $10,000
What would a horizontal analysis report show with respect to long-term liabilities?A)long-term liabilities decreased by $30,000
B)long-term liabilities decreased by 40%
C)long-term liabilities decreased by 13.33%
D)long-term liabilities decreased by $10,000
Unlock Deck
Unlock for access to all 112 flashcards in this deck.
Unlock Deck
k this deck
25
The trend analysis report of Doppler Inc. is given below: Which of the following is a correct conclusion from the above analysis?
A)Net income for the year 2015 has increased by 115% over that for the year 2013.
B)Net income for the year 2015 has decreased by 15% over that for the year 2013.
C)Net income for the year 2015 has decreased by 115% over that for the year 2013
D)Net income for the year 2015 has increased by 15% over that for the year 2013.
Which of the following is a correct conclusion from the above analysis?A)Net income for the year 2015 has increased by 115% over that for the year 2013.
B)Net income for the year 2015 has decreased by 15% over that for the year 2013.
C)Net income for the year 2015 has decreased by 115% over that for the year 2013
D)Net income for the year 2015 has increased by 15% over that for the year 2013.
Unlock Deck
Unlock for access to all 112 flashcards in this deck.
Unlock Deck
k this deck
26
Data for Nobell Inc. follow: Prepare a horizontal analysis of the comparative income statement of Nobell Inc. Round percentage changes to one decimal place. Please use a multiple step income statement.
Prepare a horizontal analysis of the comparative income statement of Nobell Inc. Round percentage changes to one decimal place. Please use a multiple step income statement. Unlock Deck
Unlock for access to all 112 flashcards in this deck.
Unlock Deck
k this deck
27
Benchmarking is often done by comparing a company against either a key competitor or against the industry average.
Unlock Deck
Unlock for access to all 112 flashcards in this deck.
Unlock Deck
k this deck
28
An analysis of a financial statement that reveals the relationship of each statement item to its base amount, which is the 100% figure, is known as vertical analysis.
Unlock Deck
Unlock for access to all 112 flashcards in this deck.
Unlock Deck
k this deck
29
The following is summary of information presented on the financial statements of a company on December 31, 2015. What would a horizontal analysis report show with respect to net sales revenue?
A)a 20% increase in net sales revenue
B)a 120% decrease in net sales revenue
C)a decrease of $ 50,000 in net sales revenue
D)an increase of $50,000 in net sales revenue
What would a horizontal analysis report show with respect to net sales revenue?A)a 20% increase in net sales revenue
B)a 120% decrease in net sales revenue
C)a decrease of $ 50,000 in net sales revenue
D)an increase of $50,000 in net sales revenue
Unlock Deck
Unlock for access to all 112 flashcards in this deck.
Unlock Deck
k this deck
30
Data for Nobell Inc. is as follows: Prepare a horizontal analysis of the comparative balance sheet of Nobell Inc. Round percentage changes to one decimal place.
Prepare a horizontal analysis of the comparative balance sheet of Nobell Inc. Round percentage changes to one decimal place. Unlock Deck
Unlock for access to all 112 flashcards in this deck.
Unlock Deck
k this deck
31
Atlantis Inc. provides the following historical data: Prepare the trend analysis report Use 2011 as the base year, and round answers to the nearest percent.
Prepare the trend analysis report Use 2011 as the base year, and round answers to the nearest percent. Unlock Deck
Unlock for access to all 112 flashcards in this deck.
Unlock Deck
k this deck
32
The trend analysis report of Doppler Inc. is given below: Which of the following is a correct conclusion from the above analysis?
A)Net income for the year 2016 is 151% of that for the year 2013.
B)Net income for the year 2016 is 151% of previous year.
C)Net income for the year 2016 decreased by 151% from 2015.
D)Net income for the year 2017 increased by 163% from 2016.
Which of the following is a correct conclusion from the above analysis?A)Net income for the year 2016 is 151% of that for the year 2013.
B)Net income for the year 2016 is 151% of previous year.
C)Net income for the year 2016 decreased by 151% from 2015.
D)Net income for the year 2017 increased by 163% from 2016.
Unlock Deck
Unlock for access to all 112 flashcards in this deck.
Unlock Deck
k this deck
33
Benchmarking is the comparison of a company's current year results with an earlier year's performance.
Unlock Deck
Unlock for access to all 112 flashcards in this deck.
Unlock Deck
k this deck
34
In a vertical analysis of the income statement, each line item is shown as a percentage of net sales.
Unlock Deck
Unlock for access to all 112 flashcards in this deck.
Unlock Deck
k this deck
35
In a vertical analysis of the balance sheet, each line item is shown as a percentage of shareholders' equity.
Unlock Deck
Unlock for access to all 112 flashcards in this deck.
Unlock Deck
k this deck
36
Benchmarking is the practice of comparing a company with other leading companies.
Unlock Deck
Unlock for access to all 112 flashcards in this deck.
Unlock Deck
k this deck
37
Donald Corp. reported the following on its comparative income statement: Prepare a horizontal analysis of revenues and cost of goods sold, both in dollar amounts and in percentages, for 2016 and 2017. Round your percentage answers to two decimal places.
Prepare a horizontal analysis of revenues and cost of goods sold, both in dollar amounts and in percentages, for 2016 and 2017. Round your percentage answers to two decimal places. Unlock Deck
Unlock for access to all 112 flashcards in this deck.
Unlock Deck
k this deck
38
Atlantis Inc. reported the following data: The horizontal analysis report shows that the cost of goods sold has:
A)increased by 29.2%.
B)decreased by 29.2%.
C)increased by 53.2%.
D)decreased by 53.2%
The horizontal analysis report shows that the cost of goods sold has:A)increased by 29.2%.
B)decreased by 29.2%.
C)increased by 53.2%.
D)decreased by 53.2%
Unlock Deck
Unlock for access to all 112 flashcards in this deck.
Unlock Deck
k this deck
39
Data for Atlantis Inc. follow: Prepare a horizontal analysis of the comparative income statement of Atlantis Inc. Round percentage changes to one decimal place. Use a multiple step format for the income statement.
Prepare a horizontal analysis of the comparative income statement of Atlantis Inc. Round percentage changes to one decimal place. Use a multiple step format for the income statement. Unlock Deck
Unlock for access to all 112 flashcards in this deck.
Unlock Deck
k this deck
40
Donald Corp. reported the following revenues and net income amounts. Calculate Donald's trend analysis for revenues and cost of goods sold. Use 2013 as the base year, and round to the nearest percent.
Calculate Donald's trend analysis for revenues and cost of goods sold. Use 2013 as the base year, and round to the nearest percent. Unlock Deck
Unlock for access to all 112 flashcards in this deck.
Unlock Deck
k this deck
41
A high current ratio indicates that current liabilities are more than current assets.
Unlock Deck
Unlock for access to all 112 flashcards in this deck.
Unlock Deck
k this deck
42
Prepare the vertical analysis report of the balance sheet data given below: Round off the percentages to two decimal places
Unlock Deck
Unlock for access to all 112 flashcards in this deck.
Unlock Deck
k this deck
43
Prepare a vertical analysis report of the income statement shown below. Round off the percentages to two decimal places.
Unlock Deck
Unlock for access to all 112 flashcards in this deck.
Unlock Deck
k this deck
44
The vertical analysis statement of Nobell Inc. is as below: The figure 16.5% shown for net income in 2015 signifies that:
A)net income is 16.5% of net sales revenues.
B)net income is increased by 16.5% over the previous year.
C)net income is 16.5% of gross profit.
D)net income is equal to 16.5 times of the income before income tax.
The figure 16.5% shown for net income in 2015 signifies that:A)net income is 16.5% of net sales revenues.
B)net income is increased by 16.5% over the previous year.
C)net income is 16.5% of gross profit.
D)net income is equal to 16.5 times of the income before income tax.
Unlock Deck
Unlock for access to all 112 flashcards in this deck.
Unlock Deck
k this deck
45
Working capital measures the ability to meet long-term obligations with current assets.
Unlock Deck
Unlock for access to all 112 flashcards in this deck.
Unlock Deck
k this deck
46
Atlantis Inc. has the following data: Perform a vertical analysis of Atlantis's balance sheet for each year. Round your percentage answers to one decimal place.
Perform a vertical analysis of Atlantis's balance sheet for each year. Round your percentage answers to one decimal place. Unlock Deck
Unlock for access to all 112 flashcards in this deck.
Unlock Deck
k this deck
47
Acid-test ratio helps to measure a company's ability to pay all its current liabilities if they came due immediately.
Unlock Deck
Unlock for access to all 112 flashcards in this deck.
Unlock Deck
k this deck
48
Which of the following is the base amount when performing vertical analysis of an income statement?
A)total expenses
B)net sales
C)sales revenue
D)gross profit
A)total expenses
B)net sales
C)sales revenue
D)gross profit
Unlock Deck
Unlock for access to all 112 flashcards in this deck.
Unlock Deck
k this deck
49
A common-size statement reports only percentages that appear in a:
A)horizontal analysis report.
B)financial statement.
C)vertical analysis report.
D)ratio analysis report.
A)horizontal analysis report.
B)financial statement.
C)vertical analysis report.
D)ratio analysis report.
Unlock Deck
Unlock for access to all 112 flashcards in this deck.
Unlock Deck
k this deck
50
The vertical analysis statement of Nobell Inc. is as below: The figure 47.0% shown for gross profit in 2016 signifies that:
A)gross profit is equal to 47.0% of net income.
B)gross profit is increased by 47.0% over the previous year.
C)gross profit is 47.0% of net sales revenue.
D)gross profit is 47.0% of cost of goods sold.
The figure 47.0% shown for gross profit in 2016 signifies that:A)gross profit is equal to 47.0% of net income.
B)gross profit is increased by 47.0% over the previous year.
C)gross profit is 47.0% of net sales revenue.
D)gross profit is 47.0% of cost of goods sold.
Unlock Deck
Unlock for access to all 112 flashcards in this deck.
Unlock Deck
k this deck
51
Prepare a comparative common-size income statement for Nobell Inc. using the 2015 and 2014 data. Round off the percentages to one decimal place.
Unlock Deck
Unlock for access to all 112 flashcards in this deck.
Unlock Deck
k this deck
52
To calculate the acid-test ratio, merchandise inventory and prepaid expenses are ignored.
Unlock Deck
Unlock for access to all 112 flashcards in this deck.
Unlock Deck
k this deck
53
Olivera Inc. provides the following data for the year 2015: On vertical analysis report, gross profit as a percentage of net sales will be:
A)35.9%
B)41.67%
C)56.1%
D)44.1%
On vertical analysis report, gross profit as a percentage of net sales will be:A)35.9%
B)41.67%
C)56.1%
D)44.1%
Unlock Deck
Unlock for access to all 112 flashcards in this deck.
Unlock Deck
k this deck
54
The cash ratio helps to determine a company's ability to meet its short-term obligations using cash and cash equivalents.
Unlock Deck
Unlock for access to all 112 flashcards in this deck.
Unlock Deck
k this deck
55
Data for Martin Corp and Tortoize Inc. as follows: Prepare a comparative common-size income statement for Martin Corp and Tortoize Inc. for the year ending December 31, 2016. Round off the percentages to two decimal places. Use a multiple step format for the income statement.
Prepare a comparative common-size income statement for Martin Corp and Tortoize Inc. for the year ending December 31, 2016. Round off the percentages to two decimal places. Use a multiple step format for the income statement. Unlock Deck
Unlock for access to all 112 flashcards in this deck.
Unlock Deck
k this deck
56
Which of the following is the base amount when performing vertical analysis of a balance sheet?
A)total assets
B)total cash and cash equivalents
C)net income
D)gross profit
A)total assets
B)total cash and cash equivalents
C)net income
D)gross profit
Unlock Deck
Unlock for access to all 112 flashcards in this deck.
Unlock Deck
k this deck
57
The current ratio is calculated as the total current assets divided by the total current liabilities.
Unlock Deck
Unlock for access to all 112 flashcards in this deck.
Unlock Deck
k this deck
58
The merchandise inventory turnover ratio measures how profitably a company sells its average level of merchandise inventory during a year.
Unlock Deck
Unlock for access to all 112 flashcards in this deck.
Unlock Deck
k this deck
59
Shelcal Inc. provides the following data for the year 2015: On vertical analysis report, cost of goods sold as a percentage of net sales will amount to:
A)59.42%
B)61.15%
C)63.48%
D)64.07%
On vertical analysis report, cost of goods sold as a percentage of net sales will amount to:A)59.42%
B)61.15%
C)63.48%
D)64.07%
Unlock Deck
Unlock for access to all 112 flashcards in this deck.
Unlock Deck
k this deck
60
Which of the following types of financial statement analysis would be used to see how a company's operating expenses as a percentage of net sales have changed from one year to the next?
A)vertical analysis
B)horizontal analysis
C)ratio analysis
D)analysis of internal control system
A)vertical analysis
B)horizontal analysis
C)ratio analysis
D)analysis of internal control system
Unlock Deck
Unlock for access to all 112 flashcards in this deck.
Unlock Deck
k this deck
61
The ratio of the market price of a share of stock to the dividends paid per share is called the earnings per share.
Unlock Deck
Unlock for access to all 112 flashcards in this deck.
Unlock Deck
k this deck
62
The times-interest-earned ratio is also known as interest-coverage ratio.
Unlock Deck
Unlock for access to all 112 flashcards in this deck.
Unlock Deck
k this deck
63
Which of the following items is a measure of a company's ability to collect receivables?
A)inventory turnover ratio
B)current ratio
C)day's sales in receivables
D)account receivable balance
A)inventory turnover ratio
B)current ratio
C)day's sales in receivables
D)account receivable balance
Unlock Deck
Unlock for access to all 112 flashcards in this deck.
Unlock Deck
k this deck
64
The current ratio is a key indicator of a company's ability to pay current liabilities.
Unlock Deck
Unlock for access to all 112 flashcards in this deck.
Unlock Deck
k this deck
65
As per FASB guidelines, earnings per share should appear on the face of the income statement.
Unlock Deck
Unlock for access to all 112 flashcards in this deck.
Unlock Deck
k this deck
66
The debt to equity ratio shows the proportion of total liabilities relative to total equity.
Unlock Deck
Unlock for access to all 112 flashcards in this deck.
Unlock Deck
k this deck
67
The net income of a company for the year ended was $500,000. The company has no preferred stock. Common stockholders' equity was $1,000,000 at the beginning of the year and $2,000,000 at the end of the year. Calculate the return on common stockholders' equity.
A)18.75%
B)20.00%
C)21.43%
D)33.33%
A)18.75%
B)20.00%
C)21.43%
D)33.33%
Unlock Deck
Unlock for access to all 112 flashcards in this deck.
Unlock Deck
k this deck
68
The gross profit percentage is an indicator of how well a company is positioned to pay off its short-term liabilities.
Unlock Deck
Unlock for access to all 112 flashcards in this deck.
Unlock Deck
k this deck
69
Rate of return on common stockholders' equity shows how much income is earned for each $1 invested by the common shareholders.
Unlock Deck
Unlock for access to all 112 flashcards in this deck.
Unlock Deck
k this deck
70
The dividend payout ratio indicates the amount of the dividend as a proportion of a share's market price.
Unlock Deck
Unlock for access to all 112 flashcards in this deck.
Unlock Deck
k this deck
71
Rate of return on assets measures how efficiently the assets are used to earn a profit.
Unlock Deck
Unlock for access to all 112 flashcards in this deck.
Unlock Deck
k this deck
72
The price/earnings ratio indicates the:
A)dividend yield of the company.
B)market price of $1 of earnings.
C)proportion of total assets financed by debt.
D)ease of selling merchandise inventory.
A)dividend yield of the company.
B)market price of $1 of earnings.
C)proportion of total assets financed by debt.
D)ease of selling merchandise inventory.
Unlock Deck
Unlock for access to all 112 flashcards in this deck.
Unlock Deck
k this deck
73
The price/earnings ratio shows the market price of $1 of earnings.
Unlock Deck
Unlock for access to all 112 flashcards in this deck.
Unlock Deck
k this deck
74
The asset turnover rate is a way to evaluate how well a company can pay its short-term liabilities.
Unlock Deck
Unlock for access to all 112 flashcards in this deck.
Unlock Deck
k this deck
75
Days' sales in inventory is a ratio measure that shows how quickly a company can collect its receivables.
Unlock Deck
Unlock for access to all 112 flashcards in this deck.
Unlock Deck
k this deck
76
The debt ratio is the ratio of total debt divided by total equity.
Unlock Deck
Unlock for access to all 112 flashcards in this deck.
Unlock Deck
k this deck
77
Days' sales in receivables measures the return on average receivables using credit sales.
Unlock Deck
Unlock for access to all 112 flashcards in this deck.
Unlock Deck
k this deck
78
A corporation has 2,000 shares, 10% preferred stock of $50 par, and 6,000 shares of common stock outstanding. The net income for the year is $250,000. Calculate earnings per share.
A)$50
B)$40
C)$42
D)$125
A)$50
B)$40
C)$42
D)$125
Unlock Deck
Unlock for access to all 112 flashcards in this deck.
Unlock Deck
k this deck
79
The times-interest-earned ratio measures the number of times that operating income can pay interest expense.
Unlock Deck
Unlock for access to all 112 flashcards in this deck.
Unlock Deck
k this deck
80
The accounts receivable turnover is an indicator of the ability of a company to collect cash from its credit customers.
Unlock Deck
Unlock for access to all 112 flashcards in this deck.
Unlock Deck
k this deck
Unlock Deck
Unlock for access to all 112 flashcards in this deck.


