Deck 13: Chi-Square Applications
Full screen (f)
Question
Question
Question
Question
Question
Question
Question
Question
Question
Question
Question
Question
Question
Question
Question
Question
Question
Question
Question
Question
Question
Question
Question
Question
Question
Question
Question
Question
Question
Question
Question
Question
Question
Question
Question
Question
Question
Question
Question
Question
Question
NARRBEGIN: Stocks
One thousand stocks watched by a financial advisory company are advertised as having an average return-on-equity (ROE)of 11.4 percent and a standard deviation of 3 percent.An inquiry is made by a prospective client who finds that the ROE is supposed to be normally distributed for these stocks.The prospective client obtains a list of the stocks and randomly samples 300 stocks and records the ROE.The results are: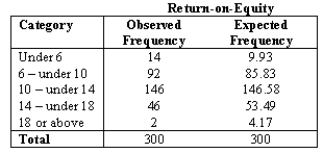
What are the appropriate degrees of freedom based on the above data?
Question
Question
NARRBEGIN: Large city
A large city is in the process of voting on a bond issue to build a covered sports arena.A local political analyst wishes to determine if the level of income will impact on the decision of the voters.He takes a sample of 350 who plan to vote in the upcoming election.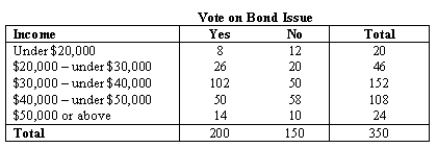
What is the calculated value of the test statistic?
Question
NARRBEGIN: Mean Profit
A report stated that the mean profit margin of 1000 publicly held corporations is 7.5 percent and the standard deviation is 5.1 percent.Profit margins appear normally distributed.A financial analyst sampled 100 of these companies to test whether or not the mean and standard deviation are as stated.The sample results were: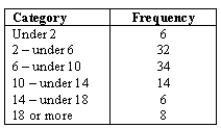
What is the expected frequency of the under 2 category?
Question
NARRBEGIN: Mean Profit
A report stated that the mean profit margin of 1000 publicly held corporations is 7.5 percent and the standard deviation is 5.1 percent.Profit margins appear normally distributed.A financial analyst sampled 100 of these companies to test whether or not the mean and standard deviation are as stated.The sample results were:
What is the expected frequency of the 18 or more category?
Question
Question
NARRBEGIN: Accommodations
Business travelers stay in a variety of accommodations.A set of national percentages for types of accommodations shows their choices below.During a sluggish economy there may be changes in business traveler accommodation patterns so a travel consultant surveyed 300 business travelers and asked about their accommodations.These data will be used to test whether or not the present accommodation distribution is the same as the national one.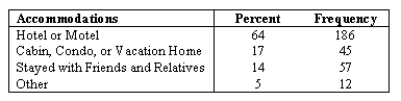
What is the expected frequency of the Hotel or Motel category?
Question
NARRBEGIN: Large city
A large city is in the process of voting on a bond issue to build a covered sports arena.A local political analyst wishes to determine if the level of income will impact on the decision of the voters.He takes a sample of 350 who plan to vote in the upcoming election.
What is the expected frequency of the $50,000 and over and No categories?
Question
NARRBEGIN: Department store
A large department store records the number of returns per day in women's dresses for reasons such as wrong size; husband didn't like it,color,etc.The manager of the women's dresses department recalls from her statistics class in college that the Poisson distribution might describe such events.A random sample of 150 days is taken.The number of returns per day in the sample as well as the observed frequencies are shown below: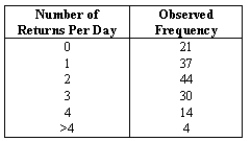
She tests the hypothesis that returns per day are Poisson distributed with a population mean equal to 1.90.Her significance level is 0.05.What are the appropriate degrees of freedom?
Question
Question
NARRBEGIN: Accommodations
Business travelers stay in a variety of accommodations.A set of national percentages for types of accommodations shows their choices below.During a sluggish economy there may be changes in business traveler accommodation patterns so a travel consultant surveyed 300 business travelers and asked about their accommodations.These data will be used to test whether or not the present accommodation distribution is the same as the national one.
What are the appropriate degrees of freedom?
Question
NARRBEGIN: Stocks
One thousand stocks watched by a financial advisory company are advertised as having an average return-on-equity (ROE)of 11.4 percent and a standard deviation of 3 percent.An inquiry is made by a prospective client who finds that the ROE is supposed to be normally distributed for these stocks.The prospective client obtains a list of the stocks and randomly samples 300 stocks and records the ROE.The results are:
What is the calculated value of the chi-square test statistic?
Question
NARRBEGIN: Stocks
One thousand stocks watched by a financial advisory company are advertised as having an average return-on-equity (ROE)of 11.4 percent and a standard deviation of 3 percent.An inquiry is made by a prospective client who finds that the ROE is supposed to be normally distributed for these stocks.The prospective client obtains a list of the stocks and randomly samples 300 stocks and records the ROE.The results are:
What is the appropriate table value for the .10 significance level?
Question
NARRBEGIN: Accommodations
Business travelers stay in a variety of accommodations.A set of national percentages for types of accommodations shows their choices below.During a sluggish economy there may be changes in business traveler accommodation patterns so a travel consultant surveyed 300 business travelers and asked about their accommodations.These data will be used to test whether or not the present accommodation distribution is the same as the national one.
What is the computed value of the chi-square test statistic?
Question
Question
NARRBEGIN: Large city
A large city is in the process of voting on a bond issue to build a covered sports arena.A local political analyst wishes to determine if the level of income will impact on the decision of the voters.He takes a sample of 350 who plan to vote in the upcoming election.
What is the appropriate table value for a test for independence at the 0.025 significance level?
Question
NARRBEGIN: Gifts
Three choices of free gifts are offered to 270 persons who subscribed to a new magazine.The number choosing each gift is shown in the table below.Assume the null hypothesis that the gifts are equally attractive to the subscribers.Use a 0.01 significance level.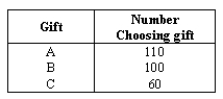
Compute the test statistic.
Three choices of free gifts are offered to 270 persons who subscribed to a new magazine.The number choosing each gift is shown in the table below.Assume the null hypothesis that the gifts are equally attractive to the subscribers.Use a 0.01 significance level.
Compute the test statistic.
Question
NARRBEGIN: Video
The owner of a video store is interested in whether or not there is a difference in the proportions of VCR movies rented by members and non-members among movie titles.Three movies are selected and each person who rents them is identified as a member or non-member.A total of 350 people rent these movies and the responses are: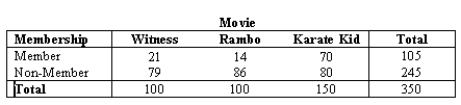
What are the degrees of freedom for the test of equal proportions?
Question
Question
NARRBEGIN: Mean Profit
A report stated that the mean profit margin of 1000 publicly held corporations is 7.5 percent and the standard deviation is 5.1 percent.Profit margins appear normally distributed.A financial analyst sampled 100 of these companies to test whether or not the mean and standard deviation are as stated.The sample results were:
A test for independence is applied to a contingency table with 4 rows and 5 columns for two nominal variables.Calculate the degrees of freedom for this test.
Question
When samples of size n are drawn from a normal population,the chi-square distribution is the sampling distribution of  = ____________________,where s2 and
  are the sample and population variances,respectively.
= ____________________,where s2 and are the sample and population variances,respectively. Question
Question
NARRBEGIN: Video
The owner of a video store is interested in whether or not there is a difference in the proportions of VCR movies rented by members and non-members among movie titles.Three movies are selected and each person who rents them is identified as a member or non-member.A total of 350 people rent these movies and the responses are:
What is the computed value of the test statistic?
Question
NARRBEGIN: Employee
Four employees are monitored to determine whether there is any difference in the proportions of acceptable parts produced by the employees.The sample of parts produced is given below.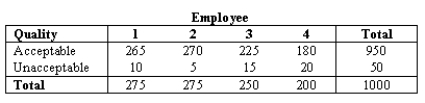
These data provide the information for testing the hypothesis that the proportion of unacceptable is the same for the four employees.What is the expected frequency for Acceptable and employee 3?
Question
NARRBEGIN: Biology
A biology professor claimed that the proportions of grades in his classes are the same.A sample of 100 students showed the following frequencies: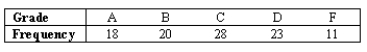
In a hypothesis test for the population variance,the alternate hypothesis is the population variance is greater than 17.0.The significance level to be used is 0.025 and the sample size to be taken is 25.What table value should we use from the chi-square distribution?
Question
NARRBEGIN: Hypotheses
In testing the hypotheses:
H0: H1:
H1:  a random sample of 10 observations was drawn from a normal population,and the sample standard deviation was 0.043.
Compute the value of the test statistic.
In testing the hypotheses:
H0:
H1: a random sample of 10 observations was drawn from a normal population,and the sample standard deviation was 0.043.Compute the value of the test statistic.
Question
NARRBEGIN: Employee
Four employees are monitored to determine whether there is any difference in the proportions of acceptable parts produced by the employees.The sample of parts produced is given below.
These data provide the information for testing the hypothesis that the proportion of unacceptable is the same for the four employees.What will be the degrees of freedom for this test?
Question
Question
NARRBEGIN: Biology
A biology professor claimed that the proportions of grades in his classes are the same.A sample of 100 students showed the following frequencies:
Compute the value of the test statistics.
A biology professor claimed that the proportions of grades in his classes are the same.A sample of 100 students showed the following frequencies:
Compute the value of the test statistics.
Question
When samples of size n are drawn from a normal population,the ____________________ distribution is the sampling distribution of  .
.
. Question
NARRBEGIN: Video
The owner of a video store is interested in whether or not there is a difference in the proportions of VCR movies rented by members and non-members among movie titles.Three movies are selected and each person who rents them is identified as a member or non-member.A total of 350 people rent these movies and the responses are:
What is the critical value for a 0.01 significance level?
Question
Question
NARRBEGIN: Video
The owner of a video store is interested in whether or not there is a difference in the proportions of VCR movies rented by members and non-members among movie titles.Three movies are selected and each person who rents them is identified as a member or non-member.A total of 350 people rent these movies and the responses are:
What is the expected frequency of the cell Rambo and Non-member?
Question
Question
NARRBEGIN: Biology
A biology professor claimed that the proportions of grades in his classes are the same.A sample of 100 students showed the following frequencies:
In a hypothesis test for the population variance,the alternate hypothesis is the population variance is less than 17.0.The significance level to be used is 0.025 and the sample size to be taken is 25.What table value should we use from the chi-square distribution?
Question
NARRBEGIN: Employee
Four employees are monitored to determine whether there is any difference in the proportions of acceptable parts produced by the employees.The sample of parts produced is given below.
These data provide the information for testing the hypothesis that the proportion of unacceptable is the same for the four employees.At a significance level of 0.01,what will be he critical value for this chi-square test?
Question
Question
Question
Question
NARRBEGIN: Employee
Four employees are monitored to determine whether there is any difference in the proportions of acceptable parts produced by the employees.The sample of parts produced is given below.
These data provide the information for testing the hypothesis that the proportion of unacceptable is the same for the four employees.Calculate the test statistic.

Unlock Deck
Sign up to unlock the cards in this deck!
Unlock Deck
Unlock Deck
1/134
Play
Full screen (f)
Deck 13: Chi-Square Applications
1
The area to the right of a chi-square value is 0.025.For 5 degrees of freedom,the table value is:
A) 12.833.
B) 15.086.
C) 11.07.
D) 11.143.
E) 16.182.
A) 12.833.
B) 15.086.
C) 11.07.
D) 11.143.
E) 16.182.
12.833.
2
In goodness-of-fit tests,the chi-square analysis is applied for the purpose of examining whether two nominal-scale variables are related to each other.
False
3
In a goodness-of-fit chi-square test,a large amount of discrepancy between the frequencies that are observed and those that are expected tend to cause us to fail to reject the null hypothesis.
False
4
The goodness-of-fit chi-square test is a two-tailed test.
Unlock Deck
Unlock for access to all 134 flashcards in this deck.
Unlock Deck
k this deck
5
With larger and larger numbers of categories in chi-square tests,the chi-square distribution takes on the shape of the:
A) Poisson distribution.
B) t-distribution.
C) normal distribution.
D) F-distribution.
E) binomial distribution.
A) Poisson distribution.
B) t-distribution.
C) normal distribution.
D) F-distribution.
E) binomial distribution.
Unlock Deck
Unlock for access to all 134 flashcards in this deck.
Unlock Deck
k this deck
6
The purpose of the chi-square analysis to test the independence of two variables is to determine the exact nature of the relationship between two ratio variables.
Unlock Deck
Unlock for access to all 134 flashcards in this deck.
Unlock Deck
k this deck
7
Although the chi-square distribution is continuous,it is used to analyze discrete (counts)data.
Unlock Deck
Unlock for access to all 134 flashcards in this deck.
Unlock Deck
k this deck
8
The chi-square distribution is skewed to the left (negatively skewed),but as degrees of freedom increase,it approaches the shape of the binomial distribution.
Unlock Deck
Unlock for access to all 134 flashcards in this deck.
Unlock Deck
k this deck
9
Which of the following tests will determine whether sample data could have been drawn from a population having a specified probability distribution?
A) independence of two variables
B) comparing proportions from two independent samples
C) estimating the population variance
D) goodness-of-fit test
E) confidence interval around a sample mean
A) independence of two variables
B) comparing proportions from two independent samples
C) estimating the population variance
D) goodness-of-fit test
E) confidence interval around a sample mean
Unlock Deck
Unlock for access to all 134 flashcards in this deck.
Unlock Deck
k this deck
10
Like the critical values for the normal distribution and the t-distribution,the critical values for the chi-square distribution can be either positive or negative.
Unlock Deck
Unlock for access to all 134 flashcards in this deck.
Unlock Deck
k this deck
11
The chi-square distribution can be used in constructing confidence intervals and carrying out hypothesis tests regarding the value of a population variance.
Unlock Deck
Unlock for access to all 134 flashcards in this deck.
Unlock Deck
k this deck
12
Since the sample variance is the point estimate for the population variance,the confidence interval for the population variance will be the sample variance plus or minus a fixed quantity.
Unlock Deck
Unlock for access to all 134 flashcards in this deck.
Unlock Deck
k this deck
13
The goodness-of-fit test requires that the sample data be arranged into categories that are both mutually exclusive and exhaustive.
Unlock Deck
Unlock for access to all 134 flashcards in this deck.
Unlock Deck
k this deck
14
By using chi-square analysis,we can compare two or more sample proportions at the same time.
Unlock Deck
Unlock for access to all 134 flashcards in this deck.
Unlock Deck
k this deck
15
The normal distribution can be used to examine whether two nominal variables could be independent of each other.
Unlock Deck
Unlock for access to all 134 flashcards in this deck.
Unlock Deck
k this deck
16
In order to use the chi-square distribution to construct confidence intervals and carry out hypothesis tests regarding the value of a population variance,an important assumption to be made is that the population is chi-square distributed.
Unlock Deck
Unlock for access to all 134 flashcards in this deck.
Unlock Deck
k this deck
17
A chi-square test for independence with 8 degrees of freedom results in a test statistic of 18.21.Using the chi-square table,the most accurate statement that can be made about the p-value for this test is that:
A) p-value > 0.20.
B) 0.025 > p-value > 0.01.
C) 0.05 > p-value > 0.025.
D) 0.10 > p-value > 0.05.
E) 0.20 > p-value > 0.10.
A) p-value > 0.20.
B) 0.025 > p-value > 0.01.
C) 0.05 > p-value > 0.025.
D) 0.10 > p-value > 0.05.
E) 0.20 > p-value > 0.10.
Unlock Deck
Unlock for access to all 134 flashcards in this deck.
Unlock Deck
k this deck
18
When the number of degrees of freedom is small,the shape of the chi-square distribution is
A) symmetrical.
B) uniform.
C) positively skewed.
D) negatively skewed.
E) normal.
A) symmetrical.
B) uniform.
C) positively skewed.
D) negatively skewed.
E) normal.
Unlock Deck
Unlock for access to all 134 flashcards in this deck.
Unlock Deck
k this deck
19
For all practical purposes,the test for equality of proportions is really just a special case for the independence of two variables.
Unlock Deck
Unlock for access to all 134 flashcards in this deck.
Unlock Deck
k this deck
20
For the chi-square goodness-of-fit test,the null hypothesis is rejected whenever:
A) the calculated chi-square statistic is less than the critical value.
B) the calculated chi-square statistic is equal to the critical value.
C) the calculated chi-square statistic is greater than the critical value.
D) the calculated chi-square statistic is not equal to the critical value.
A) the calculated chi-square statistic is less than the critical value.
B) the calculated chi-square statistic is equal to the critical value.
C) the calculated chi-square statistic is greater than the critical value.
D) the calculated chi-square statistic is not equal to the critical value.
Unlock Deck
Unlock for access to all 134 flashcards in this deck.
Unlock Deck
k this deck
21
In a goodness-of-fit test,the null hypothesis states that the data came from a normally distributed population.The researcher estimated the population mean and population standard deviation from a sample of 500 observations.In addition,the researcher used 6 standardized intervals to test for normality.Using a 5% level of significance,the critical value for this test is:
A) 11.143.
B) 9.348.
C) 7.815.
D) 9.488.
A) 11.143.
B) 9.348.
C) 7.815.
D) 9.488.
Unlock Deck
Unlock for access to all 134 flashcards in this deck.
Unlock Deck
k this deck
22
To determine whether data were drawn from a specific distribution,we use a:
A) chi-square goodness-of-fit test.
B) chi-square test of a contingency table.
C) chi-square test for normality.
D) chi-square test for a population variance.
A) chi-square goodness-of-fit test.
B) chi-square test of a contingency table.
C) chi-square test for normality.
D) chi-square test for a population variance.
Unlock Deck
Unlock for access to all 134 flashcards in this deck.
Unlock Deck
k this deck
23
In the goodness-of-fit chi-square test,the rule of thumb that the expected frequency for each category should be at least 5 exists because:
A) the chi-square distribution is not symmetrical when the expected frequency of a category is less than 5.
B) the test statistic for the chi-square distribution is based on the assumption that the expected frequency of each category is greater than 5.
C) the chi-square distribution is negatively skewed when the expected frequency of a category is less than 5.
D) the chi-square distribution is continuous while the counts on which the test statistic are based are discrete.
E) the chi-square distribution is positively skewed when the expected frequency of a category is less than 5.
Unlock Deck
Unlock for access to all 134 flashcards in this deck.
Unlock Deck
k this deck
24
Which of the following tests do not use the chi-square distribution?
A) Test of a contingency table
B) Goodness-of-fit test
C) Difference between two population means test
D) All of these tests use the chi-squared distribution
A) Test of a contingency table
B) Goodness-of-fit test
C) Difference between two population means test
D) All of these tests use the chi-squared distribution
Unlock Deck
Unlock for access to all 134 flashcards in this deck.
Unlock Deck
k this deck
25
A chi-square goodness-of-fit test is always conducted as:
A) a left-tail test.
B) a right-tail test.
C) a two-tail test.
D) the answer depends of whether the hypothesis is directional or nondirectional.
A) a left-tail test.
B) a right-tail test.
C) a two-tail test.
D) the answer depends of whether the hypothesis is directional or nondirectional.
Unlock Deck
Unlock for access to all 134 flashcards in this deck.
Unlock Deck
k this deck
26
In the goodness-of-fit chi-square test,under which assumption are the expected frequencies constructed?
A) The population follows the chi-square distribution.
B) The null hypothesis is true.
C) The alternative hypothesis is true.
D) The null hypothesis is false.
E) None of the above assumptions are necessary to construct the expected frequencies.
A) The population follows the chi-square distribution.
B) The null hypothesis is true.
C) The alternative hypothesis is true.
D) The null hypothesis is false.
E) None of the above assumptions are necessary to construct the expected frequencies.
Unlock Deck
Unlock for access to all 134 flashcards in this deck.
Unlock Deck
k this deck
27
A chi-square test for independence with 10 degrees of freedom results in a test statistic of 18.21.Using the chi-square table,the most accurate statement that can be made about the p-value for this test is that:
A) p-value > 0.20.
B) 0.025 > p-value > 0.01.
C) 0.05 > p-value > 0.025.
D) 0.10 > p-value > 0.05.
E) 0.20 > p-value > 0.10.
A) p-value > 0.20.
B) 0.025 > p-value > 0.01.
C) 0.05 > p-value > 0.025.
D) 0.10 > p-value > 0.05.
E) 0.20 > p-value > 0.10.
Unlock Deck
Unlock for access to all 134 flashcards in this deck.
Unlock Deck
k this deck
28
For a chi-square distributed random variable with 12 degrees of freedom and a significance level of 0.025 the chi-square value from the table is 23.337.Which of the following computed values of chi-square will lead to acceptance of the null hypothesis?
A) 42.22
B) 28.43
C) 31.34
D) 26.34
E) 18.26
A) 42.22
B) 28.43
C) 31.34
D) 26.34
E) 18.26
Unlock Deck
Unlock for access to all 134 flashcards in this deck.
Unlock Deck
k this deck
29
To use the chi-square distribution table to select a table value requires the following:
A) numerator degrees of freedom.
B) denominator degrees of freedom.
C) level of significance.
D) degrees of freedom.
E) C and D above.
A) numerator degrees of freedom.
B) denominator degrees of freedom.
C) level of significance.
D) degrees of freedom.
E) C and D above.
Unlock Deck
Unlock for access to all 134 flashcards in this deck.
Unlock Deck
k this deck
30
In chi-square tests,the conventional and conservative rule,known as the Rule of Five,is to require that:
A) observed frequency for each cell be at least five.
B) degrees of freedom for the test be at least five.
C) expected frequency for each cell be at least five.
D) difference between the observed and expected frequency for each cell be at least five.
A) observed frequency for each cell be at least five.
B) degrees of freedom for the test be at least five.
C) expected frequency for each cell be at least five.
D) difference between the observed and expected frequency for each cell be at least five.
Unlock Deck
Unlock for access to all 134 flashcards in this deck.
Unlock Deck
k this deck
31
The chi-square test statistic is chi-squared distributed with n - 1 degrees of freedom only if the:
A) population is normally distributed.
B) sample is normally distributed.
C) sample has a Student t-distribution with degrees of freedom equal to n - 1.
D) population has a Student t-distribution with degrees of freedom equal to n.
A) population is normally distributed.
B) sample is normally distributed.
C) sample has a Student t-distribution with degrees of freedom equal to n - 1.
D) population has a Student t-distribution with degrees of freedom equal to n.
Unlock Deck
Unlock for access to all 134 flashcards in this deck.
Unlock Deck
k this deck
32
In testing a population variance or constructing a confidence interval for the population variance,an essential assumption is that:
A) sample size exceeds 30.
B) expected frequencies equal or exceed 5.
C) the population is uniformly distributed.
D) the population is normally distributed.
E) the population is binomially distributed.
A) sample size exceeds 30.
B) expected frequencies equal or exceed 5.
C) the population is uniformly distributed.
D) the population is normally distributed.
E) the population is binomially distributed.
Unlock Deck
Unlock for access to all 134 flashcards in this deck.
Unlock Deck
k this deck
33
In a chi-squared test of a contingency table,the value of the test statistic was 2 = 12.678,and the critical value at = 0.025 was 14.4494.Thus:
A) we fail to reject the null hypothesis at= 0.025.
B) we reject the null hypothesis at= 0.025.
C) we don't have enough evidence to accept or reject the null hypothesis at= 0.025.
D) we should decrease the level of significance in order to reject the null hypothesis.
A) we fail to reject the null hypothesis at= 0.025.
B) we reject the null hypothesis at= 0.025.
C) we don't have enough evidence to accept or reject the null hypothesis at= 0.025.
D) we should decrease the level of significance in order to reject the null hypothesis.
Unlock Deck
Unlock for access to all 134 flashcards in this deck.
Unlock Deck
k this deck
34
Which of the following would be the recommended action if the expected frequency for a particular category is less than 5 in the goodness-of-fit chi-square test?
A) Decrease the significance level so that each category will have an expected frequency greater than 5.
B) Combine adjacent cells so that the result will have an expected frequency greater than 5.
C) Increase the sample size so that each category will have an expected frequency greater than 5.
D) Either b or c could be used to ensure that each category will have an expected frequency greater than 5.
E) Either a,b or c could be used to ensure that each category will have an expected frequency greater than 5.
Unlock Deck
Unlock for access to all 134 flashcards in this deck.
Unlock Deck
k this deck
35
The middle 0.95 portion of the chi-square distribution with 10 degrees of freedom has table values of:
A) 2.558,3.247,respectively.
B) 3.247,18.307,respectively.
C) 3.247,20.483,respectively.
D) 3.940,20.483,respectively.
E) 4.366,23.843,respectively.
A) 2.558,3.247,respectively.
B) 3.247,18.307,respectively.
C) 3.247,20.483,respectively.
D) 3.940,20.483,respectively.
E) 4.366,23.843,respectively.
Unlock Deck
Unlock for access to all 134 flashcards in this deck.
Unlock Deck
k this deck
36
The chi-square test of independence is based upon:
A) two qualitative variables.
B) two quantitative variables.
C) three or more qualitative variables.
D) three or more quantitative variables.
A) two qualitative variables.
B) two quantitative variables.
C) three or more qualitative variables.
D) three or more quantitative variables.
Unlock Deck
Unlock for access to all 134 flashcards in this deck.
Unlock Deck
k this deck
37
The chi-square distribution is used in:
A) a goodness-of-fit test.
B) a test of a contingency table.
C) making inferences about a single population variance.
D) comparing proportions from independent samples.
E) all of these answers are correct.
A) a goodness-of-fit test.
B) a test of a contingency table.
C) making inferences about a single population variance.
D) comparing proportions from independent samples.
E) all of these answers are correct.
Unlock Deck
Unlock for access to all 134 flashcards in this deck.
Unlock Deck
k this deck
38
A left tail area in the chi-square distribution equals 0.95.For df = 10,the table value equals:
A) 18.307.
B) 15.987.
C) 3.940.
D) 20.483.
A) 18.307.
B) 15.987.
C) 3.940.
D) 20.483.
Unlock Deck
Unlock for access to all 134 flashcards in this deck.
Unlock Deck
k this deck
39
Of the values for a chi-squared test statistic listed below,which one is likely to lead to rejecting the null hypothesis in a goodness-of-fit test?
A) 30
B) 3
C) 2
D) 1
A) 30
B) 3
C) 2
D) 1
Unlock Deck
Unlock for access to all 134 flashcards in this deck.
Unlock Deck
k this deck
40
In a goodness-of-fit chi-square test,if the null hypothesis states "The sample was drawn from a population that follows the normal distribution" and the test has 7 categories that are mutually exclusive and exhaustive,the number of degrees of freedom will be
A) 4
B) 5
C) 6
D) 7
E) 8
A) 4
B) 5
C) 6
D) 7
E) 8
Unlock Deck
Unlock for access to all 134 flashcards in this deck.
Unlock Deck
k this deck
41
NARRBEGIN: Stocks
One thousand stocks watched by a financial advisory company are advertised as having an average return-on-equity (ROE)of 11.4 percent and a standard deviation of 3 percent.An inquiry is made by a prospective client who finds that the ROE is supposed to be normally distributed for these stocks.The prospective client obtains a list of the stocks and randomly samples 300 stocks and records the ROE.The results are:
What are the appropriate degrees of freedom based on the above data?
Unlock Deck
Unlock for access to all 134 flashcards in this deck.
Unlock Deck
k this deck
42
The Forest Management Institute is conducting a test,which involves measuring the size of trees by photographing from helicopter rather than actual field measurement.This process is especially important in forest areas accessible only by helicopter.A sample of 31 trees measured by aerial photography had a sample standard deviation of 2.24.A 95 percent confidence interval for the population variance is represented by the values:
A) 30(2.24)/ 46.979 and 30(2.24)/ 16.791.
B) 30(2.242)/ 46.979 and 30(2.242)/ 16.791.
C) 31(2.24)/ 16.791 and 31(2.24)/ 46.979.
D) 31(2.242)/ 46.979 and 31(2.242)/ 16.791.
E) 30(2.24)/ 16.791 and 30(2.24)/ 46.979.
A) 30(2.24)/ 46.979 and 30(2.24)/ 16.791.
B) 30(2.242)/ 46.979 and 30(2.242)/ 16.791.
C) 31(2.24)/ 16.791 and 31(2.24)/ 46.979.
D) 31(2.242)/ 46.979 and 31(2.242)/ 16.791.
E) 30(2.24)/ 16.791 and 30(2.24)/ 46.979.
Unlock Deck
Unlock for access to all 134 flashcards in this deck.
Unlock Deck
k this deck
43
NARRBEGIN: Large city
A large city is in the process of voting on a bond issue to build a covered sports arena.A local political analyst wishes to determine if the level of income will impact on the decision of the voters.He takes a sample of 350 who plan to vote in the upcoming election.
What is the calculated value of the test statistic?
Unlock Deck
Unlock for access to all 134 flashcards in this deck.
Unlock Deck
k this deck
44
NARRBEGIN: Mean Profit
A report stated that the mean profit margin of 1000 publicly held corporations is 7.5 percent and the standard deviation is 5.1 percent.Profit margins appear normally distributed.A financial analyst sampled 100 of these companies to test whether or not the mean and standard deviation are as stated.The sample results were:
What is the expected frequency of the under 2 category?
Unlock Deck
Unlock for access to all 134 flashcards in this deck.
Unlock Deck
k this deck
45
NARRBEGIN: Mean Profit
A report stated that the mean profit margin of 1000 publicly held corporations is 7.5 percent and the standard deviation is 5.1 percent.Profit margins appear normally distributed.A financial analyst sampled 100 of these companies to test whether or not the mean and standard deviation are as stated.The sample results were:
What is the expected frequency of the 18 or more category?
Unlock Deck
Unlock for access to all 134 flashcards in this deck.
Unlock Deck
k this deck
46
The null hypothesis states that the sample data came from a normally distributed population.The researcher calculates the sample mean and the sample standard deviation from the data.The data arrangement consisted of six categories.Using a 0.01 significance level,what is the appropriate critical value for this chi-square test?
Unlock Deck
Unlock for access to all 134 flashcards in this deck.
Unlock Deck
k this deck
47
NARRBEGIN: Accommodations
Business travelers stay in a variety of accommodations.A set of national percentages for types of accommodations shows their choices below.During a sluggish economy there may be changes in business traveler accommodation patterns so a travel consultant surveyed 300 business travelers and asked about their accommodations.These data will be used to test whether or not the present accommodation distribution is the same as the national one.
What is the expected frequency of the Hotel or Motel category?
Unlock Deck
Unlock for access to all 134 flashcards in this deck.
Unlock Deck
k this deck
48
NARRBEGIN: Large city
A large city is in the process of voting on a bond issue to build a covered sports arena.A local political analyst wishes to determine if the level of income will impact on the decision of the voters.He takes a sample of 350 who plan to vote in the upcoming election.
What is the expected frequency of the $50,000 and over and No categories?
Unlock Deck
Unlock for access to all 134 flashcards in this deck.
Unlock Deck
k this deck
49
NARRBEGIN: Department store
A large department store records the number of returns per day in women's dresses for reasons such as wrong size; husband didn't like it,color,etc.The manager of the women's dresses department recalls from her statistics class in college that the Poisson distribution might describe such events.A random sample of 150 days is taken.The number of returns per day in the sample as well as the observed frequencies are shown below:
She tests the hypothesis that returns per day are Poisson distributed with a population mean equal to 1.90.Her significance level is 0.05.What are the appropriate degrees of freedom?
A large department store records the number of returns per day in women's dresses for reasons such as wrong size; husband didn't like it,color,etc.The manager of the women's dresses department recalls from her statistics class in college that the Poisson distribution might describe such events.A random sample of 150 days is taken.The number of returns per day in the sample as well as the observed frequencies are shown below:
She tests the hypothesis that returns per day are Poisson distributed with a population mean equal to 1.90.Her significance level is 0.05.What are the appropriate degrees of freedom?
Unlock Deck
Unlock for access to all 134 flashcards in this deck.
Unlock Deck
k this deck
50
A researcher is studying cancer mortality rates for men in five southern states.In the five states,the sample standard deviation is 6.76 (per 100,000).A 98 percent confidence interval estimate of the population variance is represented by:
A) 5(6.76)/ 13.277 and 5(6.76)/ 0.297.
B) 5(6.762)/ 13.277 and 5(6.762)/ 0.297.
C) 4(6.76)/ 13.277 and 4(6.76)/ 0.297.
D) 4(6.762)/ 13.277 and 4(6.762)/ 0.297.
E) 4(6.762)/ 0.297 and 4(6.762)/ 13.277.
A) 5(6.76)/ 13.277 and 5(6.76)/ 0.297.
B) 5(6.762)/ 13.277 and 5(6.762)/ 0.297.
C) 4(6.76)/ 13.277 and 4(6.76)/ 0.297.
D) 4(6.762)/ 13.277 and 4(6.762)/ 0.297.
E) 4(6.762)/ 0.297 and 4(6.762)/ 13.277.
Unlock Deck
Unlock for access to all 134 flashcards in this deck.
Unlock Deck
k this deck
51
NARRBEGIN: Accommodations
Business travelers stay in a variety of accommodations.A set of national percentages for types of accommodations shows their choices below.During a sluggish economy there may be changes in business traveler accommodation patterns so a travel consultant surveyed 300 business travelers and asked about their accommodations.These data will be used to test whether or not the present accommodation distribution is the same as the national one.
What are the appropriate degrees of freedom?
Unlock Deck
Unlock for access to all 134 flashcards in this deck.
Unlock Deck
k this deck
52
NARRBEGIN: Stocks
One thousand stocks watched by a financial advisory company are advertised as having an average return-on-equity (ROE)of 11.4 percent and a standard deviation of 3 percent.An inquiry is made by a prospective client who finds that the ROE is supposed to be normally distributed for these stocks.The prospective client obtains a list of the stocks and randomly samples 300 stocks and records the ROE.The results are:
What is the calculated value of the chi-square test statistic?
Unlock Deck
Unlock for access to all 134 flashcards in this deck.
Unlock Deck
k this deck
53
NARRBEGIN: Stocks
One thousand stocks watched by a financial advisory company are advertised as having an average return-on-equity (ROE)of 11.4 percent and a standard deviation of 3 percent.An inquiry is made by a prospective client who finds that the ROE is supposed to be normally distributed for these stocks.The prospective client obtains a list of the stocks and randomly samples 300 stocks and records the ROE.The results are:
What is the appropriate table value for the .10 significance level?
Unlock Deck
Unlock for access to all 134 flashcards in this deck.
Unlock Deck
k this deck
54
NARRBEGIN: Accommodations
Business travelers stay in a variety of accommodations.A set of national percentages for types of accommodations shows their choices below.During a sluggish economy there may be changes in business traveler accommodation patterns so a travel consultant surveyed 300 business travelers and asked about their accommodations.These data will be used to test whether or not the present accommodation distribution is the same as the national one.
What is the computed value of the chi-square test statistic?
Unlock Deck
Unlock for access to all 134 flashcards in this deck.
Unlock Deck
k this deck
55
In a hypothesis test for the population variance,the alternate hypothesis is the population variance does not equal 17.0.The significance level to be used is 0.05 and the sample size to be taken is 25.The table value(s)to use from the chi-square distribution is (are):
A) 39.364.
B) 40.647.
C) 12.401 and 39.364.
D) 13.120 and 40.647.
E) 12.401.
A) 39.364.
B) 40.647.
C) 12.401 and 39.364.
D) 13.120 and 40.647.
E) 12.401.
Unlock Deck
Unlock for access to all 134 flashcards in this deck.
Unlock Deck
k this deck
56
NARRBEGIN: Large city
A large city is in the process of voting on a bond issue to build a covered sports arena.A local political analyst wishes to determine if the level of income will impact on the decision of the voters.He takes a sample of 350 who plan to vote in the upcoming election.
What is the appropriate table value for a test for independence at the 0.025 significance level?
Unlock Deck
Unlock for access to all 134 flashcards in this deck.
Unlock Deck
k this deck
57
NARRBEGIN: Gifts
Three choices of free gifts are offered to 270 persons who subscribed to a new magazine.The number choosing each gift is shown in the table below.Assume the null hypothesis that the gifts are equally attractive to the subscribers.Use a 0.01 significance level.
Compute the test statistic.
Three choices of free gifts are offered to 270 persons who subscribed to a new magazine.The number choosing each gift is shown in the table below.Assume the null hypothesis that the gifts are equally attractive to the subscribers.Use a 0.01 significance level.
Compute the test statistic.
Unlock Deck
Unlock for access to all 134 flashcards in this deck.
Unlock Deck
k this deck
58
NARRBEGIN: Video
The owner of a video store is interested in whether or not there is a difference in the proportions of VCR movies rented by members and non-members among movie titles.Three movies are selected and each person who rents them is identified as a member or non-member.A total of 350 people rent these movies and the responses are:
What are the degrees of freedom for the test of equal proportions?
Unlock Deck
Unlock for access to all 134 flashcards in this deck.
Unlock Deck
k this deck
59
Lily Energy Systems manufactures wood-burning heaters and fireplace inserts.One of its systems has an electric blower,which is thermostatically controlled.The blower is designed to automatically turn on when the temperature in the stove reaches 125 degrees F.and turn off at 85 degrees F.Complaints from customers indicate that the thermostat control is not working properly.The company feels that the thermostat is acceptable if the variance in the cutoff temperature is less than or equal to 175.The company takes a sample of 24 thermostats and finds that the variance equals 289.The calculated chi-square test statistic and the table value for a 0.05 significance level are:
A) 35.172,38.99.
B) 37.983,35.172.
C) 38.076,38.99.
D) 37.983,38.076.
E) none of these.
A) 35.172,38.99.
B) 37.983,35.172.
C) 38.076,38.99.
D) 37.983,38.076.
E) none of these.
Unlock Deck
Unlock for access to all 134 flashcards in this deck.
Unlock Deck
k this deck
60
NARRBEGIN: Mean Profit
A report stated that the mean profit margin of 1000 publicly held corporations is 7.5 percent and the standard deviation is 5.1 percent.Profit margins appear normally distributed.A financial analyst sampled 100 of these companies to test whether or not the mean and standard deviation are as stated.The sample results were:
A test for independence is applied to a contingency table with 4 rows and 5 columns for two nominal variables.Calculate the degrees of freedom for this test.
Unlock Deck
Unlock for access to all 134 flashcards in this deck.
Unlock Deck
k this deck
61
When samples of size n are drawn from a normal population,the chi-square distribution is the sampling distribution of = ____________________,where s2 and are the sample and population variances,respectively.
= ____________________,where s2 and are the sample and population variances,respectively. Unlock Deck
Unlock for access to all 134 flashcards in this deck.
Unlock Deck
k this deck
62
The starting point for the chi-square test of variable independence is the ____________________.
Unlock Deck
Unlock for access to all 134 flashcards in this deck.
Unlock Deck
k this deck
63
NARRBEGIN: Video
The owner of a video store is interested in whether or not there is a difference in the proportions of VCR movies rented by members and non-members among movie titles.Three movies are selected and each person who rents them is identified as a member or non-member.A total of 350 people rent these movies and the responses are:
What is the computed value of the test statistic?
Unlock Deck
Unlock for access to all 134 flashcards in this deck.
Unlock Deck
k this deck
64
NARRBEGIN: Employee
Four employees are monitored to determine whether there is any difference in the proportions of acceptable parts produced by the employees.The sample of parts produced is given below.
These data provide the information for testing the hypothesis that the proportion of unacceptable is the same for the four employees.What is the expected frequency for Acceptable and employee 3?
Unlock Deck
Unlock for access to all 134 flashcards in this deck.
Unlock Deck
k this deck
65
NARRBEGIN: Biology
A biology professor claimed that the proportions of grades in his classes are the same.A sample of 100 students showed the following frequencies:
In a hypothesis test for the population variance,the alternate hypothesis is the population variance is greater than 17.0.The significance level to be used is 0.025 and the sample size to be taken is 25.What table value should we use from the chi-square distribution?
Unlock Deck
Unlock for access to all 134 flashcards in this deck.
Unlock Deck
k this deck
66
NARRBEGIN: Hypotheses
In testing the hypotheses:
H0: H1: a random sample of 10 observations was drawn from a normal population,and the sample standard deviation was 0.043.
Compute the value of the test statistic.
In testing the hypotheses:
H0:
H1: a random sample of 10 observations was drawn from a normal population,and the sample standard deviation was 0.043.Compute the value of the test statistic.
Unlock Deck
Unlock for access to all 134 flashcards in this deck.
Unlock Deck
k this deck
67
NARRBEGIN: Employee
Four employees are monitored to determine whether there is any difference in the proportions of acceptable parts produced by the employees.The sample of parts produced is given below.
These data provide the information for testing the hypothesis that the proportion of unacceptable is the same for the four employees.What will be the degrees of freedom for this test?
Unlock Deck
Unlock for access to all 134 flashcards in this deck.
Unlock Deck
k this deck
68
Find the chi-square value for each of the four degrees of freedom below,given that the area to the left of a chi-square value is 0.05.
A)2 ____________________
B)6 ____________________
C)10 ____________________
D)26 ____________________
A)2 ____________________
B)6 ____________________
C)10 ____________________
D)26 ____________________
Unlock Deck
Unlock for access to all 134 flashcards in this deck.
Unlock Deck
k this deck
69
NARRBEGIN: Biology
A biology professor claimed that the proportions of grades in his classes are the same.A sample of 100 students showed the following frequencies:
Compute the value of the test statistics.
A biology professor claimed that the proportions of grades in his classes are the same.A sample of 100 students showed the following frequencies:
Compute the value of the test statistics.
Unlock Deck
Unlock for access to all 134 flashcards in this deck.
Unlock Deck
k this deck
70
When samples of size n are drawn from a normal population,the ____________________ distribution is the sampling distribution of .
. Unlock Deck
Unlock for access to all 134 flashcards in this deck.
Unlock Deck
k this deck
71
NARRBEGIN: Video
The owner of a video store is interested in whether or not there is a difference in the proportions of VCR movies rented by members and non-members among movie titles.Three movies are selected and each person who rents them is identified as a member or non-member.A total of 350 people rent these movies and the responses are:
What is the critical value for a 0.01 significance level?
Unlock Deck
Unlock for access to all 134 flashcards in this deck.
Unlock Deck
k this deck
72
When we apply chi-square analysis to examine whether sample data could have been drawn from a population having a specified probability distribution,we are performing ____________________ tests.
Unlock Deck
Unlock for access to all 134 flashcards in this deck.
Unlock Deck
k this deck
73
NARRBEGIN: Video
The owner of a video store is interested in whether or not there is a difference in the proportions of VCR movies rented by members and non-members among movie titles.Three movies are selected and each person who rents them is identified as a member or non-member.A total of 350 people rent these movies and the responses are:
What is the expected frequency of the cell Rambo and Non-member?
Unlock Deck
Unlock for access to all 134 flashcards in this deck.
Unlock Deck
k this deck
74
NARRBEGIN: Metro Bus System
The management of the Metro Bus System of Houston,TX was faced with the task of improving efficiency in terms of running on time.One of its greatest problems was breakdown of equipment.Between 1994 and 1997,emphasis was placed on maintenance.Random samples of 10,000 bus runs were taken from the records of 1994 and 1997.The percentage of breakdowns in 1994 was 0.4 and in 1997 it was 0.04.Use a chi-square test for equal proportions to analyze these data.
What is the value of the test statistic?
Unlock Deck
Unlock for access to all 134 flashcards in this deck.
Unlock Deck
k this deck
75
NARRBEGIN: Biology
A biology professor claimed that the proportions of grades in his classes are the same.A sample of 100 students showed the following frequencies:
In a hypothesis test for the population variance,the alternate hypothesis is the population variance is less than 17.0.The significance level to be used is 0.025 and the sample size to be taken is 25.What table value should we use from the chi-square distribution?
Unlock Deck
Unlock for access to all 134 flashcards in this deck.
Unlock Deck
k this deck
76
NARRBEGIN: Employee
Four employees are monitored to determine whether there is any difference in the proportions of acceptable parts produced by the employees.The sample of parts produced is given below.
These data provide the information for testing the hypothesis that the proportion of unacceptable is the same for the four employees.At a significance level of 0.01,what will be he critical value for this chi-square test?
Unlock Deck
Unlock for access to all 134 flashcards in this deck.
Unlock Deck
k this deck
77
Find the chi-square value for each of the right-tail areas below,given that the degrees of freedom are 7:
A)0.95 ____________________
B)0.01 ____________________
C)0.025 ____________________
D)0.05 ____________________
A)0.95 ____________________
B)0.01 ____________________
C)0.025 ____________________
D)0.05 ____________________
Unlock Deck
Unlock for access to all 134 flashcards in this deck.
Unlock Deck
k this deck
78
Under the assumption that the null hypothesis is true,we construct a table of ____________________ that are based on the probability distribution from which the sample is assumed to have been drawn.
Unlock Deck
Unlock for access to all 134 flashcards in this deck.
Unlock Deck
k this deck
79
NARRBEGIN: Survey
In a survey of 100 males and 100 females at a regional university,26 percent of the males and 18 percent of the females responded that they were offended by frequently aired television.The test question is: Could these results indicate that the same proportions of the two samples are offended?
What is the calculated value of the test statistic?
Unlock Deck
Unlock for access to all 134 flashcards in this deck.
Unlock Deck
k this deck
80
NARRBEGIN: Employee
Four employees are monitored to determine whether there is any difference in the proportions of acceptable parts produced by the employees.The sample of parts produced is given below.
These data provide the information for testing the hypothesis that the proportion of unacceptable is the same for the four employees.Calculate the test statistic.
Unlock Deck
Unlock for access to all 134 flashcards in this deck.
Unlock Deck
k this deck
Unlock Deck
Unlock for access to all 134 flashcards in this deck.


