Deck 7: Financial Statement Analysis
Full screen (f)
Question
Question
Question
Question
Question
Question
Question
Question
Question
Question
Question
Question
Question
Question
Question
Question
Question
Question
Question
Question
Question
Question
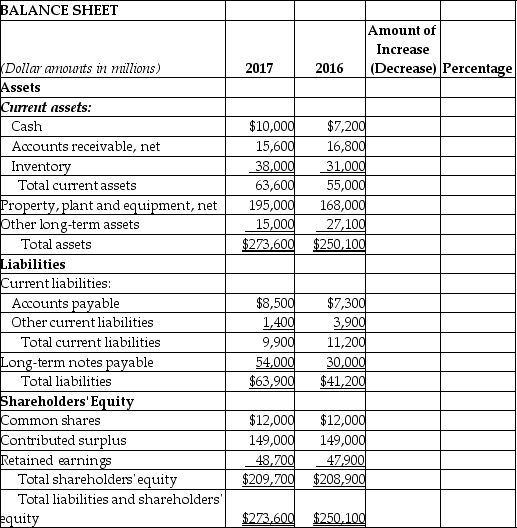
38_Selected items from the balance sheet and income statement are shown below for the Carswell Corporation for 2017 and 2016.Calculate the amount of the change and the percentage change for each item.

Question
Question
Question
Question
Table 18-11 Alpha Products
The following data on Alpha Products, Inc. is available.
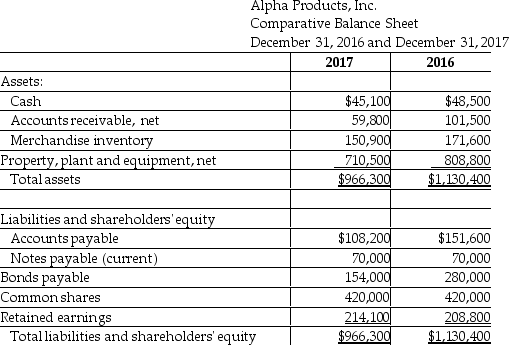
-Refer to Table 18-11.What was the percent increase or decrease in net accounts payable from 2016 to 2017?
A) 28.6% increase
B) 28.6% decrease
C) 40.1% increase
D) 40.1% decrease
The following data on Alpha Products, Inc. is available.
-Refer to Table 18-11.What was the percent increase or decrease in net accounts payable from 2016 to 2017?
A) 28.6% increase
B) 28.6% decrease
C) 40.1% increase
D) 40.1% decrease
Question
Question
La Paz Company reported the following data: 
Which of the following statements is an accurate conclusion about the 2017 results,based on the above data?
A) Revenues fell and expenses rose over the 2-year period, resulting in a drop in net income.
B) Net income improved, despite a rise in operating expenses.
C) Gross margin declined over two years, resulting in a drop in net income.
D) The increase in net income resulted primarily from an increase in gross margin coupled with a decrease in operating expenses.
Question
Question
Question
Question
Question
Table 18 -4
The following is a summary of information presented on the financial statements of The Cake Company on December 31, 2017.
-Refer to Table 18-4.What would a horizontal analysis report with respect to net income before income tax expense and net income show?
A) that both net income before income tax expense and net income are 45.45% of net sales revenue
B) a $25,000 increase in both net income before income tax expense and net income
C) a 45.45% increase in both net income before income tax expense and net income
D) a 145% increase in both net income before income tax expense and net income
Question
Table 18-11 Alpha Products
The following data on Alpha Products, Inc. is available.
-Refer to Table 18-11.What was the percent increase or decrease in net property,plant and equipment from 2016 to 2017?
A) 12.2% decrease
B) 12.2% increase
C) 13.8% increase
D) 13.8% decrease
The following data on Alpha Products, Inc. is available.
-Refer to Table 18-11.What was the percent increase or decrease in net property,plant and equipment from 2016 to 2017?
A) 12.2% decrease
B) 12.2% increase
C) 13.8% increase
D) 13.8% decrease
Question
Table 18 -4
The following is a summary of information presented on the financial statements of The Cake Company on December 31, 2017.
-Refer to Table 18-4.What would a horizontal analysis report with respect to current liabilities show?
A) that current liabilities are 38.46% of total capital
B) a 50.00% increase in current liabilities
C) a current ratio of 0.87
D) a 33.33% increase in current liabilities
Question
39_Data for the most recent four fiscal years of Colt Corporation are given below:
 a_Prepare an analysis showing the trend percentages for the four-year period using 2014 as the base year.
b_What do the trend percentages indicate regarding Colt Corporation's income statement data?
a_Prepare an analysis showing the trend percentages for the four-year period using 2014 as the base year.b_What do the trend percentages indicate regarding Colt Corporation's income statement data?
Question
Question
Table 18 -4
The following is a summary of information presented on the financial statements of The Cake Company on December 31, 2017.
-Refer to Table 18-4.What would a horizontal analysis report with respect to long-term liabilities show?
A) that long-term liabilities decreased by $30,000
B) that long-term liabilities decreased by 40%
C) that long-term liabilities decreased by 60%
D) that long-term liabilities decreased by 67%
Question
Question
40_Following is a comparative income statement for Chui Corporation:

 Expenses:
 a_Prepare a horizontal analysis of Chui income statement.
b_What positive/negative changes do you see that may have contributed to the $8,000 decrease in net income?
Expenses: a_Prepare a horizontal analysis of Chui income statement.b_What positive/negative changes do you see that may have contributed to the $8,000 decrease in net income?
Question
Question
Question
Question
Question
41_Presented below is a comparative balance sheet for VTeck Corporation for 2017 and 2016.Prepare a horizontal analysis of VTeck Corporation's balance sheet.

 Property,plant and equipment
 Liabilities
Current liabilities
 Shareholders' equity

Property,plant and equipment LiabilitiesCurrent liabilities
Shareholders' equity Question
Question
Question
43_Perform a horizontal analysis of the following company's balance sheet.Include both the amount and the percentage of change for each account.
Question
Question
Question
Question
Question
Question
Question
Question
Question
44_La Paz Company reported the following information.Perform a horizontal analysis on the information provided.Include both the amount and the percentage of change for each account.
Question
42_The following table shows selected data for Wong Corporation for the past five years ended December 31,2017:
 a_Prepare an analysis showing the trend percentages for the five years 2013-2017,using 2013 as the base year.
b_What was the inventory turnover for 2016?
c_What was the accounts receivable turnover for 2017?
a_Prepare an analysis showing the trend percentages for the five years 2013-2017,using 2013 as the base year.b_What was the inventory turnover for 2016?
c_What was the accounts receivable turnover for 2017?
Question
Question
Question
Question
Table 18 -5
Olivera Company provides the following data for the year 2017:

-Refer to Table 18-5.On a vertical analysis,what percentage would be shown for cost of goods sold?
A) 59.4%
B) 61.0%
C) 63.4%
D) 64.1%
Olivera Company provides the following data for the year 2017:
-Refer to Table 18-5.On a vertical analysis,what percentage would be shown for cost of goods sold?
A) 59.4%
B) 61.0%
C) 63.4%
D) 64.1%
Question
26_Prepare vertical analysis calculations by filling in the far right column of Horizon Corporation's balance sheet with the appropriate percentages:

 Current assets


 Current liabilities

 Shareholders' equity

Current assets Current liabilities Shareholders' equity Question
Question
Question
Question
Table 18 -5
Olivera Company provides the following data for the year 2017:
-Refer to Table 18-5.On a vertical analysis,what percentage would be shown for gross margin?
A) 35.9%
B) 35.6%
C) 39.0%
D) 44.1%
Olivera Company provides the following data for the year 2017:
-Refer to Table 18-5.On a vertical analysis,what percentage would be shown for gross margin?
A) 35.9%
B) 35.6%
C) 39.0%
D) 44.1%
Question
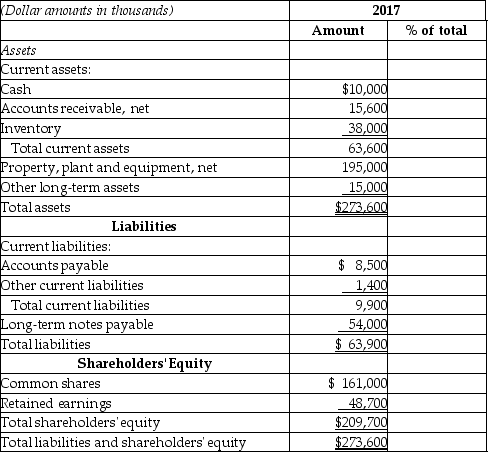
28_Complete a vertical analysis on the La Paz Company balance sheet data shown in the format below:
Question
Table 18 -5
Olivera Company provides the following data for the year 2017:
-Refer to Table 18-5.On a vertical analysis,what percentage would be shown for operating income?
A) 22.9%
B) 23.1%
C) 22.1%
D) 21.4%
Olivera Company provides the following data for the year 2017:
-Refer to Table 18-5.On a vertical analysis,what percentage would be shown for operating income?
A) 22.9%
B) 23.1%
C) 22.1%
D) 21.4%
Question
29_La Paz Company reported the following data:
 a_Prepare a vertical analysis of the income statement,both years,showing appropriate percentages for each item listed above.Round percentages to the nearest one-tenth percent.
b_Based on your results,what conclusions can you make?
a_Prepare a vertical analysis of the income statement,both years,showing appropriate percentages for each item listed above.Round percentages to the nearest one-tenth percent.b_Based on your results,what conclusions can you make?
Question
27_Following is the income statement for Masters Corporation for the year ended December 31,2017:

 a_Prepare a vertical analysis of the income statement showing appropriate percentages for each item listed above.
b_What additional information would you need to determine whether these percentages are good or bad?
a_Prepare a vertical analysis of the income statement showing appropriate percentages for each item listed above.b_What additional information would you need to determine whether these percentages are good or bad?
Question
Question
Table 18-6
Arlington Company prepared a common-size income statement, for 2017, to compare its results with its key competitor, Bardo Company. Please refer to the following data:
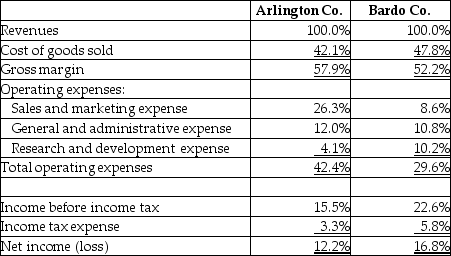
7_Refer to Table 18-6.Based on this data,an analyst could conclude that Arlington's total gross margin,in dollars,is higher than Bardo's.
Arlington Company prepared a common-size income statement, for 2017, to compare its results with its key competitor, Bardo Company. Please refer to the following data:
7_Refer to Table 18-6.Based on this data,an analyst could conclude that Arlington's total gross margin,in dollars,is higher than Bardo's.
Question
Table 18 -5
Olivera Company provides the following data for the year 2017:
-Refer to Table 18-5.On a vertical analysis,what percentage would be shown for operating expenses?
A) 15.9%
B) 16.4%
C) 18.9%
D) 17.5%
Olivera Company provides the following data for the year 2017:
-Refer to Table 18-5.On a vertical analysis,what percentage would be shown for operating expenses?
A) 15.9%
B) 16.4%
C) 18.9%
D) 17.5%
Question
Table 18 -5
Olivera Company provides the following data for the year 2017:
-Refer to Table 18-5.On a vertical analysis,what percentage would be shown for income tax expense?
A) 2.3%
B) 2.5%
C) 2.9%
D) 3.0%
Olivera Company provides the following data for the year 2017:
-Refer to Table 18-5.On a vertical analysis,what percentage would be shown for income tax expense?
A) 2.3%
B) 2.5%
C) 2.9%
D) 3.0%
Question
Question
Question
Question
Table 18 -5
Olivera Company provides the following data for the year 2017:
-Refer to Table 18-5.On a vertical analysis,what percentage would be shown for net income?
A) 22.1%
B) 18.8%
C) 20.1%
D) 27.3%
Olivera Company provides the following data for the year 2017:
-Refer to Table 18-5.On a vertical analysis,what percentage would be shown for net income?
A) 22.1%
B) 18.8%
C) 20.1%
D) 27.3%
Question

Unlock Deck
Sign up to unlock the cards in this deck!
Unlock Deck
Unlock Deck
1/214
Play
Full screen (f)
Deck 7: Financial Statement Analysis
1
3_Long-term solvency is the ability to generate enough cash to meet current payments as they become due.
False
2
9_Horizontal analysis compares each item in the income statement to the net sales amount.
False
3
2_Using standard measures enable investors and creditors to compare companies of similar sizes or different sizes.
True
4
10_If an analyst wishes to see how gross profit of a company has changed from one year to the next,vertical analysis would be the best approach.
Unlock Deck
Unlock for access to all 214 flashcards in this deck.
Unlock Deck
k this deck
5
1_The primary reason for conducting financial analysis is to uncover fraud.
Unlock Deck
Unlock for access to all 214 flashcards in this deck.
Unlock Deck
k this deck
6
Table 18-1
A company reported $175,000 of net income for 2015, $245,000 for 2016, and $220,500 for 2017.
18_Refer to Table 18-1.The percentage change in net income from 2016 to 2017 was:
A) (11.11)%
B) 11.11%
C) (10.00)%
D) 10.00%
A company reported $175,000 of net income for 2015, $245,000 for 2016, and $220,500 for 2017.
18_Refer to Table 18-1.The percentage change in net income from 2016 to 2017 was:
A) (11.11)%
B) 11.11%
C) (10.00)%
D) 10.00%
Unlock Deck
Unlock for access to all 214 flashcards in this deck.
Unlock Deck
k this deck
7
15_The fact that cost of goods sold decreased by 20% from 2016 to 2017 would most likely be revealed by:
A) trend analysis
B) horizontal analysis
C) vertical analysis
D) ratio analysis
A) trend analysis
B) horizontal analysis
C) vertical analysis
D) ratio analysis
Unlock Deck
Unlock for access to all 214 flashcards in this deck.
Unlock Deck
k this deck
8
5_Horizontal analysis is the study of percentage changes in financial statement balances from one year to the next.
Unlock Deck
Unlock for access to all 214 flashcards in this deck.
Unlock Deck
k this deck
9
6_Trend percentages are not a form of horizontal analysis.
Unlock Deck
Unlock for access to all 214 flashcards in this deck.
Unlock Deck
k this deck
10
4_When preparing a horizontal analysis of financial statements,subtract the later year amount from the earlier year amount and divide by the earlier year amount.
Unlock Deck
Unlock for access to all 214 flashcards in this deck.
Unlock Deck
k this deck
11
Table 18-1
A company reported $175,000 of net income for 2015, $245,000 for 2016, and $220,500 for 2017.
17_Refer to Table 18-1.The percentage change in net income from 2015 to 2016 was:
A) 50.00%
B) 40.0%
C) 28.57%
D) 30.00%
A company reported $175,000 of net income for 2015, $245,000 for 2016, and $220,500 for 2017.
17_Refer to Table 18-1.The percentage change in net income from 2015 to 2016 was:
A) 50.00%
B) 40.0%
C) 28.57%
D) 30.00%
Unlock Deck
Unlock for access to all 214 flashcards in this deck.
Unlock Deck
k this deck
12
12_Which of the following is the MOST useful for decision makers?
A) Revenue has increased by $40,000.
B) Gross profit has decreased by $38,000.
C) Revenue has increased by 40%, and our competitor's revenue only grew by 15% in the same time period.
D) Our competitor's revenue grew by $59,600.
A) Revenue has increased by $40,000.
B) Gross profit has decreased by $38,000.
C) Revenue has increased by 40%, and our competitor's revenue only grew by 15% in the same time period.
D) Our competitor's revenue grew by $59,600.
Unlock Deck
Unlock for access to all 214 flashcards in this deck.
Unlock Deck
k this deck
13
16_The fact that cost of goods sold for the current year is 150% of the amount shown for a base year would most likely have been revealed using:
A) trend analysis
B) vertical analysis
C) profitability analysis
D) ratio analysis
A) trend analysis
B) vertical analysis
C) profitability analysis
D) ratio analysis
Unlock Deck
Unlock for access to all 214 flashcards in this deck.
Unlock Deck
k this deck
14
11_If an analyst wishes to see how operating expenses of a company have changed from one year to the next,using a horizontal analysis would be the best approach.
Unlock Deck
Unlock for access to all 214 flashcards in this deck.
Unlock Deck
k this deck
15
13_Horizontal analysis involves the study of:
A) the changes in individual financial statement amounts as a percentage of some related total
B) percentage changes in various financial statement amounts from year to year
C) the change in key financial statement ratios over a certain time frame or horizon
D) the relationship of one financial statement amount to another in the same year
Unlock Deck
Unlock for access to all 214 flashcards in this deck.
Unlock Deck
k this deck
16
7_In order to assess a trend,one would need at least two amounts over a given period of time.
Unlock Deck
Unlock for access to all 214 flashcards in this deck.
Unlock Deck
k this deck
17
8_Horizontal analysis involves the study of the relationship between numbers on the financial statements for one year.
Unlock Deck
Unlock for access to all 214 flashcards in this deck.
Unlock Deck
k this deck
18
14_The percentage change from year to year is calculated by dividing the dollar amount of the change from the earlier period to the later period by:
A) the earlier-period amount and multiply by 100
B) the later-period amount and multiply by 100
C) the average of the amounts shown for the earlier and the later periods
D) 100
A) the earlier-period amount and multiply by 100
B) the later-period amount and multiply by 100
C) the average of the amounts shown for the earlier and the later periods
D) 100
Unlock Deck
Unlock for access to all 214 flashcards in this deck.
Unlock Deck
k this deck
19
20_In 2016,net sales were $1,500,000 and in 2017,net sales were $1,750,000.The percent change is calculated by dividing:
A) $1,500,000 by $1,750,000
B) $1,750,000 by $1,500,000
C) $250,000 by $1,500,000
D) $250,000 by $1,750,000
A) $1,500,000 by $1,750,000
B) $1,750,000 by $1,500,000
C) $250,000 by $1,500,000
D) $250,000 by $1,750,000
Unlock Deck
Unlock for access to all 214 flashcards in this deck.
Unlock Deck
k this deck
20
Table 18-1
A company reported $175,000 of net income for 2015, $245,000 for 2016, and $220,500 for 2017.
-Refer to Table 18-1.The trend analysis in the net income,using 2015 as the base,was::
A)
B)
C)
D)
A company reported $175,000 of net income for 2015, $245,000 for 2016, and $220,500 for 2017.
-Refer to Table 18-1.The trend analysis in the net income,using 2015 as the base,was::
A)
B)
C)
D)
Unlock Deck
Unlock for access to all 214 flashcards in this deck.
Unlock Deck
k this deck
21
30_Assuming the accounts payable balance at the end of 2017 is $75,000,and it has decreased 20% since the end of 2016,the balance at the end of 2016 (rounded to the nearest whole dollar_was:
A) $60,000
B) $93,750
C) $72,000
D) $90,000
A) $60,000
B) $93,750
C) $72,000
D) $90,000
Unlock Deck
Unlock for access to all 214 flashcards in this deck.
Unlock Deck
k this deck
22
38_Selected items from the balance sheet and income statement are shown below for the Carswell Corporation for 2017 and 2016.Calculate the amount of the change and the percentage change for each item.
Unlock Deck
Unlock for access to all 214 flashcards in this deck.
Unlock Deck
k this deck
23
26_When calculating trend percentages,all percentages shown are relative to:
A) the immediately preceding year
B) the current year
C) the base year
D) an average index calculated for all the years shown
A) the immediately preceding year
B) the current year
C) the base year
D) an average index calculated for all the years shown
Unlock Deck
Unlock for access to all 214 flashcards in this deck.
Unlock Deck
k this deck
24
Given the following data for total sales: A table showing trend percentages for 2014-2017,respectively,using 2014 as the base year would show a(n):
A)
B)
C)
D)
A)
B)
C)
D)
Unlock Deck
Unlock for access to all 214 flashcards in this deck.
Unlock Deck
k this deck
25
23_Assuming the inventory balance at the end of 2017 is $20,000,and it has increased by 10% since the end of 2016,the balance at the end of 2016 (rounded to the nearest whole dollar_was:
A) $18,000
B) $18,182
C) $16,364
D) $22,000
A) $18,000
B) $18,182
C) $16,364
D) $22,000
Unlock Deck
Unlock for access to all 214 flashcards in this deck.
Unlock Deck
k this deck
26
Table 18-11 Alpha Products
The following data on Alpha Products, Inc. is available.
-Refer to Table 18-11.What was the percent increase or decrease in net accounts payable from 2016 to 2017?
A) 28.6% increase
B) 28.6% decrease
C) 40.1% increase
D) 40.1% decrease
The following data on Alpha Products, Inc. is available.
-Refer to Table 18-11.What was the percent increase or decrease in net accounts payable from 2016 to 2017?
A) 28.6% increase
B) 28.6% decrease
C) 40.1% increase
D) 40.1% decrease
Unlock Deck
Unlock for access to all 214 flashcards in this deck.
Unlock Deck
k this deck
27
Please refer to the following trend analysis of Pathways Company: Which of the following is a correct conclusion from the above analysis?
A) Net sales in 2014 were equal to 102.3% of net sales for the previous year.
B) Net sales in 2014 were up 2.3% over the previous year.
C) Net sales in 2014 were 2.3% higher than 2010 net sales.
D) Net sales in 2014 were down 90.5% from year 2010.
A) Net sales in 2014 were equal to 102.3% of net sales for the previous year.
B) Net sales in 2014 were up 2.3% over the previous year.
C) Net sales in 2014 were 2.3% higher than 2010 net sales.
D) Net sales in 2014 were down 90.5% from year 2010.
Unlock Deck
Unlock for access to all 214 flashcards in this deck.
Unlock Deck
k this deck
28
La Paz Company reported the following data:
Which of the following statements is an accurate conclusion about the 2017 results,based on the above data?
A) Revenues fell and expenses rose over the 2-year period, resulting in a drop in net income.
B) Net income improved, despite a rise in operating expenses.
C) Gross margin declined over two years, resulting in a drop in net income.
D) The increase in net income resulted primarily from an increase in gross margin coupled with a decrease in operating expenses.
Unlock Deck
Unlock for access to all 214 flashcards in this deck.
Unlock Deck
k this deck
29
29_Assuming the inventory balance at the end of 2017 is $30,000,and it has decreased 5% since the end of 2016,the balance at the end of 2016 (rounded to the nearest whole dollar_was:
A) $27,075
B) $28,500
C) $33,241
D) $31,579
A) $27,075
B) $28,500
C) $33,241
D) $31,579
Unlock Deck
Unlock for access to all 214 flashcards in this deck.
Unlock Deck
k this deck
30
28_Assuming the accounts receivable balance at the end of 2017 is $50,000,and it has increased by 10% per year since the end of 2016,the balance at the end of 2016 (rounded to the nearest whole dollar_was:
A) $45,455
B) $37,566
C) $41,322
D) $55,000
A) $45,455
B) $37,566
C) $41,322
D) $55,000
Unlock Deck
Unlock for access to all 214 flashcards in this deck.
Unlock Deck
k this deck
31
21_In 2016,inventory was $356,400 and in 2017,inventory was $275,000.The percent change is calculated by dividing:
A) $356,400 by 275,000 multiply by 100
B) $275,000 by $356,400 multiply by 100
C) ($81,400) by $356,400 multiply by 100
D) ($81,400) by $275,000 multiply by 100
A) $356,400 by 275,000 multiply by 100
B) $275,000 by $356,400 multiply by 100
C) ($81,400) by $356,400 multiply by 100
D) ($81,400) by $275,000 multiply by 100
Unlock Deck
Unlock for access to all 214 flashcards in this deck.
Unlock Deck
k this deck
32
22_Comparing operating expenses in 2017 with operating expenses in 2016 is an example of:
A) horizontal analysis
B) vertical analysis
C) ratio analysis
D) economic-value-added analysis
A) horizontal analysis
B) vertical analysis
C) ratio analysis
D) economic-value-added analysis
Unlock Deck
Unlock for access to all 214 flashcards in this deck.
Unlock Deck
k this deck
33
Table 18 -4
The following is a summary of information presented on the financial statements of The Cake Company on December 31, 2017.
-Refer to Table 18-4.What would a horizontal analysis report with respect to net income before income tax expense and net income show?
A) that both net income before income tax expense and net income are 45.45% of net sales revenue
B) a $25,000 increase in both net income before income tax expense and net income
C) a 45.45% increase in both net income before income tax expense and net income
D) a 145% increase in both net income before income tax expense and net income
Unlock Deck
Unlock for access to all 214 flashcards in this deck.
Unlock Deck
k this deck
34
Table 18-11 Alpha Products
The following data on Alpha Products, Inc. is available.
-Refer to Table 18-11.What was the percent increase or decrease in net property,plant and equipment from 2016 to 2017?
A) 12.2% decrease
B) 12.2% increase
C) 13.8% increase
D) 13.8% decrease
The following data on Alpha Products, Inc. is available.
-Refer to Table 18-11.What was the percent increase or decrease in net property,plant and equipment from 2016 to 2017?
A) 12.2% decrease
B) 12.2% increase
C) 13.8% increase
D) 13.8% decrease
Unlock Deck
Unlock for access to all 214 flashcards in this deck.
Unlock Deck
k this deck
35
Table 18 -4
The following is a summary of information presented on the financial statements of The Cake Company on December 31, 2017.
-Refer to Table 18-4.What would a horizontal analysis report with respect to current liabilities show?
A) that current liabilities are 38.46% of total capital
B) a 50.00% increase in current liabilities
C) a current ratio of 0.87
D) a 33.33% increase in current liabilities
Unlock Deck
Unlock for access to all 214 flashcards in this deck.
Unlock Deck
k this deck
36
39_Data for the most recent four fiscal years of Colt Corporation are given below:
a_Prepare an analysis showing the trend percentages for the four-year period using 2014 as the base year.
b_What do the trend percentages indicate regarding Colt Corporation's income statement data?
a_Prepare an analysis showing the trend percentages for the four-year period using 2014 as the base year.b_What do the trend percentages indicate regarding Colt Corporation's income statement data?
Unlock Deck
Unlock for access to all 214 flashcards in this deck.
Unlock Deck
k this deck
37
Given the following data for total sales: A table showing trend percentages for 2014-2017,respectively,using 2014 as the base year would show a(n):
A)
B)
C)
D)
A)
B)
C)
D)
Unlock Deck
Unlock for access to all 214 flashcards in this deck.
Unlock Deck
k this deck
38
Table 18 -4
The following is a summary of information presented on the financial statements of The Cake Company on December 31, 2017.
-Refer to Table 18-4.What would a horizontal analysis report with respect to long-term liabilities show?
A) that long-term liabilities decreased by $30,000
B) that long-term liabilities decreased by 40%
C) that long-term liabilities decreased by 60%
D) that long-term liabilities decreased by 67%
Unlock Deck
Unlock for access to all 214 flashcards in this deck.
Unlock Deck
k this deck
39
27_Assuming the inventory balance at the end of 2017 is $35,000,and it has increased 10% since the end of 2016,the balance at the end of 2016 (rounded to the nearest whole dollar_was:
A) $31,818
B) $38,500
C) $30,000
D) $32,500
A) $31,818
B) $38,500
C) $30,000
D) $32,500
Unlock Deck
Unlock for access to all 214 flashcards in this deck.
Unlock Deck
k this deck
40
40_Following is a comparative income statement for Chui Corporation:
Expenses:
a_Prepare a horizontal analysis of Chui income statement.
b_What positive/negative changes do you see that may have contributed to the $8,000 decrease in net income?
Expenses: a_Prepare a horizontal analysis of Chui income statement.b_What positive/negative changes do you see that may have contributed to the $8,000 decrease in net income?
Unlock Deck
Unlock for access to all 214 flashcards in this deck.
Unlock Deck
k this deck
41
15_If vertical analysis,using total assets as the base,shows that total liabilities have increased from 50% to 63%,this would always mean that:
A) the dollar amount of liabilities has increased
B) liabilities have increased as a percentage of total assets
C) the current ratio has decreased
D) the dollar amount of owners' equity has decreased
A) the dollar amount of liabilities has increased
B) liabilities have increased as a percentage of total assets
C) the current ratio has decreased
D) the dollar amount of owners' equity has decreased
Unlock Deck
Unlock for access to all 214 flashcards in this deck.
Unlock Deck
k this deck
42
16_If vertical analysis,using total assets as the base,shows a decrease in current assets from 50% to 36%,this would always mean that:
A) total noncurrent assets have increased as a percentage of total assets
B) the dollar amount of noncurrent assets has increased
C) the current ratio has decreased
D) the dollar amount of total current assets has decreased
A) total noncurrent assets have increased as a percentage of total assets
B) the dollar amount of noncurrent assets has increased
C) the current ratio has decreased
D) the dollar amount of total current assets has decreased
Unlock Deck
Unlock for access to all 214 flashcards in this deck.
Unlock Deck
k this deck
43
2_Vertical analysis would be used to determine what is happening to cost of goods sold from one year to the next.
Unlock Deck
Unlock for access to all 214 flashcards in this deck.
Unlock Deck
k this deck
44
4_Vertical analysis of a financial statement shows the percentage change in an item from period to period.
Unlock Deck
Unlock for access to all 214 flashcards in this deck.
Unlock Deck
k this deck
45
41_Presented below is a comparative balance sheet for VTeck Corporation for 2017 and 2016.Prepare a horizontal analysis of VTeck Corporation's balance sheet.
Property,plant and equipment
Liabilities
Current liabilities
Shareholders' equity
Property,plant and equipment LiabilitiesCurrent liabilities
Shareholders' equity Unlock Deck
Unlock for access to all 214 flashcards in this deck.
Unlock Deck
k this deck
46
Table 18-2
Given the following data:
-Refer to Table 18-2.If net sales increased 10%,and cost of goods sold decreased 20%,gross margin would:
A) increase 20%
B) decrease 40%
C) increase 40%
D) not change
Given the following data:
-Refer to Table 18-2.If net sales increased 10%,and cost of goods sold decreased 20%,gross margin would:
A) increase 20%
B) decrease 40%
C) increase 40%
D) not change
Unlock Deck
Unlock for access to all 214 flashcards in this deck.
Unlock Deck
k this deck
47
12_When performing vertical analysis on an income statement,the base (representing the 100% figure_is generally:
A) net income
B) gross sales
C) gross margin
D) net sales
A) net income
B) gross sales
C) gross margin
D) net sales
Unlock Deck
Unlock for access to all 214 flashcards in this deck.
Unlock Deck
k this deck
48
43_Perform a horizontal analysis of the following company's balance sheet.Include both the amount and the percentage of change for each account.
Unlock Deck
Unlock for access to all 214 flashcards in this deck.
Unlock Deck
k this deck
49
3_Vertical analysis of a financial statement shows the relationship of an item to the total on the statement.
Unlock Deck
Unlock for access to all 214 flashcards in this deck.
Unlock Deck
k this deck
50
5_If an analyst wishes to see how a company's net income as a percentage of net sales has changed from one year to the next,a vertical analysis would be the most appropriate approach.
Unlock Deck
Unlock for access to all 214 flashcards in this deck.
Unlock Deck
k this deck
51
14_If vertical analysis,using net sales as the base,shows a 67% figure for cost of goods sold in the prior year,and a 70% figure for the current year,this would always mean that:
A) cost of goods sold as a percentage of net sales has increased
B) the dollar amount of cost of goods sold has increased
C) gross margin has increased
D) net income has increased
A) cost of goods sold as a percentage of net sales has increased
B) the dollar amount of cost of goods sold has increased
C) gross margin has increased
D) net income has increased
Unlock Deck
Unlock for access to all 214 flashcards in this deck.
Unlock Deck
k this deck
52
6_If an analyst wishes to see a company's current assets as a percentage of total assets,a vertical analysis would be the best approach.
Unlock Deck
Unlock for access to all 214 flashcards in this deck.
Unlock Deck
k this deck
53
11_Vertical analysis looks at:
A) percentage changes in the balances shown in comparative financial statements
B) individual financial statement items expressed as a percentage of a base (which represents 100%)
C) the dollar amount of the change in various financial statement amounts from year to year
D) the change in key financial statement ratios over a specified period of time
Unlock Deck
Unlock for access to all 214 flashcards in this deck.
Unlock Deck
k this deck
54
7_Vertical analysis is used with the income statement,but not with the balance sheet.
Unlock Deck
Unlock for access to all 214 flashcards in this deck.
Unlock Deck
k this deck
55
13_Financial analysts would often perform vertical analysis of the:
A) income statement
B) statement of owner's equity
C) cash flow statement
D) company's financial ratios
A) income statement
B) statement of owner's equity
C) cash flow statement
D) company's financial ratios
Unlock Deck
Unlock for access to all 214 flashcards in this deck.
Unlock Deck
k this deck
56
Table 18-2
Given the following data:
-Refer to Table 18-2.If net sales increased 15%,and gross margin increased 10%,then cost of goods sold must have:
A) decreased 20.0%
B) increased 20.0%
C) decreased 12.5%
D) increased 12.5%
Given the following data:
-Refer to Table 18-2.If net sales increased 15%,and gross margin increased 10%,then cost of goods sold must have:
A) decreased 20.0%
B) increased 20.0%
C) decreased 12.5%
D) increased 12.5%
Unlock Deck
Unlock for access to all 214 flashcards in this deck.
Unlock Deck
k this deck
57
44_La Paz Company reported the following information.Perform a horizontal analysis on the information provided.Include both the amount and the percentage of change for each account.
Unlock Deck
Unlock for access to all 214 flashcards in this deck.
Unlock Deck
k this deck
58
42_The following table shows selected data for Wong Corporation for the past five years ended December 31,2017:
a_Prepare an analysis showing the trend percentages for the five years 2013-2017,using 2013 as the base year.
b_What was the inventory turnover for 2016?
c_What was the accounts receivable turnover for 2017?
a_Prepare an analysis showing the trend percentages for the five years 2013-2017,using 2013 as the base year.b_What was the inventory turnover for 2016?
c_What was the accounts receivable turnover for 2017?
Unlock Deck
Unlock for access to all 214 flashcards in this deck.
Unlock Deck
k this deck
59
Table 18-2
Given the following data:
-Refer to Table 18-2.If net sales increased 15%,and cost of goods sold increased 20%,gross margin would:
A) increase 10%
B) decrease 15%
C) increase 20%
D) decrease 10%
Given the following data:
-Refer to Table 18-2.If net sales increased 15%,and cost of goods sold increased 20%,gross margin would:
A) increase 10%
B) decrease 15%
C) increase 20%
D) decrease 10%
Unlock Deck
Unlock for access to all 214 flashcards in this deck.
Unlock Deck
k this deck
60
1_Vertical analysis of financial statements reveals the relationship of each statement item to a specified base,which is the 100% figure.
Unlock Deck
Unlock for access to all 214 flashcards in this deck.
Unlock Deck
k this deck
61
3_Benchmarking is the practice of comparing a company for the current year to the same company for the previous year.
Unlock Deck
Unlock for access to all 214 flashcards in this deck.
Unlock Deck
k this deck
62
Table 18 -5
Olivera Company provides the following data for the year 2017:
-Refer to Table 18-5.On a vertical analysis,what percentage would be shown for cost of goods sold?
A) 59.4%
B) 61.0%
C) 63.4%
D) 64.1%
Olivera Company provides the following data for the year 2017:
-Refer to Table 18-5.On a vertical analysis,what percentage would be shown for cost of goods sold?
A) 59.4%
B) 61.0%
C) 63.4%
D) 64.1%
Unlock Deck
Unlock for access to all 214 flashcards in this deck.
Unlock Deck
k this deck
63
26_Prepare vertical analysis calculations by filling in the far right column of Horizon Corporation's balance sheet with the appropriate percentages:
Current assets
Current liabilities
Shareholders' equity
Current assets Current liabilities Shareholders' equity Unlock Deck
Unlock for access to all 214 flashcards in this deck.
Unlock Deck
k this deck
64
2_A common-size financial statement reports only percentages and no dollar amounts.
Unlock Deck
Unlock for access to all 214 flashcards in this deck.
Unlock Deck
k this deck
65
Oglethorpe Company reports the following information from the vertical analysis of its income statement: Net income:
in 2017
in 2016 Which of the following statements could be logically concluded from the above data?
A) The company made a higher gross profit in 2017 than in 2016.
B) The company made higher net income in 2017 than in 2016.
C) The company has improved the profit it makes per dollar of sales in 2017.
D) The company's total net income increased by 0.3% in 2017.
Unlock Deck
Unlock for access to all 214 flashcards in this deck.
Unlock Deck
k this deck
66
5_Benchmarking allows a user of financial statements of a company to compare the performance of the company against key competitors.
Unlock Deck
Unlock for access to all 214 flashcards in this deck.
Unlock Deck
k this deck
67
Table 18 -5
Olivera Company provides the following data for the year 2017:
-Refer to Table 18-5.On a vertical analysis,what percentage would be shown for gross margin?
A) 35.9%
B) 35.6%
C) 39.0%
D) 44.1%
Olivera Company provides the following data for the year 2017:
-Refer to Table 18-5.On a vertical analysis,what percentage would be shown for gross margin?
A) 35.9%
B) 35.6%
C) 39.0%
D) 44.1%
Unlock Deck
Unlock for access to all 214 flashcards in this deck.
Unlock Deck
k this deck
68
28_Complete a vertical analysis on the La Paz Company balance sheet data shown in the format below:
Unlock Deck
Unlock for access to all 214 flashcards in this deck.
Unlock Deck
k this deck
69
Table 18 -5
Olivera Company provides the following data for the year 2017:
-Refer to Table 18-5.On a vertical analysis,what percentage would be shown for operating income?
A) 22.9%
B) 23.1%
C) 22.1%
D) 21.4%
Olivera Company provides the following data for the year 2017:
-Refer to Table 18-5.On a vertical analysis,what percentage would be shown for operating income?
A) 22.9%
B) 23.1%
C) 22.1%
D) 21.4%
Unlock Deck
Unlock for access to all 214 flashcards in this deck.
Unlock Deck
k this deck
70
29_La Paz Company reported the following data:
a_Prepare a vertical analysis of the income statement,both years,showing appropriate percentages for each item listed above.Round percentages to the nearest one-tenth percent.
b_Based on your results,what conclusions can you make?
a_Prepare a vertical analysis of the income statement,both years,showing appropriate percentages for each item listed above.Round percentages to the nearest one-tenth percent.b_Based on your results,what conclusions can you make?
Unlock Deck
Unlock for access to all 214 flashcards in this deck.
Unlock Deck
k this deck
71
27_Following is the income statement for Masters Corporation for the year ended December 31,2017:
a_Prepare a vertical analysis of the income statement showing appropriate percentages for each item listed above.
b_What additional information would you need to determine whether these percentages are good or bad?
a_Prepare a vertical analysis of the income statement showing appropriate percentages for each item listed above.b_What additional information would you need to determine whether these percentages are good or bad?
Unlock Deck
Unlock for access to all 214 flashcards in this deck.
Unlock Deck
k this deck
72
6_Benchmarking is the practice of comparing a company's performance with the poorer performing companies in the industry to reinforce current best practices.
Unlock Deck
Unlock for access to all 214 flashcards in this deck.
Unlock Deck
k this deck
73
Table 18-6
Arlington Company prepared a common-size income statement, for 2017, to compare its results with its key competitor, Bardo Company. Please refer to the following data:
7_Refer to Table 18-6.Based on this data,an analyst could conclude that Arlington's total gross margin,in dollars,is higher than Bardo's.
Unlock Deck
Unlock for access to all 214 flashcards in this deck.
Unlock Deck
k this deck
74
Table 18 -5
Olivera Company provides the following data for the year 2017:
-Refer to Table 18-5.On a vertical analysis,what percentage would be shown for operating expenses?
A) 15.9%
B) 16.4%
C) 18.9%
D) 17.5%
Olivera Company provides the following data for the year 2017:
-Refer to Table 18-5.On a vertical analysis,what percentage would be shown for operating expenses?
A) 15.9%
B) 16.4%
C) 18.9%
D) 17.5%
Unlock Deck
Unlock for access to all 214 flashcards in this deck.
Unlock Deck
k this deck
75
Table 18 -5
Olivera Company provides the following data for the year 2017:
-Refer to Table 18-5.On a vertical analysis,what percentage would be shown for income tax expense?
A) 2.3%
B) 2.5%
C) 2.9%
D) 3.0%
Olivera Company provides the following data for the year 2017:
-Refer to Table 18-5.On a vertical analysis,what percentage would be shown for income tax expense?
A) 2.3%
B) 2.5%
C) 2.9%
D) 3.0%
Unlock Deck
Unlock for access to all 214 flashcards in this deck.
Unlock Deck
k this deck
76
Oglethorpe Company reports the following information from the vertical analysis of its balance sheet: Current assets:
in 2017
in 2018 Which of the following statements could be logically concluded from the above data?
A) The company's current ratio declined.
B) The company's current assets declined in proportion to its total assets.
C) The company's ability to pay current liabilities declined.
D) The company's total current assets declined by 0.4%.
Unlock Deck
Unlock for access to all 214 flashcards in this deck.
Unlock Deck
k this deck
77
17_When performing vertical analysis on a balance sheet,the base (representing the 100% figure_is generally:
A) total assets
B) shareholders' equity
C) total liabilities
D) net assets
A) total assets
B) shareholders' equity
C) total liabilities
D) net assets
Unlock Deck
Unlock for access to all 214 flashcards in this deck.
Unlock Deck
k this deck
78
1_Common-size financial statements are infrequently used by financial analysts as they do not compare the financial statement results of one company with average statistics for companies in the same industry.
Unlock Deck
Unlock for access to all 214 flashcards in this deck.
Unlock Deck
k this deck
79
Table 18 -5
Olivera Company provides the following data for the year 2017:
-Refer to Table 18-5.On a vertical analysis,what percentage would be shown for net income?
A) 22.1%
B) 18.8%
C) 20.1%
D) 27.3%
Olivera Company provides the following data for the year 2017:
-Refer to Table 18-5.On a vertical analysis,what percentage would be shown for net income?
A) 22.1%
B) 18.8%
C) 20.1%
D) 27.3%
Unlock Deck
Unlock for access to all 214 flashcards in this deck.
Unlock Deck
k this deck
80
4_Benchmarking allows a user of financial statements of a company to compare the performance of the company against industry average performance.
Unlock Deck
Unlock for access to all 214 flashcards in this deck.
Unlock Deck
k this deck
Unlock Deck
Unlock for access to all 214 flashcards in this deck.


