Deck 9: Profit Maximization
Full screen (f)
Question
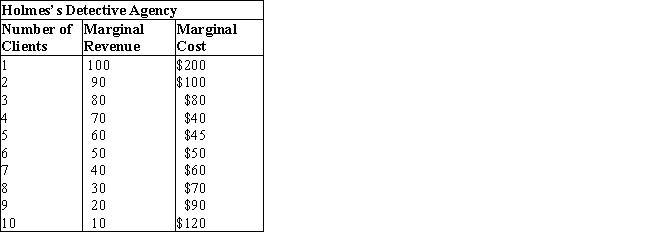
The table given below reports the marginal revenue and marginal cost of Holmes Detective Agency for each client.Table 9.2
The MR schedule can be obtained from the TR schedule by:
A)adding two successive values in the TR schedule.
B)subtracting the succeeding TR value from the preceding TR value.
C)subtracting the preceding TR value from the succeeding TR value.
D)multiplying two successive TR values.
E)dividing the succeeding TR value by the preceding TR value.
Question
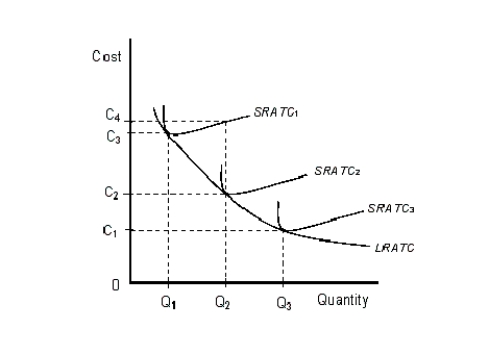
The figure given below shows three Short Run Average Total Cost (SRATC) curves and the Long Run Average Total Cost (LRATC) curve of a firm.Figure 8.3
Profit is the difference between:
A)total output and total costs.
B)total revenue and total costs.
C)total revenue and total sunk costs.
D)total output and total sunk costs.
E)total revenue and opportunity costs.
Profit is the difference between:
A)total output and total costs.
B)total revenue and total costs.
C)total revenue and total sunk costs.
D)total output and total sunk costs.
E)total revenue and opportunity costs.
Question
The table given below reports the marginal revenue and marginal cost of Holmes Detective Agency for each client.Table 9.2
Marginal revenue of nth unit of output is:
A)total revenue of (n+1)th unit minus total revenue of nth unit.
B)total revenue of nth unit minus total revenue of (n-1)th unit.
C)total revenue of (n+1)th unit minus total revenue of (n-1)th unit.
D)the sum of total revenue of (n+1)th unit and nth unit.
E)the sum of total revenue of (n+1)th unit and (n-1)th unit.
Question
The table given below reports the marginal revenue and marginal cost of Holmes Detective Agency for each client.Table 9.2
Assume that a firm's marginal revenue curve intersects the rising portion of the marginal cost curve at 100 units of output. At this output level, a profit-maximizing firm's total cost is $1,000. If the price of the product is $10 per unit, the firm will earn an economic profit of:
A)zero.
B)$400.
C)more than zero but less than $100.
D)$100.
E)more than $100.
Question
The table given below reports the marginal revenue and marginal cost of Holmes Detective Agency for each client.Table 9.2
According to Table 9.2, what will be the total number of clients that will maximize profits for the Holmes Detective Agency?
A)2
B)3
C)5
D)6
E)8
According to Table 9.2, what will be the total number of clients that will maximize profits for the Holmes Detective Agency?
A)2
B)3
C)5
D)6
E)8
Question
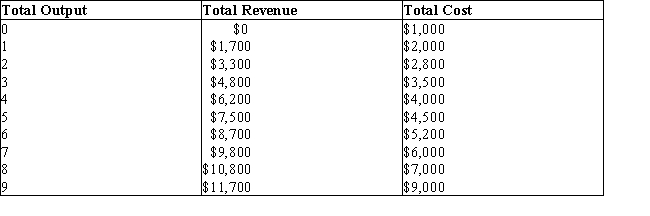
The table given below shows the total revenue and total cost of producing a commodity.Table 9.1
In Table 9.1, marginal revenue exceeds marginal cost:
A)until the fifth unit of output.
B)until the sixth unit of output.
C)up to the seventh unit of output.
D)up to the eighth unit of output.
E)at all units of output.
In Table 9.1, marginal revenue exceeds marginal cost:
A)until the fifth unit of output.
B)until the sixth unit of output.
C)up to the seventh unit of output.
D)up to the eighth unit of output.
E)at all units of output.
Question
The figure given below shows three Short Run Average Total Cost (SRATC) curves and the Long Run Average Total Cost (LRATC) curve of a firm.Figure 8.3
A firm wishing to maximize profits will produce at the level of output where:
A)marginal cost is equal to zero.
B)its total cost curve intersects its total revenue curve.
C)its costs are at a minimum.
D)total revenue exceeds total cost by the largest amount.
E)marginal revenue exceeds marginal cost by the greatest amount.
Question
The figure given below shows three Short Run Average Total Cost (SRATC) curves and the Long Run Average Total Cost (LRATC) curve of a firm.Figure 8.3
In economic theory, we assume that the goal of the firm is to:
A)maximize sales revenue.
B)maximize market share.
C)maximize the benefits it provides to its customers.
D)maximize the profit.
E)maximize the sales volume.
In economic theory, we assume that the goal of the firm is to:
A)maximize sales revenue.
B)maximize market share.
C)maximize the benefits it provides to its customers.
D)maximize the profit.
E)maximize the sales volume.
Question
The table given below reports the marginal revenue and marginal cost of Holmes Detective Agency for each client.Table 9.2
Assume that a firm's marginal revenue curve intersects the rising portion of the marginal cost curve at 100 units of output. At this output level, the profit-maximizing firm's total fixed cost is $600 and its total variable cost is $400. If the price of the product is $8 per unit, the firm should produce:
A)zero units of output.
B)less than 100 units of output.
C)100 units of output.
D)more than 100 units of output.
E)200 units of the output.
Question
The table given below shows the total revenue and total cost of producing a commodity.Table 9.1
In Table 9.1, if the firm produces five units of output, it makes a profit of _____.
A)$3,000
B)$0
C)$800
D)$1,200
E)$1,000
In Table 9.1, if the firm produces five units of output, it makes a profit of _____.
A)$3,000
B)$0
C)$800
D)$1,200
E)$1,000
Question
The table given below reports the marginal revenue and marginal cost of Holmes Detective Agency for each client.Table 9.2
Which of the following is true of marginal revenue?
A)Marginal revenue equals total revenue divided by quantity.
B)Marginal revenue is the slope of the supply curve of a firm.
C)Marginal revenue is the slope of the total cost curve when profit is maximized.
D)Marginal revenue equals the change in total revenue due to an additional unit of output.
E)Marginal revenue equals the income earned by selling stocks on the margin.
Question
The figure given below shows three Short Run Average Total Cost (SRATC) curves and the Long Run Average Total Cost (LRATC) curve of a firm.Figure 8.3
Suppose that at a given level of output, a perfectly competitive firm charges a price of $12 and has average total costs of $10. If its economic profit is $20,000, then it must be producing:
A)40,000 units of output.
B)20,000 units of output.
C)30,000 units of output.
D)10,000 units of output.
E)50,000 units of output.
Question
The table given below reports the marginal revenue and marginal cost of Holmes Detective Agency for each client.Table 9.2
Refer to Table 9.2. If we assume that Holmes is currently serving 8 clients, then Holmes Agency:
A)is maximizing profit.
B)should find more clients to increase profits.
C)is maximizing total revenue.
D)could increase profits by serving less clients.
E)is minimizing cost.
Refer to Table 9.2. If we assume that Holmes is currently serving 8 clients, then Holmes Agency:
A)is maximizing profit.
B)should find more clients to increase profits.
C)is maximizing total revenue.
D)could increase profits by serving less clients.
E)is minimizing cost.
Question
The table given below shows the total revenue and total cost of producing a commodity.Table 9.1
In Table 9.1, the marginal revenue from the sixth unit of output is:
A)$1,700.
B)$1,600.
C)$1,500.
D)$1,300.
E)$1,200.
In Table 9.1, the marginal revenue from the sixth unit of output is:
A)$1,700.
B)$1,600.
C)$1,500.
D)$1,300.
E)$1,200.
Question
The figure given below shows three Short Run Average Total Cost (SRATC) curves and the Long Run Average Total Cost (LRATC) curve of a firm.Figure 8.3
Assume that a firm's marginal revenue curve intersects the rising portion of the marginal cost curve at 100 units of output. At this output level, a profit-maximizing firm's total cost is $1,000. If the price of the product is $3 per unit and the firm produces at the profit-maximizing level, the firm will earn an economic profit equal to:
A)-$1,000.
B)-$700.
C)-$400.
D)-$600.
E)$200.
Question
The table given below shows the total revenue and total cost of producing a commodity.Table 9.1
In Table 9.1, in order to maximize profits, the firm should produce ____ units of output.
A)five
B)six
C)seven
D)eight
E)nine
In Table 9.1, in order to maximize profits, the firm should produce ____ units of output.
A)five
B)six
C)seven
D)eight
E)nine
Question
The table given below shows the total revenue and total cost of producing a commodity.Table 9.1
In Table 9.1, the marginal cost of producing the sixth unit of output is equal to _____.
A)$700
B)$600
C)$500
D)$300
E)$200
In Table 9.1, the marginal cost of producing the sixth unit of output is equal to _____.
A)$700
B)$600
C)$500
D)$300
E)$200
Question
The table given below reports the marginal revenue and marginal cost of Holmes Detective Agency for each client.Table 9.2
Goodspeed Automobiles manufactures 100 disc brake cylinders. At this output level, its marginal revenue is equal to its marginal cost. If the revenue per unit of output is $500 and the per unit cost is $350, its profit is:
A)$20,000.
B)$15,000.
C)$45,000.
D)$25,000.
E)$10,000.
Goodspeed Automobiles manufactures 100 disc brake cylinders. At this output level, its marginal revenue is equal to its marginal cost. If the revenue per unit of output is $500 and the per unit cost is $350, its profit is:
A)$20,000.
B)$15,000.
C)$45,000.
D)$25,000.
E)$10,000.
Question
The table given below reports the marginal revenue and marginal cost of Holmes Detective Agency for each client.Table 9.2
In Table 9.2, assume that Holmes's total fixed cost is zero. Compute the profit earned by the agency with two clients.
A)-$110
B)$110
C)$120
D)-$10
E)$10
In Table 9.2, assume that Holmes's total fixed cost is zero. Compute the profit earned by the agency with two clients.
A)-$110
B)$110
C)$120
D)-$10
E)$10
Question
The table given below reports the marginal revenue and marginal cost of Holmes Detective Agency for each client.Table 9.2
Which of the following is true of marginal cost?
A)Marginal cost is the cost per unit of output produced.
B)Marginal cost is the change in total cost divided by the change in total output.
C)Marginal cost curve is negatively sloped at the profit-maximizing level of output.
D)Marginal cost is equal to total cost divided by the quantity of output.
E)Marginal cost initially increases with an increase in output but subsequently declines.
Question
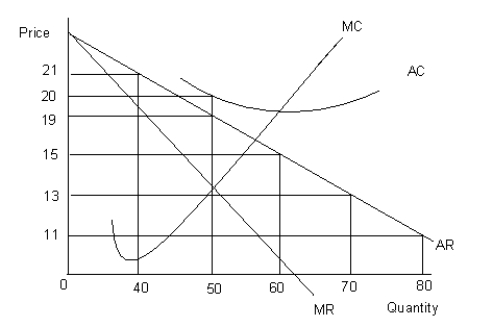
The following graph shows the demand and cost curves of an imperfectly competitive firm. MC and ATC represent the marginal cost curve and the average cost curve respectively.Figure 9.1
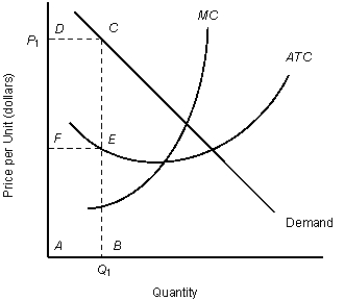
Refer to Figure 9.1. At price P1, the firm sells quantity Q1, and total revenue is shown by:
A)the rectangle ABCD.
B)the rectangle ABEF.
C)the rectangle FECD.
D)the distance AB.
E)the distance BC.
Refer to Figure 9.1. At price P1, the firm sells quantity Q1, and total revenue is shown by:
A)the rectangle ABCD.
B)the rectangle ABEF.
C)the rectangle FECD.
D)the distance AB.
E)the distance BC.
Question
The table given below reports the marginal revenue and marginal cost of Holmes Detective Agency for each client.Table 9.2
Graphically, a firm's total cost is equal to the area of the:
A)triangle formed under the demand curve.
B)rectangle formed under the demand curve at a given price and quantity combination.
C)rectangle formed under the average-total-cost curve at a given ATC and quantity combination.
D)triangle formed by a line segment between the demand and average-total-cost curves.
E)triangle formed by a line segment between the horizontal axis and the average-total-cost curves.
Question
The table given below reports the marginal revenue and marginal cost of Holmes Detective Agency for each client.Table 9.2
The profit of a firm is maximized when:
A)marginal revenue is maximum.
B)marginal revenue is greater than marginal cost.
C)marginal revenue is equal to marginal cost.
D)marginal cost is minimum.
E)marginal revenue is less than marginal cost.
The profit of a firm is maximized when:
A)marginal revenue is maximum.
B)marginal revenue is greater than marginal cost.
C)marginal revenue is equal to marginal cost.
D)marginal cost is minimum.
E)marginal revenue is less than marginal cost.
Question
The table given below reports the marginal revenue and marginal cost of Holmes Detective Agency for each client.Table 9.2
Assume that a firm is producing an output level such that marginal revenue equals marginal cost. One can correctly conclude that the firm is producing a level of output which is:
A)equal to the profit maximizing level of output.
B)equal to revenue maximizing level of output.
C)less than the profit maximizing level of output.
D)zero.
E)greater than the profit maximizing level of output.
Question
The table given below reports the marginal revenue and marginal cost of Holmes Detective Agency for each client.Table 9.2
A firm enjoys a positive economic profit when:
A)the demand curve touches the average cost curve at the profit-maximizing level of output.
B)the marginal revenue curve has a negative intercept on the ordinate axis.
C)the average revenue curve lies below the average cost curve at the profit-maximizing level of output.
D)the marginal cost is declining at the profit-maximizing level of output.
E)the average revenue curve lies above the average cost curve at the profit-maximizing level of output.
Question
The following graph shows the demand and cost curves of an imperfectly competitive firm. MC and ATC represent the marginal cost curve and the average cost curve respectively.Figure 9.1
According to Figure 9.1, what is the firm's profit when it sells quantity Q1 at price P1?
A)Rectangle ABCD
B)Rectangle DCEF
C)Rectangle ABEF
D)Distance AB
E)Distance FD
According to Figure 9.1, what is the firm's profit when it sells quantity Q1 at price P1?
A)Rectangle ABCD
B)Rectangle DCEF
C)Rectangle ABEF
D)Distance AB
E)Distance FD
Question
The table given below reports the marginal revenue and marginal cost of Holmes Detective Agency for each client.Table 9.2
A producer can raise profit by expanding output if his:
A)marginal revenue is equal to marginal cost.
B)marginal revenue is less than marginal cost.
C)marginal revenue is negative.
D)marginal cost is negative.
E)marginal revenue is greater than marginal cost.
A producer can raise profit by expanding output if his:
A)marginal revenue is equal to marginal cost.
B)marginal revenue is less than marginal cost.
C)marginal revenue is negative.
D)marginal cost is negative.
E)marginal revenue is greater than marginal cost.
Question
The figure given below shows the cost curves of a firm.Figure 9.3
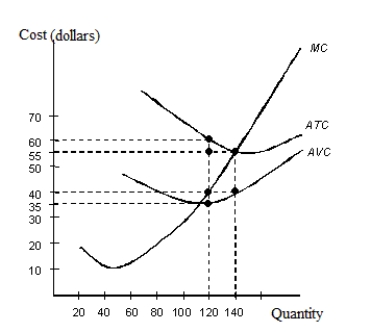 ATC: Average Total Cost
AVC: Average Variable Cost
MC: Marginal Cost
In Figure 9.3, what is the total cost of producing 140 units of the output?
A)$40
B)$55
C)$300
D)$5,600
E)$7,700
ATC: Average Total CostAVC: Average Variable Cost
MC: Marginal Cost
In Figure 9.3, what is the total cost of producing 140 units of the output?
A)$40
B)$55
C)$300
D)$5,600
E)$7,700
Question
The table given below reports the marginal revenue and marginal cost of Holmes Detective Agency for each client.Table 9.2
Suppose that ABC Industries, a perfectly competitive firm, currently produces 500 units of imitation ham spread for a total cost of $1,500. The marginal cost of the 500th unit is $20, and the marginal revenue of the 500th unit is $15. To maximize profits, Cheapo Industries should:
A)continue to produce 500 units.
B)produce more than 500 units but less than 1500 units.
C)produce less than 500 units.
D)produce more than 1500 units.
E)stop producing at 500 units.
Question
The following graph shows the demand and cost curves of an imperfectly competitive firm. MC and ATC represent the marginal cost curve and the average cost curve respectively.Figure 9.1
Refer to Figure 9.1. At price P1 , the firm sells quantity Q1, and total cost is shown by:
A)the rectangle ABCD.
B)the rectangle ABEF.
C)the rectangle FECD.
D)the distance AB.
E)the distance BC.
Refer to Figure 9.1. At price P1 , the firm sells quantity Q1, and total cost is shown by:
A)the rectangle ABCD.
B)the rectangle ABEF.
C)the rectangle FECD.
D)the distance AB.
E)the distance BC.
Question
The following graph shows the marginal revenue (MR) and marginal cost (MC) curves of an imperfectly competitive firm.Figure 9.2
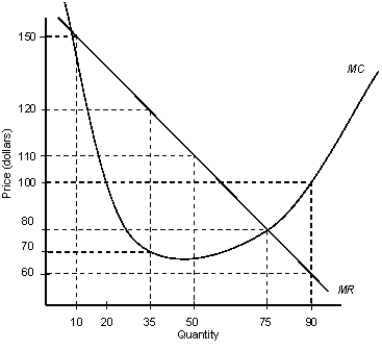
Refer to Figure 9.2. If the current production level is 90 and the firm wishes to maximize profit, it should:
A)continue to produce at the current level.
B)decrease the quantity produced to 75.
C)decrease the quantity produced to 50.
D)decrease the quantity produced to 35.
E)increase production until MR = MC.
Question
The table given below reports the marginal revenue and marginal cost of Holmes Detective Agency for each client.Table 9.2
A profit-maximizing firm will produce the level of output at which:
A)average revenue equals average cost.
B)average revenue equals average variable cost.
C)marginal revenue equals marginal cost.
D)marginal cost equals average revenue.
E)marginal revenue exceeds marginal cost by the maximum amount.
A profit-maximizing firm will produce the level of output at which:
A)average revenue equals average cost.
B)average revenue equals average variable cost.
C)marginal revenue equals marginal cost.
D)marginal cost equals average revenue.
E)marginal revenue exceeds marginal cost by the maximum amount.
Question
The table given below reports the marginal revenue and marginal cost of Holmes Detective Agency for each client.Table 9.2
Graphically, a firm's total revenue is represented by the:
A)triangle formed under the demand curve.
B)rectangle formed under the demand curve at a given price and quantity combination.
C)rectangle formed under the average-total-cost curve at a given ATC and quantity combination.
D)triangle formed by a line segment between the demand and average-total-cost curves at any level of output.
E)triangle formed by a line segment between the horizontal axis and the average-total-cost curves at any level of output.
Question
The following graph shows the marginal revenue (MR) and marginal cost (MC) curves of an imperfectly competitive firm.Figure 9.2
According to Figure 9.2, the firm is maximizing profit at a quantity of _____ units.
A)10
B)35
C)50
D)75
E)90
According to Figure 9.2, the firm is maximizing profit at a quantity of _____ units.
A)10
B)35
C)50
D)75
E)90
Question
The table given below reports the marginal revenue and marginal cost of Holmes Detective Agency for each client.Table 9.2
The addition to a business firm's total costs, that comes from producing one more unit of output, is its:
A)total variable cost.
B)marginal cost.
C)sunk cost.
D)opportunity cost.
E)total fixed cost
The addition to a business firm's total costs, that comes from producing one more unit of output, is its:
A)total variable cost.
B)marginal cost.
C)sunk cost.
D)opportunity cost.
E)total fixed cost
Question
The following graph shows the marginal revenue (MR) and marginal cost (MC) curves of an imperfectly competitive firm.Figure 9.2
Refer to Figure 9.2. At a quantity of 10 units, the firm should _____ , and at a quantity of 75 units, the firm should _____.
A)leave the level of production unchanged; also leave production unchanged
B)leave the level of production unchanged; decrease production
C)increase production; decrease production
D)increase production; leave production unchanged
E)decrease production; increase production
Question
The table given below reports the marginal revenue and marginal cost of Holmes Detective Agency for each client.Table 9.2
Assume that a firm's marginal revenue curve intersects the rising portion of its marginal cost curve at 500 units of output. At this output level, a profit-maximizing firm's total cost of production is $1,000. If the price of the product is $5 per unit, the total revenue earned by the firm will be:
A)$1,500.
B)$250.
C)$500.
D)$2,500.
E)$1,000.
Question
The table given below reports the marginal revenue and marginal cost of Holmes Detective Agency for each client.Table 9.2
If a firm's marginal revenue is greater than its marginal cost, then:
A)each added unit of output will reduce profits.
B)the firm is maximizing profit.
C)an increase in output will add more to revenue than to cost.
D)an increase in output will add more to cost than to revenue.
E)a fall in output will add more to revenue than to cost.
Question
The table given below reports the marginal revenue and marginal cost of Holmes Detective Agency for each client.Table 9.2
Suppose at a certain quantity of output, a firm's average-total-cost curve lies above its demand curve. At this quantity of output, the firm:
A)is earning negative economic profit.
B)is earning zero economic profit.
C)is maximizing profit.
D)should increase its output to maximize profit.
E)should reduce output to maximize negative economic profit.
Question
The table given below reports the marginal revenue and marginal cost of Holmes Detective Agency for each client.Table 9.2
Graphically, a firm's profit per unit of output can be found by:
A)the triangle formed under the demand curve.
B)the rectangle formed under the demand curve at a given price and quantity combination.
C)the rectangle formed under the average-total-cost curve at a given ATC and quantity combination.
D)the distance between the demand and average-total-cost curves at any level of output.
E)the distance between the horizontal axis and the average-total-cost curves at any level of output.
Question
The figure given below shows the revenue and cost curves of a firm. MC represents the marginal cost curve, AC the average cost curve, MR the marginal revenue curve, and AR the average revenue curve.Figure 9.4
The only decision that a perfectly competitive firm makes is:
A)what price to charge.
B)what quantity to produce.
C)how much to spend on advertisements.
D)how much to discriminate on the basis of price.
E)how to differentiate its products from its rivals.
The only decision that a perfectly competitive firm makes is:
A)what price to charge.
B)what quantity to produce.
C)how much to spend on advertisements.
D)how much to discriminate on the basis of price.
E)how to differentiate its products from its rivals.
Question
The figure given below shows the cost curves of a firm.Figure 9.3
ATC: Average Total Cost
AVC: Average Variable Cost
MC: Marginal Cost
In Figure 9.3, if the marginal revenue of the firm is constant at $55, calculate the profit earned by the firm at the profit-maximizing level of output?
A)$35
B)$40
C)$600
D)$4,800
E)$0
ATC: Average Total CostAVC: Average Variable Cost
MC: Marginal Cost
In Figure 9.3, if the marginal revenue of the firm is constant at $55, calculate the profit earned by the firm at the profit-maximizing level of output?
A)$35
B)$40
C)$600
D)$4,800
E)$0
Question
The figure given below shows the revenue and cost curves of a firm. MC represents the marginal cost curve, AC the average cost curve, MR the marginal revenue curve, and AR the average revenue curve.Figure 9.4
Refer to Figure 9.3. The firm suffers a negative profit by producing:
A)100 units.
B)50 units.
C)80 units.
D)150 units.
E)250 units.
Refer to Figure 9.3. The firm suffers a negative profit by producing:
A)100 units.
B)50 units.
C)80 units.
D)150 units.
E)250 units.
Question
The figure given below shows the cost curves of a firm.Figure 9.3
ATC: Average Total Cost
AVC: Average Variable Cost
MC: Marginal Cost
In Figure 9.3, what is the marginal cost at a quantity of 120 units?
A)$35
B)$40
C)$55
D)$60
E)$4,800
ATC: Average Total CostAVC: Average Variable Cost
MC: Marginal Cost
In Figure 9.3, what is the marginal cost at a quantity of 120 units?
A)$35
B)$40
C)$55
D)$60
E)$4,800
Question
The figure given below shows the revenue and cost curves of a firm. MC represents the marginal cost curve, AC the average cost curve, MR the marginal revenue curve, and AR the average revenue curve.Figure 9.4
In a perfectly competitive industry, the price of good A is $2. If a firm in this industry decides to increase its price to $2.50, it will:
A)realize an increase in profit of $0.50 per unit output.
B)be able to increase the quantity sold of good A.
C)be unable to sell any quantity of good A that is produced.
D)lose some of its customers in the market.
E)experience a decrease in profit of $0.50 per unit output.
Question
The figure given below shows the revenue and cost curves of a firm. MC represents the marginal cost curve, AC the average cost curve, MR the marginal revenue curve, and AR the average revenue curve.Figure 9.4
Steve is about to start up a business in a monopolistically competitive market. Which of the following can he expect?
A)He can expect market entry to be difficult as there exist entry barriers.
B)He can expect to enjoy a huge amount of market power.
C)He can expect to face a highly inelastic demand curve.
D)He can expect to find close substitutes of the product he is planning to produce.
E)He can expect to face an infinitely elastic demand curve.
Question
The figure given below shows the revenue and cost curves of a firm. MC represents the marginal cost curve, AC the average cost curve, MR the marginal revenue curve, and AR the average revenue curve.Figure 9.4
An industry which has no barriers to entry, no product-promotion strategy, a standardized product, and a very large number of firms operating within it, is said to have:
A)a monopoly market structure.
B)perfect competition.
C)monopsonistic competition.
D)monopolistic competition.
E)an oligopoly market structure.
Question
The figure given below shows the revenue and cost curves of a firm. MC represents the marginal cost curve, AC the average cost curve, MR the marginal revenue curve, and AR the average revenue curve.Figure 9.4
Identify the characteristics of a monopoly firm.
A)The existence of barriers to entry and production of a homogeneous product
B)The production of a unique product and a large number of sellers in the market
C)The production of a standardized product and the firm is a price taker
D)The existence of barriers to entry and the firm is a price taker
E)The existence of barriers to entry and the firm is a price maker
Question
The figure given below shows the revenue and cost curves of a firm. MC represents the marginal cost curve, AC the average cost curve, MR the marginal revenue curve, and AR the average revenue curve.Figure 9.4
The ordering of market structures from most market power to least market power (where market power is the ability to set its own price) is:
A)monopoly, monopolistic competition, oligopoly, perfect competition.
B)perfect competition, monopolistic competition, oligopoly, monopoly.
C)oligopoly, monopoly, monopolistic competition, perfect competition.
D)monopoly, oligopoly, monopolistic competition, perfect competition.
E)monopoly, perfect competition, monopolistic competition, oligopoly.
Question
The figure given below shows the revenue and cost curves of a firm. MC represents the marginal cost curve, AC the average cost curve, MR the marginal revenue curve, and AR the average revenue curve.Figure 9.4
Refer to Figure 9.3. The profit-maximizing level of output is:
A)80 units.
B)70 units.
C)60 units.
D)50 units.
E)40 units.
Refer to Figure 9.3. The profit-maximizing level of output is:
A)80 units.
B)70 units.
C)60 units.
D)50 units.
E)40 units.
Question
The figure given below shows the cost curves of a firm.Figure 9.3
ATC: Average Total Cost
AVC: Average Variable Cost
MC: Marginal Cost
Refer to Figure 9.3. If the firm maximizes its profit at 120 units of the output, calculate the firm's marginal revenue.
A)$35
B)$40
C)$55
D)$4,200
E)Cannot be determined from the information given.
ATC: Average Total CostAVC: Average Variable Cost
MC: Marginal Cost
Refer to Figure 9.3. If the firm maximizes its profit at 120 units of the output, calculate the firm's marginal revenue.
A)$35
B)$40
C)$55
D)$4,200
E)Cannot be determined from the information given.
Question
The figure given below shows the revenue and cost curves of a firm. MC represents the marginal cost curve, AC the average cost curve, MR the marginal revenue curve, and AR the average revenue curve.Figure 9.4
Which of the following is not true of monopolistic competition?
A)There are a large number of buyers and sellers.
B)The firms produce differentiated products.
C)There exists free entry and exit of firms.
D)Each of the firms faces a horizontal demand curve.
E)Each of the firms acts as a mini monopoly in the market.
Question
The figure given below shows the revenue and cost curves of a firm. MC represents the marginal cost curve, AC the average cost curve, MR the marginal revenue curve, and AR the average revenue curve.Figure 9.4
Firms under perfect competition produce:
A)homogeneous products.
B)unique products.
C)either standardized or differentiated products.
D)differentiated products.
E)antique products.
Firms under perfect competition produce:
A)homogeneous products.
B)unique products.
C)either standardized or differentiated products.
D)differentiated products.
E)antique products.
Question
The figure given below shows the revenue and cost curves of a firm. MC represents the marginal cost curve, AC the average cost curve, MR the marginal revenue curve, and AR the average revenue curve.Figure 9.4
A(n) ____ is a price taker.
A)monopoly firm
B)oligopoly firm
C)perfectly competitive firm
D)monopolistically competitive firm
E)duopoly firm
A(n) ____ is a price taker.
A)monopoly firm
B)oligopoly firm
C)perfectly competitive firm
D)monopolistically competitive firm
E)duopoly firm
Question
The figure given below shows the revenue and cost curves of a firm. MC represents the marginal cost curve, AC the average cost curve, MR the marginal revenue curve, and AR the average revenue curve.Figure 9.4
In general, the two extreme cases of market structure models are represented by:
A)monopolistic competition and oligopoly.
B)oligopoly and monopoly.
C)oligopoly and perfect competition.
D)perfect competition and monopoly.
E)perfect monopoly and oligopolistic competition.
In general, the two extreme cases of market structure models are represented by:
A)monopolistic competition and oligopoly.
B)oligopoly and monopoly.
C)oligopoly and perfect competition.
D)perfect competition and monopoly.
E)perfect monopoly and oligopolistic competition.
Question
The figure given below shows the revenue and cost curves of a firm. MC represents the marginal cost curve, AC the average cost curve, MR the marginal revenue curve, and AR the average revenue curve.Figure 9.4
Monopoly is a market structure in which:
A)there are significant barriers to the entry of new firms.
B)the firms face a perfectly elastic demand curve.
C)there are a large number of close substitutes for the good produced.
D)a homogeneous product is sold.
E)the firms are price takers.
Monopoly is a market structure in which:
A)there are significant barriers to the entry of new firms.
B)the firms face a perfectly elastic demand curve.
C)there are a large number of close substitutes for the good produced.
D)a homogeneous product is sold.
E)the firms are price takers.
Question
The figure given below shows the revenue and cost curves of a firm. MC represents the marginal cost curve, AC the average cost curve, MR the marginal revenue curve, and AR the average revenue curve.Figure 9.4
If barriers to entry exist in the market for a product, then:
A)the costs of entry and exit are relatively low.
B)there will be few close substitutes of the product in the market.
C)firms will be incurring losses in both the short run and the long run.
D)firms will tend to have relatively less monopoly power.
E)the existing firms will quit the market in the long run due to mounting losses.
Question
The figure given below shows the revenue and cost curves of a firm. MC represents the marginal cost curve, AC the average cost curve, MR the marginal revenue curve, and AR the average revenue curve.Figure 9.4
Why does a monopolist face the market demand curve?
A)Presence of a large number of substitutes
B)Presence of a large number of buyers in the market
C)Barred entry of any new firm in the market
D)Produces a homogeneous product
E)Consumers have perfect knowledge of the market
Why does a monopolist face the market demand curve?
A)Presence of a large number of substitutes
B)Presence of a large number of buyers in the market
C)Barred entry of any new firm in the market
D)Produces a homogeneous product
E)Consumers have perfect knowledge of the market
Question
The figure given below shows the revenue and cost curves of a firm. MC represents the marginal cost curve, AC the average cost curve, MR the marginal revenue curve, and AR the average revenue curve.Figure 9.4
Which among the following does not determine the shape of the demand curve for a good under different market structures?
A)Number of substitutes in the market
B)Importance of the good in a consumer's budget
C)Cost structure of the firm
D)Price-elasticity of demand
E)The length of time being considered
Question
The figure given below shows the revenue and cost curves of a firm. MC represents the marginal cost curve, AC the average cost curve, MR the marginal revenue curve, and AR the average revenue curve.Figure 9.4
Under perfect competition, at the profit-maximizing level of output:
A)price is greater than marginal revenue.
B)price is equal to marginal revenue.
C)marginal revenue is equal to zero.
D)the marginal revenue curve is upward sloping.
E)the average revenue curve is upward sloping.
Under perfect competition, at the profit-maximizing level of output:
A)price is greater than marginal revenue.
B)price is equal to marginal revenue.
C)marginal revenue is equal to zero.
D)the marginal revenue curve is upward sloping.
E)the average revenue curve is upward sloping.
Question
The following figure shows the cost and revenue structures of a firm. MC represents the marginal cost curve, AC represents the average cost curve, AR represents the average revenue curve, and MR represents the marginal revenue curve. P* is the equilibrium price and Q* is the equilibrium output.Figure 9.5
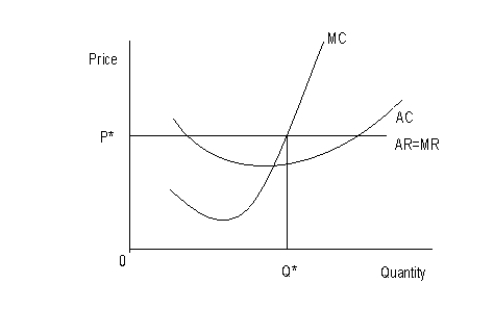
Refer to Figure 9.5. Identify the market structure in which the firm operates.
A)Perfect competition
B)Monopolistic competition
C)Monopoly
D)Monopsony
E)Duopoly
Refer to Figure 9.5. Identify the market structure in which the firm operates.
A)Perfect competition
B)Monopolistic competition
C)Monopoly
D)Monopsony
E)Duopoly
Question
The following table shows the annual income statement of Max Computers.Table 9.3
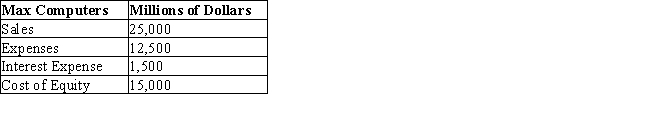
Refer to the Table 9.3. The net income of Max Computers is:
A)$10,000 million.
B)$25,000 million.
C)$11,000 million.
D)$13,000 million.
E)$12,500 million.
Refer to the Table 9.3. The net income of Max Computers is:
A)$10,000 million.
B)$25,000 million.
C)$11,000 million.
D)$13,000 million.
E)$12,500 million.
Question
Question
Question
The following figure shows the cost and revenue structures of a firm. MC represents the marginal cost curve, AC represents the average cost curve, AR represents the average revenue curve, and MR represents the marginal revenue curve. P* is the equilibrium price and Q* is the equilibrium output.Figure 9.5
Suppose Mark invests a sum of $100,000 in a new venture. To fund his investment, Mark withdraws $50,000 from a savings account paying 10% per year and uses the proceeds from a bond that has just matured worth $50,000. If he had reinvested the proceeds from the bond, he could have earned interest at the rate of 5%. Calculate the opportunity cost of capital for Mark in a particular year.
A)$5,000
B)$7,500
C)$10,000
D)$12,500
E)$100,000
Question
The figure given below shows the revenue and cost curves of a firm. MC represents the marginal cost curve, AC the average cost curve, MR the marginal revenue curve, and AR the average revenue curve.Figure 9.4
A downward-sloping demand curve is faced by firms:
A)under perfect competition.
B)under perfect competition and monopoly.
C)in all market structures except monopoly.
D)in all market structures except monopolistic competition.
E)in all market structures except perfect competition.
A downward-sloping demand curve is faced by firms:
A)under perfect competition.
B)under perfect competition and monopoly.
C)in all market structures except monopoly.
D)in all market structures except monopolistic competition.
E)in all market structures except perfect competition.
Question
The following figure shows the cost and revenue structures of a firm. MC represents the marginal cost curve, AC represents the average cost curve, AR represents the average revenue curve, and MR represents the marginal revenue curve. P* is the equilibrium price and Q* is the equilibrium output.Figure 9.5
A firm's accounting profit does not include its:
A)explicit costs.
B)sunk costs.
C)fixed costs.
D)opportunity costs.
E)variable costs.
A firm's accounting profit does not include its:
A)explicit costs.
B)sunk costs.
C)fixed costs.
D)opportunity costs.
E)variable costs.
Question
Question
The figure given below shows the revenue and cost curves of a firm. MC represents the marginal cost curve, AC the average cost curve, MR the marginal revenue curve, and AR the average revenue curve.Figure 9.4
Under imperfect competition, a firm's:
A)demand curve lies below its marginal revenue curve.
B)demand curve lies above its marginal revenue curve.
C)demand curve coincides with its marginal revenue curve.
D)demand curve coincides with its marginal cost curve.
E)demand curve coincides with its average cost curve.
Question
The following figure shows the cost and revenue structures of a firm. MC represents the marginal cost curve, AC represents the average cost curve, AR represents the average revenue curve, and MR represents the marginal revenue curve. P* is the equilibrium price and Q* is the equilibrium output.Figure 9.5
The opportunity cost of capital is:
A)the cost of labor inputs required to operate that capital.
B)the cost of raw materials necessary to put that capital to work.
C)the payment necessary to keep that capital from moving to an alternative use.
D)the costs of maintenance necessary to keep that capital operating.
E)the cost of hiring more units of capital to generate additional units of output.
Question
Question
The figure given below shows the revenue and cost curves of a firm. MC represents the marginal cost curve, AC the average cost curve, MR the marginal revenue curve, and AR the average revenue curve.Figure 9.4
The characteristic that distinguishes a monopolistically competitive market from a perfectly competitive market is the:
A)ease of entry.
B)number of firms operating in the market.
C)degree of government regulation in the activities of the firms.
D)differentiation of products.
E)extent of market share of each firm.
Question
The figure given below shows the revenue and cost curves of a firm. MC represents the marginal cost curve, AC the average cost curve, MR the marginal revenue curve, and AR the average revenue curve.Figure 9.4
The demand curve faced by a perfectly competitive firm is:
A)perfectly inelastic.
B)relatively elastic.
C)unit elastic.
D)perfectly elastic.
E)relatively inelastic.
The demand curve faced by a perfectly competitive firm is:
A)perfectly inelastic.
B)relatively elastic.
C)unit elastic.
D)perfectly elastic.
E)relatively inelastic.
Question
Question
The figure given below shows the revenue and cost curves of a firm. MC represents the marginal cost curve, AC the average cost curve, MR the marginal revenue curve, and AR the average revenue curve.Figure 9.4
Which of the following characteristics distinguishes oligopoly from other market structures?
A)Firms operating in an oligopoly are independent of each other.
B)Firms operating in an oligopoly are interdependent.
C)Oligopoly is the simplest of all the other market structures.
D)An oligopolist does not face a downward-sloping demand curve.
E)Entry into an oligopolistic market is easier than entry into a monopolistically competitive market.
Question
The figure given below shows the revenue and cost curves of a firm. MC represents the marginal cost curve, AC the average cost curve, MR the marginal revenue curve, and AR the average revenue curve.Figure 9.4
A monopolistically competitive firm faces a relatively-elastic demand curve as compared to a monopolist firm because of the:
A)presence of a large number of buyers and barriers to entry.
B)presence of a large number of firms and easy entry into the market.
C)production of perfectly homogeneous products.
D)production of unique products and the presence of barriers to entry.
E)production of goods that are perfect complements of each other.
Question
The following figure shows the cost and revenue structures of a firm. MC represents the marginal cost curve, AC represents the average cost curve, AR represents the average revenue curve, and MR represents the marginal revenue curve. P* is the equilibrium price and Q* is the equilibrium output.Figure 9.5
The accounting profit of a business firm is also called:
A)royalty income.
B)net income from equity.
C)compensatory income.
D)windfall gain.
E)net operating income.
The accounting profit of a business firm is also called:
A)royalty income.
B)net income from equity.
C)compensatory income.
D)windfall gain.
E)net operating income.
Question
The figure given below shows the revenue and cost curves of a firm. MC represents the marginal cost curve, AC the average cost curve, MR the marginal revenue curve, and AR the average revenue curve.Figure 9.4
In contrast to both perfect competition and monopolistic competition, an oligopoly market structure is characterized by:
A)price discrimination.
B)a perfectly inelastic demand curve.
C)the presence of infinite number of firms.
D)the production of only differentiated products.
E)difficulty in the entry of new firms.
Question
The figure given below shows the revenue and cost curves of a firm. MC represents the marginal cost curve, AC the average cost curve, MR the marginal revenue curve, and AR the average revenue curve.Figure 9.4
A(n) ____ may offer products that are either differentiated or identical.
A)monopolistically competitive firm
B)monopolist
C)oligopolistic firm
D)perfectly competitive firm
E)monopsonist
A(n) ____ may offer products that are either differentiated or identical.
A)monopolistically competitive firm
B)monopolist
C)oligopolistic firm
D)perfectly competitive firm
E)monopsonist
Question
The figure given below shows the revenue and cost curves of a firm. MC represents the marginal cost curve, AC the average cost curve, MR the marginal revenue curve, and AR the average revenue curve.Figure 9.4
A monopolist faces the least price-elastic demand curve because:
A)the consumers have only one place to buy the good.
B)the monopolist produces a standardized product.
C)the monopolist undertakes a huge expenditure to produce the product.
D)the monopolist supplies to an insignificant portion of the market.
E)the monopolist produces an absolutely necessary good having close substitutes.

Unlock Deck
Sign up to unlock the cards in this deck!
Unlock Deck
Unlock Deck
1/121
Play
Full screen (f)
Deck 9: Profit Maximization
1
The table given below reports the marginal revenue and marginal cost of Holmes Detective Agency for each client.Table 9.2
The MR schedule can be obtained from the TR schedule by:
A)adding two successive values in the TR schedule.
B)subtracting the succeeding TR value from the preceding TR value.
C)subtracting the preceding TR value from the succeeding TR value.
D)multiplying two successive TR values.
E)dividing the succeeding TR value by the preceding TR value.
subtracting the preceding TR value from the succeeding TR value.
2
The figure given below shows three Short Run Average Total Cost (SRATC) curves and the Long Run Average Total Cost (LRATC) curve of a firm.Figure 8.3
Profit is the difference between:
A)total output and total costs.
B)total revenue and total costs.
C)total revenue and total sunk costs.
D)total output and total sunk costs.
E)total revenue and opportunity costs.
Profit is the difference between:
A)total output and total costs.
B)total revenue and total costs.
C)total revenue and total sunk costs.
D)total output and total sunk costs.
E)total revenue and opportunity costs.
total revenue and total costs.
3
The table given below reports the marginal revenue and marginal cost of Holmes Detective Agency for each client.Table 9.2
Marginal revenue of nth unit of output is:
A)total revenue of (n+1)th unit minus total revenue of nth unit.
B)total revenue of nth unit minus total revenue of (n-1)th unit.
C)total revenue of (n+1)th unit minus total revenue of (n-1)th unit.
D)the sum of total revenue of (n+1)th unit and nth unit.
E)the sum of total revenue of (n+1)th unit and (n-1)th unit.
total revenue of nth unit minus total revenue of (n-1)th unit.
4
The table given below reports the marginal revenue and marginal cost of Holmes Detective Agency for each client.Table 9.2
Assume that a firm's marginal revenue curve intersects the rising portion of the marginal cost curve at 100 units of output. At this output level, a profit-maximizing firm's total cost is $1,000. If the price of the product is $10 per unit, the firm will earn an economic profit of:
A)zero.
B)$400.
C)more than zero but less than $100.
D)$100.
E)more than $100.
Unlock Deck
Unlock for access to all 121 flashcards in this deck.
Unlock Deck
k this deck
5
The table given below reports the marginal revenue and marginal cost of Holmes Detective Agency for each client.Table 9.2
According to Table 9.2, what will be the total number of clients that will maximize profits for the Holmes Detective Agency?
A)2
B)3
C)5
D)6
E)8
According to Table 9.2, what will be the total number of clients that will maximize profits for the Holmes Detective Agency?
A)2
B)3
C)5
D)6
E)8
Unlock Deck
Unlock for access to all 121 flashcards in this deck.
Unlock Deck
k this deck
6
The table given below shows the total revenue and total cost of producing a commodity.Table 9.1
In Table 9.1, marginal revenue exceeds marginal cost:
A)until the fifth unit of output.
B)until the sixth unit of output.
C)up to the seventh unit of output.
D)up to the eighth unit of output.
E)at all units of output.
In Table 9.1, marginal revenue exceeds marginal cost:
A)until the fifth unit of output.
B)until the sixth unit of output.
C)up to the seventh unit of output.
D)up to the eighth unit of output.
E)at all units of output.
Unlock Deck
Unlock for access to all 121 flashcards in this deck.
Unlock Deck
k this deck
7
The figure given below shows three Short Run Average Total Cost (SRATC) curves and the Long Run Average Total Cost (LRATC) curve of a firm.Figure 8.3
A firm wishing to maximize profits will produce at the level of output where:
A)marginal cost is equal to zero.
B)its total cost curve intersects its total revenue curve.
C)its costs are at a minimum.
D)total revenue exceeds total cost by the largest amount.
E)marginal revenue exceeds marginal cost by the greatest amount.
Unlock Deck
Unlock for access to all 121 flashcards in this deck.
Unlock Deck
k this deck
8
The figure given below shows three Short Run Average Total Cost (SRATC) curves and the Long Run Average Total Cost (LRATC) curve of a firm.Figure 8.3
In economic theory, we assume that the goal of the firm is to:
A)maximize sales revenue.
B)maximize market share.
C)maximize the benefits it provides to its customers.
D)maximize the profit.
E)maximize the sales volume.
In economic theory, we assume that the goal of the firm is to:
A)maximize sales revenue.
B)maximize market share.
C)maximize the benefits it provides to its customers.
D)maximize the profit.
E)maximize the sales volume.
Unlock Deck
Unlock for access to all 121 flashcards in this deck.
Unlock Deck
k this deck
9
The table given below reports the marginal revenue and marginal cost of Holmes Detective Agency for each client.Table 9.2
Assume that a firm's marginal revenue curve intersects the rising portion of the marginal cost curve at 100 units of output. At this output level, the profit-maximizing firm's total fixed cost is $600 and its total variable cost is $400. If the price of the product is $8 per unit, the firm should produce:
A)zero units of output.
B)less than 100 units of output.
C)100 units of output.
D)more than 100 units of output.
E)200 units of the output.
Unlock Deck
Unlock for access to all 121 flashcards in this deck.
Unlock Deck
k this deck
10
The table given below shows the total revenue and total cost of producing a commodity.Table 9.1
In Table 9.1, if the firm produces five units of output, it makes a profit of _____.
A)$3,000
B)$0
C)$800
D)$1,200
E)$1,000
In Table 9.1, if the firm produces five units of output, it makes a profit of _____.
A)$3,000
B)$0
C)$800
D)$1,200
E)$1,000
Unlock Deck
Unlock for access to all 121 flashcards in this deck.
Unlock Deck
k this deck
11
The table given below reports the marginal revenue and marginal cost of Holmes Detective Agency for each client.Table 9.2
Which of the following is true of marginal revenue?
A)Marginal revenue equals total revenue divided by quantity.
B)Marginal revenue is the slope of the supply curve of a firm.
C)Marginal revenue is the slope of the total cost curve when profit is maximized.
D)Marginal revenue equals the change in total revenue due to an additional unit of output.
E)Marginal revenue equals the income earned by selling stocks on the margin.
Unlock Deck
Unlock for access to all 121 flashcards in this deck.
Unlock Deck
k this deck
12
The figure given below shows three Short Run Average Total Cost (SRATC) curves and the Long Run Average Total Cost (LRATC) curve of a firm.Figure 8.3
Suppose that at a given level of output, a perfectly competitive firm charges a price of $12 and has average total costs of $10. If its economic profit is $20,000, then it must be producing:
A)40,000 units of output.
B)20,000 units of output.
C)30,000 units of output.
D)10,000 units of output.
E)50,000 units of output.
Unlock Deck
Unlock for access to all 121 flashcards in this deck.
Unlock Deck
k this deck
13
The table given below reports the marginal revenue and marginal cost of Holmes Detective Agency for each client.Table 9.2
Refer to Table 9.2. If we assume that Holmes is currently serving 8 clients, then Holmes Agency:
A)is maximizing profit.
B)should find more clients to increase profits.
C)is maximizing total revenue.
D)could increase profits by serving less clients.
E)is minimizing cost.
Refer to Table 9.2. If we assume that Holmes is currently serving 8 clients, then Holmes Agency:
A)is maximizing profit.
B)should find more clients to increase profits.
C)is maximizing total revenue.
D)could increase profits by serving less clients.
E)is minimizing cost.
Unlock Deck
Unlock for access to all 121 flashcards in this deck.
Unlock Deck
k this deck
14
The table given below shows the total revenue and total cost of producing a commodity.Table 9.1
In Table 9.1, the marginal revenue from the sixth unit of output is:
A)$1,700.
B)$1,600.
C)$1,500.
D)$1,300.
E)$1,200.
In Table 9.1, the marginal revenue from the sixth unit of output is:
A)$1,700.
B)$1,600.
C)$1,500.
D)$1,300.
E)$1,200.
Unlock Deck
Unlock for access to all 121 flashcards in this deck.
Unlock Deck
k this deck
15
The figure given below shows three Short Run Average Total Cost (SRATC) curves and the Long Run Average Total Cost (LRATC) curve of a firm.Figure 8.3
Assume that a firm's marginal revenue curve intersects the rising portion of the marginal cost curve at 100 units of output. At this output level, a profit-maximizing firm's total cost is $1,000. If the price of the product is $3 per unit and the firm produces at the profit-maximizing level, the firm will earn an economic profit equal to:
A)-$1,000.
B)-$700.
C)-$400.
D)-$600.
E)$200.
Unlock Deck
Unlock for access to all 121 flashcards in this deck.
Unlock Deck
k this deck
16
The table given below shows the total revenue and total cost of producing a commodity.Table 9.1
In Table 9.1, in order to maximize profits, the firm should produce ____ units of output.
A)five
B)six
C)seven
D)eight
E)nine
In Table 9.1, in order to maximize profits, the firm should produce ____ units of output.
A)five
B)six
C)seven
D)eight
E)nine
Unlock Deck
Unlock for access to all 121 flashcards in this deck.
Unlock Deck
k this deck
17
The table given below shows the total revenue and total cost of producing a commodity.Table 9.1
In Table 9.1, the marginal cost of producing the sixth unit of output is equal to _____.
A)$700
B)$600
C)$500
D)$300
E)$200
In Table 9.1, the marginal cost of producing the sixth unit of output is equal to _____.
A)$700
B)$600
C)$500
D)$300
E)$200
Unlock Deck
Unlock for access to all 121 flashcards in this deck.
Unlock Deck
k this deck
18
The table given below reports the marginal revenue and marginal cost of Holmes Detective Agency for each client.Table 9.2
Goodspeed Automobiles manufactures 100 disc brake cylinders. At this output level, its marginal revenue is equal to its marginal cost. If the revenue per unit of output is $500 and the per unit cost is $350, its profit is:
A)$20,000.
B)$15,000.
C)$45,000.
D)$25,000.
E)$10,000.
Goodspeed Automobiles manufactures 100 disc brake cylinders. At this output level, its marginal revenue is equal to its marginal cost. If the revenue per unit of output is $500 and the per unit cost is $350, its profit is:
A)$20,000.
B)$15,000.
C)$45,000.
D)$25,000.
E)$10,000.
Unlock Deck
Unlock for access to all 121 flashcards in this deck.
Unlock Deck
k this deck
19
The table given below reports the marginal revenue and marginal cost of Holmes Detective Agency for each client.Table 9.2
In Table 9.2, assume that Holmes's total fixed cost is zero. Compute the profit earned by the agency with two clients.
A)-$110
B)$110
C)$120
D)-$10
E)$10
In Table 9.2, assume that Holmes's total fixed cost is zero. Compute the profit earned by the agency with two clients.
A)-$110
B)$110
C)$120
D)-$10
E)$10
Unlock Deck
Unlock for access to all 121 flashcards in this deck.
Unlock Deck
k this deck
20
The table given below reports the marginal revenue and marginal cost of Holmes Detective Agency for each client.Table 9.2
Which of the following is true of marginal cost?
A)Marginal cost is the cost per unit of output produced.
B)Marginal cost is the change in total cost divided by the change in total output.
C)Marginal cost curve is negatively sloped at the profit-maximizing level of output.
D)Marginal cost is equal to total cost divided by the quantity of output.
E)Marginal cost initially increases with an increase in output but subsequently declines.
Unlock Deck
Unlock for access to all 121 flashcards in this deck.
Unlock Deck
k this deck
21
The following graph shows the demand and cost curves of an imperfectly competitive firm. MC and ATC represent the marginal cost curve and the average cost curve respectively.Figure 9.1
Refer to Figure 9.1. At price P1, the firm sells quantity Q1, and total revenue is shown by:
A)the rectangle ABCD.
B)the rectangle ABEF.
C)the rectangle FECD.
D)the distance AB.
E)the distance BC.
Refer to Figure 9.1. At price P1, the firm sells quantity Q1, and total revenue is shown by:
A)the rectangle ABCD.
B)the rectangle ABEF.
C)the rectangle FECD.
D)the distance AB.
E)the distance BC.
Unlock Deck
Unlock for access to all 121 flashcards in this deck.
Unlock Deck
k this deck
22
The table given below reports the marginal revenue and marginal cost of Holmes Detective Agency for each client.Table 9.2
Graphically, a firm's total cost is equal to the area of the:
A)triangle formed under the demand curve.
B)rectangle formed under the demand curve at a given price and quantity combination.
C)rectangle formed under the average-total-cost curve at a given ATC and quantity combination.
D)triangle formed by a line segment between the demand and average-total-cost curves.
E)triangle formed by a line segment between the horizontal axis and the average-total-cost curves.
Unlock Deck
Unlock for access to all 121 flashcards in this deck.
Unlock Deck
k this deck
23
The table given below reports the marginal revenue and marginal cost of Holmes Detective Agency for each client.Table 9.2
The profit of a firm is maximized when:
A)marginal revenue is maximum.
B)marginal revenue is greater than marginal cost.
C)marginal revenue is equal to marginal cost.
D)marginal cost is minimum.
E)marginal revenue is less than marginal cost.
The profit of a firm is maximized when:
A)marginal revenue is maximum.
B)marginal revenue is greater than marginal cost.
C)marginal revenue is equal to marginal cost.
D)marginal cost is minimum.
E)marginal revenue is less than marginal cost.
Unlock Deck
Unlock for access to all 121 flashcards in this deck.
Unlock Deck
k this deck
24
The table given below reports the marginal revenue and marginal cost of Holmes Detective Agency for each client.Table 9.2
Assume that a firm is producing an output level such that marginal revenue equals marginal cost. One can correctly conclude that the firm is producing a level of output which is:
A)equal to the profit maximizing level of output.
B)equal to revenue maximizing level of output.
C)less than the profit maximizing level of output.
D)zero.
E)greater than the profit maximizing level of output.
Unlock Deck
Unlock for access to all 121 flashcards in this deck.
Unlock Deck
k this deck
25
The table given below reports the marginal revenue and marginal cost of Holmes Detective Agency for each client.Table 9.2
A firm enjoys a positive economic profit when:
A)the demand curve touches the average cost curve at the profit-maximizing level of output.
B)the marginal revenue curve has a negative intercept on the ordinate axis.
C)the average revenue curve lies below the average cost curve at the profit-maximizing level of output.
D)the marginal cost is declining at the profit-maximizing level of output.
E)the average revenue curve lies above the average cost curve at the profit-maximizing level of output.
Unlock Deck
Unlock for access to all 121 flashcards in this deck.
Unlock Deck
k this deck
26
The following graph shows the demand and cost curves of an imperfectly competitive firm. MC and ATC represent the marginal cost curve and the average cost curve respectively.Figure 9.1
According to Figure 9.1, what is the firm's profit when it sells quantity Q1 at price P1?
A)Rectangle ABCD
B)Rectangle DCEF
C)Rectangle ABEF
D)Distance AB
E)Distance FD
According to Figure 9.1, what is the firm's profit when it sells quantity Q1 at price P1?
A)Rectangle ABCD
B)Rectangle DCEF
C)Rectangle ABEF
D)Distance AB
E)Distance FD
Unlock Deck
Unlock for access to all 121 flashcards in this deck.
Unlock Deck
k this deck
27
The table given below reports the marginal revenue and marginal cost of Holmes Detective Agency for each client.Table 9.2
A producer can raise profit by expanding output if his:
A)marginal revenue is equal to marginal cost.
B)marginal revenue is less than marginal cost.
C)marginal revenue is negative.
D)marginal cost is negative.
E)marginal revenue is greater than marginal cost.
A producer can raise profit by expanding output if his:
A)marginal revenue is equal to marginal cost.
B)marginal revenue is less than marginal cost.
C)marginal revenue is negative.
D)marginal cost is negative.
E)marginal revenue is greater than marginal cost.
Unlock Deck
Unlock for access to all 121 flashcards in this deck.
Unlock Deck
k this deck
28
The figure given below shows the cost curves of a firm.Figure 9.3
ATC: Average Total Cost
AVC: Average Variable Cost
MC: Marginal Cost
In Figure 9.3, what is the total cost of producing 140 units of the output?
A)$40
B)$55
C)$300
D)$5,600
E)$7,700
ATC: Average Total CostAVC: Average Variable Cost
MC: Marginal Cost
In Figure 9.3, what is the total cost of producing 140 units of the output?
A)$40
B)$55
C)$300
D)$5,600
E)$7,700
Unlock Deck
Unlock for access to all 121 flashcards in this deck.
Unlock Deck
k this deck
29
The table given below reports the marginal revenue and marginal cost of Holmes Detective Agency for each client.Table 9.2
Suppose that ABC Industries, a perfectly competitive firm, currently produces 500 units of imitation ham spread for a total cost of $1,500. The marginal cost of the 500th unit is $20, and the marginal revenue of the 500th unit is $15. To maximize profits, Cheapo Industries should:
A)continue to produce 500 units.
B)produce more than 500 units but less than 1500 units.
C)produce less than 500 units.
D)produce more than 1500 units.
E)stop producing at 500 units.
Unlock Deck
Unlock for access to all 121 flashcards in this deck.
Unlock Deck
k this deck
30
The following graph shows the demand and cost curves of an imperfectly competitive firm. MC and ATC represent the marginal cost curve and the average cost curve respectively.Figure 9.1
Refer to Figure 9.1. At price P1 , the firm sells quantity Q1, and total cost is shown by:
A)the rectangle ABCD.
B)the rectangle ABEF.
C)the rectangle FECD.
D)the distance AB.
E)the distance BC.
Refer to Figure 9.1. At price P1 , the firm sells quantity Q1, and total cost is shown by:
A)the rectangle ABCD.
B)the rectangle ABEF.
C)the rectangle FECD.
D)the distance AB.
E)the distance BC.
Unlock Deck
Unlock for access to all 121 flashcards in this deck.
Unlock Deck
k this deck
31
The following graph shows the marginal revenue (MR) and marginal cost (MC) curves of an imperfectly competitive firm.Figure 9.2
Refer to Figure 9.2. If the current production level is 90 and the firm wishes to maximize profit, it should:
A)continue to produce at the current level.
B)decrease the quantity produced to 75.
C)decrease the quantity produced to 50.
D)decrease the quantity produced to 35.
E)increase production until MR = MC.
Unlock Deck
Unlock for access to all 121 flashcards in this deck.
Unlock Deck
k this deck
32
The table given below reports the marginal revenue and marginal cost of Holmes Detective Agency for each client.Table 9.2
A profit-maximizing firm will produce the level of output at which:
A)average revenue equals average cost.
B)average revenue equals average variable cost.
C)marginal revenue equals marginal cost.
D)marginal cost equals average revenue.
E)marginal revenue exceeds marginal cost by the maximum amount.
A profit-maximizing firm will produce the level of output at which:
A)average revenue equals average cost.
B)average revenue equals average variable cost.
C)marginal revenue equals marginal cost.
D)marginal cost equals average revenue.
E)marginal revenue exceeds marginal cost by the maximum amount.
Unlock Deck
Unlock for access to all 121 flashcards in this deck.
Unlock Deck
k this deck
33
The table given below reports the marginal revenue and marginal cost of Holmes Detective Agency for each client.Table 9.2
Graphically, a firm's total revenue is represented by the:
A)triangle formed under the demand curve.
B)rectangle formed under the demand curve at a given price and quantity combination.
C)rectangle formed under the average-total-cost curve at a given ATC and quantity combination.
D)triangle formed by a line segment between the demand and average-total-cost curves at any level of output.
E)triangle formed by a line segment between the horizontal axis and the average-total-cost curves at any level of output.
Unlock Deck
Unlock for access to all 121 flashcards in this deck.
Unlock Deck
k this deck
34
The following graph shows the marginal revenue (MR) and marginal cost (MC) curves of an imperfectly competitive firm.Figure 9.2
According to Figure 9.2, the firm is maximizing profit at a quantity of _____ units.
A)10
B)35
C)50
D)75
E)90
According to Figure 9.2, the firm is maximizing profit at a quantity of _____ units.
A)10
B)35
C)50
D)75
E)90
Unlock Deck
Unlock for access to all 121 flashcards in this deck.
Unlock Deck
k this deck
35
The table given below reports the marginal revenue and marginal cost of Holmes Detective Agency for each client.Table 9.2
The addition to a business firm's total costs, that comes from producing one more unit of output, is its:
A)total variable cost.
B)marginal cost.
C)sunk cost.
D)opportunity cost.
E)total fixed cost
The addition to a business firm's total costs, that comes from producing one more unit of output, is its:
A)total variable cost.
B)marginal cost.
C)sunk cost.
D)opportunity cost.
E)total fixed cost
Unlock Deck
Unlock for access to all 121 flashcards in this deck.
Unlock Deck
k this deck
36
The following graph shows the marginal revenue (MR) and marginal cost (MC) curves of an imperfectly competitive firm.Figure 9.2
Refer to Figure 9.2. At a quantity of 10 units, the firm should _____ , and at a quantity of 75 units, the firm should _____.
A)leave the level of production unchanged; also leave production unchanged
B)leave the level of production unchanged; decrease production
C)increase production; decrease production
D)increase production; leave production unchanged
E)decrease production; increase production
Unlock Deck
Unlock for access to all 121 flashcards in this deck.
Unlock Deck
k this deck
37
The table given below reports the marginal revenue and marginal cost of Holmes Detective Agency for each client.Table 9.2
Assume that a firm's marginal revenue curve intersects the rising portion of its marginal cost curve at 500 units of output. At this output level, a profit-maximizing firm's total cost of production is $1,000. If the price of the product is $5 per unit, the total revenue earned by the firm will be:
A)$1,500.
B)$250.
C)$500.
D)$2,500.
E)$1,000.
Unlock Deck
Unlock for access to all 121 flashcards in this deck.
Unlock Deck
k this deck
38
The table given below reports the marginal revenue and marginal cost of Holmes Detective Agency for each client.Table 9.2
If a firm's marginal revenue is greater than its marginal cost, then:
A)each added unit of output will reduce profits.
B)the firm is maximizing profit.
C)an increase in output will add more to revenue than to cost.
D)an increase in output will add more to cost than to revenue.
E)a fall in output will add more to revenue than to cost.
Unlock Deck
Unlock for access to all 121 flashcards in this deck.
Unlock Deck
k this deck
39
The table given below reports the marginal revenue and marginal cost of Holmes Detective Agency for each client.Table 9.2
Suppose at a certain quantity of output, a firm's average-total-cost curve lies above its demand curve. At this quantity of output, the firm:
A)is earning negative economic profit.
B)is earning zero economic profit.
C)is maximizing profit.
D)should increase its output to maximize profit.
E)should reduce output to maximize negative economic profit.
Unlock Deck
Unlock for access to all 121 flashcards in this deck.
Unlock Deck
k this deck
40
The table given below reports the marginal revenue and marginal cost of Holmes Detective Agency for each client.Table 9.2
Graphically, a firm's profit per unit of output can be found by:
A)the triangle formed under the demand curve.
B)the rectangle formed under the demand curve at a given price and quantity combination.
C)the rectangle formed under the average-total-cost curve at a given ATC and quantity combination.
D)the distance between the demand and average-total-cost curves at any level of output.
E)the distance between the horizontal axis and the average-total-cost curves at any level of output.
Unlock Deck
Unlock for access to all 121 flashcards in this deck.
Unlock Deck
k this deck
41
The figure given below shows the revenue and cost curves of a firm. MC represents the marginal cost curve, AC the average cost curve, MR the marginal revenue curve, and AR the average revenue curve.Figure 9.4
The only decision that a perfectly competitive firm makes is:
A)what price to charge.
B)what quantity to produce.
C)how much to spend on advertisements.
D)how much to discriminate on the basis of price.
E)how to differentiate its products from its rivals.
The only decision that a perfectly competitive firm makes is:
A)what price to charge.
B)what quantity to produce.
C)how much to spend on advertisements.
D)how much to discriminate on the basis of price.
E)how to differentiate its products from its rivals.
Unlock Deck
Unlock for access to all 121 flashcards in this deck.
Unlock Deck
k this deck
42
The figure given below shows the cost curves of a firm.Figure 9.3
ATC: Average Total Cost
AVC: Average Variable Cost
MC: Marginal Cost
In Figure 9.3, if the marginal revenue of the firm is constant at $55, calculate the profit earned by the firm at the profit-maximizing level of output?
A)$35
B)$40
C)$600
D)$4,800
E)$0
ATC: Average Total CostAVC: Average Variable Cost
MC: Marginal Cost
In Figure 9.3, if the marginal revenue of the firm is constant at $55, calculate the profit earned by the firm at the profit-maximizing level of output?
A)$35
B)$40
C)$600
D)$4,800
E)$0
Unlock Deck
Unlock for access to all 121 flashcards in this deck.
Unlock Deck
k this deck
43
The figure given below shows the revenue and cost curves of a firm. MC represents the marginal cost curve, AC the average cost curve, MR the marginal revenue curve, and AR the average revenue curve.Figure 9.4
Refer to Figure 9.3. The firm suffers a negative profit by producing:
A)100 units.
B)50 units.
C)80 units.
D)150 units.
E)250 units.
Refer to Figure 9.3. The firm suffers a negative profit by producing:
A)100 units.
B)50 units.
C)80 units.
D)150 units.
E)250 units.
Unlock Deck
Unlock for access to all 121 flashcards in this deck.
Unlock Deck
k this deck
44
The figure given below shows the cost curves of a firm.Figure 9.3
ATC: Average Total Cost
AVC: Average Variable Cost
MC: Marginal Cost
In Figure 9.3, what is the marginal cost at a quantity of 120 units?
A)$35
B)$40
C)$55
D)$60
E)$4,800
ATC: Average Total CostAVC: Average Variable Cost
MC: Marginal Cost
In Figure 9.3, what is the marginal cost at a quantity of 120 units?
A)$35
B)$40
C)$55
D)$60
E)$4,800
Unlock Deck
Unlock for access to all 121 flashcards in this deck.
Unlock Deck
k this deck
45
The figure given below shows the revenue and cost curves of a firm. MC represents the marginal cost curve, AC the average cost curve, MR the marginal revenue curve, and AR the average revenue curve.Figure 9.4
In a perfectly competitive industry, the price of good A is $2. If a firm in this industry decides to increase its price to $2.50, it will:
A)realize an increase in profit of $0.50 per unit output.
B)be able to increase the quantity sold of good A.
C)be unable to sell any quantity of good A that is produced.
D)lose some of its customers in the market.
E)experience a decrease in profit of $0.50 per unit output.
Unlock Deck
Unlock for access to all 121 flashcards in this deck.
Unlock Deck
k this deck
46
The figure given below shows the revenue and cost curves of a firm. MC represents the marginal cost curve, AC the average cost curve, MR the marginal revenue curve, and AR the average revenue curve.Figure 9.4
Steve is about to start up a business in a monopolistically competitive market. Which of the following can he expect?
A)He can expect market entry to be difficult as there exist entry barriers.
B)He can expect to enjoy a huge amount of market power.
C)He can expect to face a highly inelastic demand curve.
D)He can expect to find close substitutes of the product he is planning to produce.
E)He can expect to face an infinitely elastic demand curve.
Unlock Deck
Unlock for access to all 121 flashcards in this deck.
Unlock Deck
k this deck
47
The figure given below shows the revenue and cost curves of a firm. MC represents the marginal cost curve, AC the average cost curve, MR the marginal revenue curve, and AR the average revenue curve.Figure 9.4
An industry which has no barriers to entry, no product-promotion strategy, a standardized product, and a very large number of firms operating within it, is said to have:
A)a monopoly market structure.
B)perfect competition.
C)monopsonistic competition.
D)monopolistic competition.
E)an oligopoly market structure.
Unlock Deck
Unlock for access to all 121 flashcards in this deck.
Unlock Deck
k this deck
48
The figure given below shows the revenue and cost curves of a firm. MC represents the marginal cost curve, AC the average cost curve, MR the marginal revenue curve, and AR the average revenue curve.Figure 9.4
Identify the characteristics of a monopoly firm.
A)The existence of barriers to entry and production of a homogeneous product
B)The production of a unique product and a large number of sellers in the market
C)The production of a standardized product and the firm is a price taker
D)The existence of barriers to entry and the firm is a price taker
E)The existence of barriers to entry and the firm is a price maker
Unlock Deck
Unlock for access to all 121 flashcards in this deck.
Unlock Deck
k this deck
49
The figure given below shows the revenue and cost curves of a firm. MC represents the marginal cost curve, AC the average cost curve, MR the marginal revenue curve, and AR the average revenue curve.Figure 9.4
The ordering of market structures from most market power to least market power (where market power is the ability to set its own price) is:
A)monopoly, monopolistic competition, oligopoly, perfect competition.
B)perfect competition, monopolistic competition, oligopoly, monopoly.
C)oligopoly, monopoly, monopolistic competition, perfect competition.
D)monopoly, oligopoly, monopolistic competition, perfect competition.
E)monopoly, perfect competition, monopolistic competition, oligopoly.
Unlock Deck
Unlock for access to all 121 flashcards in this deck.
Unlock Deck
k this deck
50
The figure given below shows the revenue and cost curves of a firm. MC represents the marginal cost curve, AC the average cost curve, MR the marginal revenue curve, and AR the average revenue curve.Figure 9.4
Refer to Figure 9.3. The profit-maximizing level of output is:
A)80 units.
B)70 units.
C)60 units.
D)50 units.
E)40 units.
Refer to Figure 9.3. The profit-maximizing level of output is:
A)80 units.
B)70 units.
C)60 units.
D)50 units.
E)40 units.
Unlock Deck
Unlock for access to all 121 flashcards in this deck.
Unlock Deck
k this deck
51
The figure given below shows the cost curves of a firm.Figure 9.3
ATC: Average Total Cost
AVC: Average Variable Cost
MC: Marginal Cost
Refer to Figure 9.3. If the firm maximizes its profit at 120 units of the output, calculate the firm's marginal revenue.
A)$35
B)$40
C)$55
D)$4,200
E)Cannot be determined from the information given.
ATC: Average Total CostAVC: Average Variable Cost
MC: Marginal Cost
Refer to Figure 9.3. If the firm maximizes its profit at 120 units of the output, calculate the firm's marginal revenue.
A)$35
B)$40
C)$55
D)$4,200
E)Cannot be determined from the information given.
Unlock Deck
Unlock for access to all 121 flashcards in this deck.
Unlock Deck
k this deck
52
The figure given below shows the revenue and cost curves of a firm. MC represents the marginal cost curve, AC the average cost curve, MR the marginal revenue curve, and AR the average revenue curve.Figure 9.4
Which of the following is not true of monopolistic competition?
A)There are a large number of buyers and sellers.
B)The firms produce differentiated products.
C)There exists free entry and exit of firms.
D)Each of the firms faces a horizontal demand curve.
E)Each of the firms acts as a mini monopoly in the market.
Unlock Deck
Unlock for access to all 121 flashcards in this deck.
Unlock Deck
k this deck
53
The figure given below shows the revenue and cost curves of a firm. MC represents the marginal cost curve, AC the average cost curve, MR the marginal revenue curve, and AR the average revenue curve.Figure 9.4
Firms under perfect competition produce:
A)homogeneous products.
B)unique products.
C)either standardized or differentiated products.
D)differentiated products.
E)antique products.
Firms under perfect competition produce:
A)homogeneous products.
B)unique products.
C)either standardized or differentiated products.
D)differentiated products.
E)antique products.
Unlock Deck
Unlock for access to all 121 flashcards in this deck.
Unlock Deck
k this deck
54
The figure given below shows the revenue and cost curves of a firm. MC represents the marginal cost curve, AC the average cost curve, MR the marginal revenue curve, and AR the average revenue curve.Figure 9.4
A(n) ____ is a price taker.
A)monopoly firm
B)oligopoly firm
C)perfectly competitive firm
D)monopolistically competitive firm
E)duopoly firm
A(n) ____ is a price taker.
A)monopoly firm
B)oligopoly firm
C)perfectly competitive firm
D)monopolistically competitive firm
E)duopoly firm
Unlock Deck
Unlock for access to all 121 flashcards in this deck.
Unlock Deck
k this deck
55
The figure given below shows the revenue and cost curves of a firm. MC represents the marginal cost curve, AC the average cost curve, MR the marginal revenue curve, and AR the average revenue curve.Figure 9.4
In general, the two extreme cases of market structure models are represented by:
A)monopolistic competition and oligopoly.
B)oligopoly and monopoly.
C)oligopoly and perfect competition.
D)perfect competition and monopoly.
E)perfect monopoly and oligopolistic competition.
In general, the two extreme cases of market structure models are represented by:
A)monopolistic competition and oligopoly.
B)oligopoly and monopoly.
C)oligopoly and perfect competition.
D)perfect competition and monopoly.
E)perfect monopoly and oligopolistic competition.
Unlock Deck
Unlock for access to all 121 flashcards in this deck.
Unlock Deck
k this deck
56
The figure given below shows the revenue and cost curves of a firm. MC represents the marginal cost curve, AC the average cost curve, MR the marginal revenue curve, and AR the average revenue curve.Figure 9.4
Monopoly is a market structure in which:
A)there are significant barriers to the entry of new firms.
B)the firms face a perfectly elastic demand curve.
C)there are a large number of close substitutes for the good produced.
D)a homogeneous product is sold.
E)the firms are price takers.
Monopoly is a market structure in which:
A)there are significant barriers to the entry of new firms.
B)the firms face a perfectly elastic demand curve.
C)there are a large number of close substitutes for the good produced.
D)a homogeneous product is sold.
E)the firms are price takers.
Unlock Deck
Unlock for access to all 121 flashcards in this deck.
Unlock Deck
k this deck
57
The figure given below shows the revenue and cost curves of a firm. MC represents the marginal cost curve, AC the average cost curve, MR the marginal revenue curve, and AR the average revenue curve.Figure 9.4
If barriers to entry exist in the market for a product, then:
A)the costs of entry and exit are relatively low.
B)there will be few close substitutes of the product in the market.
C)firms will be incurring losses in both the short run and the long run.
D)firms will tend to have relatively less monopoly power.
E)the existing firms will quit the market in the long run due to mounting losses.
Unlock Deck
Unlock for access to all 121 flashcards in this deck.
Unlock Deck
k this deck
58
The figure given below shows the revenue and cost curves of a firm. MC represents the marginal cost curve, AC the average cost curve, MR the marginal revenue curve, and AR the average revenue curve.Figure 9.4
Why does a monopolist face the market demand curve?
A)Presence of a large number of substitutes
B)Presence of a large number of buyers in the market
C)Barred entry of any new firm in the market
D)Produces a homogeneous product
E)Consumers have perfect knowledge of the market
Why does a monopolist face the market demand curve?
A)Presence of a large number of substitutes
B)Presence of a large number of buyers in the market
C)Barred entry of any new firm in the market
D)Produces a homogeneous product
E)Consumers have perfect knowledge of the market
Unlock Deck
Unlock for access to all 121 flashcards in this deck.
Unlock Deck
k this deck
59
The figure given below shows the revenue and cost curves of a firm. MC represents the marginal cost curve, AC the average cost curve, MR the marginal revenue curve, and AR the average revenue curve.Figure 9.4
Which among the following does not determine the shape of the demand curve for a good under different market structures?
A)Number of substitutes in the market
B)Importance of the good in a consumer's budget
C)Cost structure of the firm
D)Price-elasticity of demand
E)The length of time being considered
Unlock Deck
Unlock for access to all 121 flashcards in this deck.
Unlock Deck
k this deck
60
The figure given below shows the revenue and cost curves of a firm. MC represents the marginal cost curve, AC the average cost curve, MR the marginal revenue curve, and AR the average revenue curve.Figure 9.4
Under perfect competition, at the profit-maximizing level of output:
A)price is greater than marginal revenue.
B)price is equal to marginal revenue.
C)marginal revenue is equal to zero.
D)the marginal revenue curve is upward sloping.
E)the average revenue curve is upward sloping.
Under perfect competition, at the profit-maximizing level of output:
A)price is greater than marginal revenue.
B)price is equal to marginal revenue.
C)marginal revenue is equal to zero.
D)the marginal revenue curve is upward sloping.
E)the average revenue curve is upward sloping.
Unlock Deck
Unlock for access to all 121 flashcards in this deck.
Unlock Deck
k this deck
61
The following figure shows the cost and revenue structures of a firm. MC represents the marginal cost curve, AC represents the average cost curve, AR represents the average revenue curve, and MR represents the marginal revenue curve. P* is the equilibrium price and Q* is the equilibrium output.Figure 9.5
Refer to Figure 9.5. Identify the market structure in which the firm operates.
A)Perfect competition
B)Monopolistic competition
C)Monopoly
D)Monopsony
E)Duopoly
Refer to Figure 9.5. Identify the market structure in which the firm operates.
A)Perfect competition
B)Monopolistic competition
C)Monopoly
D)Monopsony
E)Duopoly
Unlock Deck
Unlock for access to all 121 flashcards in this deck.
Unlock Deck
k this deck
62
The following table shows the annual income statement of Max Computers.Table 9.3
Refer to the Table 9.3. The net income of Max Computers is:
A)$10,000 million.
B)$25,000 million.
C)$11,000 million.
D)$13,000 million.
E)$12,500 million.
Refer to the Table 9.3. The net income of Max Computers is:
A)$10,000 million.
B)$25,000 million.
C)$11,000 million.
D)$13,000 million.
E)$12,500 million.
Unlock Deck
Unlock for access to all 121 flashcards in this deck.
Unlock Deck
k this deck
63
Scenario 9.1
Jane left her job at Siemens and started her own boutique. She used to earn $50,000 annually at Siemens. She took a loan of $10,000 and used $20,000 from her personal savings to begin her venture. She agreed to repay the loan with 10% interest. Her business is bringing in $80,000 annually. She has rent and labor expenses of $15,000. Also assume that Jane could have used her own money i.e. $20,000 to buy stocks in Intel which would have returned 5% to her last year.
The equity capital of a privately owned firm includes:
A)the owner's own dollars put into the firm.
B)the cost of raw materials.
C)the cost of labor resource used in production.
D)economic rent only.
E)the value added at each stage of production.
Unlock Deck
Unlock for access to all 121 flashcards in this deck.
Unlock Deck
k this deck
64
Scenario 9.1
Jane left her job at Siemens and started her own boutique. She used to earn $50,000 annually at Siemens. She took a loan of $10,000 and used $20,000 from her personal savings to begin her venture. She agreed to repay the loan with 10% interest. Her business is bringing in $80,000 annually. She has rent and labor expenses of $15,000. Also assume that Jane could have used her own money i.e. $20,000 to buy stocks in Intel which would have returned 5% to her last year.
Suppose a mechanic uses $150,000 of his own money to start a business. The rate of interest he could earn in a savings account is 5 percent, and the rate of interest he could earn by investing in bonds is 8 percent. What is the opportunity cost of capital when the mechanic uses his money to start his own business?
A)$7,500/year
B)$8,000/year
C)$19,500/year
D)$12,000/year
E)$150,000/year
Unlock Deck
Unlock for access to all 121 flashcards in this deck.
Unlock Deck
k this deck
65
The following figure shows the cost and revenue structures of a firm. MC represents the marginal cost curve, AC represents the average cost curve, AR represents the average revenue curve, and MR represents the marginal revenue curve. P* is the equilibrium price and Q* is the equilibrium output.Figure 9.5
Suppose Mark invests a sum of $100,000 in a new venture. To fund his investment, Mark withdraws $50,000 from a savings account paying 10% per year and uses the proceeds from a bond that has just matured worth $50,000. If he had reinvested the proceeds from the bond, he could have earned interest at the rate of 5%. Calculate the opportunity cost of capital for Mark in a particular year.
A)$5,000
B)$7,500
C)$10,000
D)$12,500
E)$100,000
Unlock Deck
Unlock for access to all 121 flashcards in this deck.
Unlock Deck
k this deck
66
The figure given below shows the revenue and cost curves of a firm. MC represents the marginal cost curve, AC the average cost curve, MR the marginal revenue curve, and AR the average revenue curve.Figure 9.4
A downward-sloping demand curve is faced by firms:
A)under perfect competition.
B)under perfect competition and monopoly.
C)in all market structures except monopoly.
D)in all market structures except monopolistic competition.
E)in all market structures except perfect competition.
A downward-sloping demand curve is faced by firms:
A)under perfect competition.
B)under perfect competition and monopoly.
C)in all market structures except monopoly.
D)in all market structures except monopolistic competition.
E)in all market structures except perfect competition.
Unlock Deck
Unlock for access to all 121 flashcards in this deck.
Unlock Deck
k this deck
67
The following figure shows the cost and revenue structures of a firm. MC represents the marginal cost curve, AC represents the average cost curve, AR represents the average revenue curve, and MR represents the marginal revenue curve. P* is the equilibrium price and Q* is the equilibrium output.Figure 9.5
A firm's accounting profit does not include its:
A)explicit costs.
B)sunk costs.
C)fixed costs.
D)opportunity costs.
E)variable costs.
A firm's accounting profit does not include its:
A)explicit costs.
B)sunk costs.
C)fixed costs.
D)opportunity costs.
E)variable costs.
Unlock Deck
Unlock for access to all 121 flashcards in this deck.
Unlock Deck
k this deck
68
Scenario 9.1
Jane left her job at Siemens and started her own boutique. She used to earn $50,000 annually at Siemens. She took a loan of $10,000 and used $20,000 from her personal savings to begin her venture. She agreed to repay the loan with 10% interest. Her business is bringing in $80,000 annually. She has rent and labor expenses of $15,000. Also assume that Jane could have used her own money i.e. $20,000 to buy stocks in Intel which would have returned 5% to her last year.
Refer to Scenario 9.1 and calculate Jane's accounting profit.
A)$50,000
B)$65,000
C)$80,000
D)$64,000
E)$35,000
Unlock Deck
Unlock for access to all 121 flashcards in this deck.
Unlock Deck
k this deck
69
The figure given below shows the revenue and cost curves of a firm. MC represents the marginal cost curve, AC the average cost curve, MR the marginal revenue curve, and AR the average revenue curve.Figure 9.4
Under imperfect competition, a firm's:
A)demand curve lies below its marginal revenue curve.
B)demand curve lies above its marginal revenue curve.
C)demand curve coincides with its marginal revenue curve.
D)demand curve coincides with its marginal cost curve.
E)demand curve coincides with its average cost curve.
Unlock Deck
Unlock for access to all 121 flashcards in this deck.
Unlock Deck
k this deck
70
The following figure shows the cost and revenue structures of a firm. MC represents the marginal cost curve, AC represents the average cost curve, AR represents the average revenue curve, and MR represents the marginal revenue curve. P* is the equilibrium price and Q* is the equilibrium output.Figure 9.5
The opportunity cost of capital is:
A)the cost of labor inputs required to operate that capital.
B)the cost of raw materials necessary to put that capital to work.
C)the payment necessary to keep that capital from moving to an alternative use.
D)the costs of maintenance necessary to keep that capital operating.
E)the cost of hiring more units of capital to generate additional units of output.
Unlock Deck
Unlock for access to all 121 flashcards in this deck.
Unlock Deck
k this deck
71
Scenario 9.1
Jane left her job at Siemens and started her own boutique. She used to earn $50,000 annually at Siemens. She took a loan of $10,000 and used $20,000 from her personal savings to begin her venture. She agreed to repay the loan with 10% interest. Her business is bringing in $80,000 annually. She has rent and labor expenses of $15,000. Also assume that Jane could have used her own money i.e. $20,000 to buy stocks in Intel which would have returned 5% to her last year.
Refer to Scenario 8.1. Compute Jane's economic profit.
A)$13,000
B)$14,000
C)$20,000
D)$15,000
E)$10,000
Unlock Deck
Unlock for access to all 121 flashcards in this deck.
Unlock Deck
k this deck
72
The figure given below shows the revenue and cost curves of a firm. MC represents the marginal cost curve, AC the average cost curve, MR the marginal revenue curve, and AR the average revenue curve.Figure 9.4
The characteristic that distinguishes a monopolistically competitive market from a perfectly competitive market is the:
A)ease of entry.
B)number of firms operating in the market.
C)degree of government regulation in the activities of the firms.
D)differentiation of products.
E)extent of market share of each firm.
Unlock Deck
Unlock for access to all 121 flashcards in this deck.
Unlock Deck
k this deck
73
The figure given below shows the revenue and cost curves of a firm. MC represents the marginal cost curve, AC the average cost curve, MR the marginal revenue curve, and AR the average revenue curve.Figure 9.4
The demand curve faced by a perfectly competitive firm is:
A)perfectly inelastic.
B)relatively elastic.
C)unit elastic.
D)perfectly elastic.
E)relatively inelastic.
The demand curve faced by a perfectly competitive firm is:
A)perfectly inelastic.
B)relatively elastic.
C)unit elastic.
D)perfectly elastic.
E)relatively inelastic.
Unlock Deck
Unlock for access to all 121 flashcards in this deck.
Unlock Deck
k this deck
74
Scenario 9.1
Jane left her job at Siemens and started her own boutique. She used to earn $50,000 annually at Siemens. She took a loan of $10,000 and used $20,000 from her personal savings to begin her venture. She agreed to repay the loan with 10% interest. Her business is bringing in $80,000 annually. She has rent and labor expenses of $15,000. Also assume that Jane could have used her own money i.e. $20,000 to buy stocks in Intel which would have returned 5% to her last year.
Nancy owns and operates a drug store that generates total revenues worth $30 million in a particular year. Her accounting costs for the year are $25 million. She could have earned $3 million in this year, if she had worked as a consultant for a pharmaceutical firm. Further, she could have earned 5 percent interest on $40 million of her own money that she invests in the business this year. Nancy's accounting profit in this year is _____ and her economic profit is _____.
A)$5 million; zero
B)$5 million; $3 million
C)$5 million; $8 million
D)zero; $3 million
E)$3 million; $43 million
Unlock Deck
Unlock for access to all 121 flashcards in this deck.
Unlock Deck
k this deck
75
The figure given below shows the revenue and cost curves of a firm. MC represents the marginal cost curve, AC the average cost curve, MR the marginal revenue curve, and AR the average revenue curve.Figure 9.4
Which of the following characteristics distinguishes oligopoly from other market structures?
A)Firms operating in an oligopoly are independent of each other.
B)Firms operating in an oligopoly are interdependent.
C)Oligopoly is the simplest of all the other market structures.
D)An oligopolist does not face a downward-sloping demand curve.
E)Entry into an oligopolistic market is easier than entry into a monopolistically competitive market.
Unlock Deck
Unlock for access to all 121 flashcards in this deck.
Unlock Deck
k this deck
76
The figure given below shows the revenue and cost curves of a firm. MC represents the marginal cost curve, AC the average cost curve, MR the marginal revenue curve, and AR the average revenue curve.Figure 9.4
A monopolistically competitive firm faces a relatively-elastic demand curve as compared to a monopolist firm because of the:
A)presence of a large number of buyers and barriers to entry.
B)presence of a large number of firms and easy entry into the market.
C)production of perfectly homogeneous products.
D)production of unique products and the presence of barriers to entry.
E)production of goods that are perfect complements of each other.
Unlock Deck
Unlock for access to all 121 flashcards in this deck.
Unlock Deck
k this deck
77
The following figure shows the cost and revenue structures of a firm. MC represents the marginal cost curve, AC represents the average cost curve, AR represents the average revenue curve, and MR represents the marginal revenue curve. P* is the equilibrium price and Q* is the equilibrium output.Figure 9.5
The accounting profit of a business firm is also called:
A)royalty income.
B)net income from equity.
C)compensatory income.
D)windfall gain.
E)net operating income.
The accounting profit of a business firm is also called:
A)royalty income.
B)net income from equity.
C)compensatory income.
D)windfall gain.
E)net operating income.
Unlock Deck
Unlock for access to all 121 flashcards in this deck.
Unlock Deck
k this deck
78
The figure given below shows the revenue and cost curves of a firm. MC represents the marginal cost curve, AC the average cost curve, MR the marginal revenue curve, and AR the average revenue curve.Figure 9.4
In contrast to both perfect competition and monopolistic competition, an oligopoly market structure is characterized by:
A)price discrimination.
B)a perfectly inelastic demand curve.
C)the presence of infinite number of firms.
D)the production of only differentiated products.
E)difficulty in the entry of new firms.
Unlock Deck
Unlock for access to all 121 flashcards in this deck.
Unlock Deck
k this deck
79
The figure given below shows the revenue and cost curves of a firm. MC represents the marginal cost curve, AC the average cost curve, MR the marginal revenue curve, and AR the average revenue curve.Figure 9.4
A(n) ____ may offer products that are either differentiated or identical.
A)monopolistically competitive firm
B)monopolist
C)oligopolistic firm
D)perfectly competitive firm
E)monopsonist
A(n) ____ may offer products that are either differentiated or identical.
A)monopolistically competitive firm
B)monopolist
C)oligopolistic firm
D)perfectly competitive firm
E)monopsonist
Unlock Deck
Unlock for access to all 121 flashcards in this deck.
Unlock Deck
k this deck
80
The figure given below shows the revenue and cost curves of a firm. MC represents the marginal cost curve, AC the average cost curve, MR the marginal revenue curve, and AR the average revenue curve.Figure 9.4
A monopolist faces the least price-elastic demand curve because:
A)the consumers have only one place to buy the good.
B)the monopolist produces a standardized product.
C)the monopolist undertakes a huge expenditure to produce the product.
D)the monopolist supplies to an insignificant portion of the market.
E)the monopolist produces an absolutely necessary good having close substitutes.
Unlock Deck
Unlock for access to all 121 flashcards in this deck.
Unlock Deck
k this deck
Unlock Deck
Unlock for access to all 121 flashcards in this deck.


