Deck 15: Resource Markets
Full screen (f)
Question
In the following figure, the first panel shows a market situation prior to regulation and the second panel shows the effects of regulation.Figure 14.2
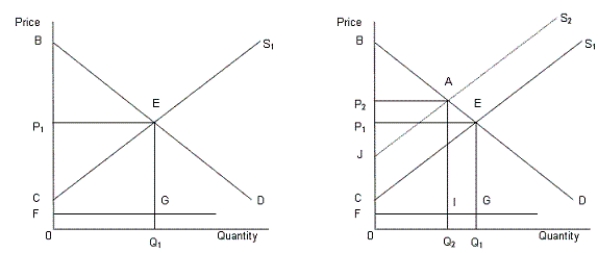 In the figure,
D: Demand curve for automobiles
S1: Supply curve of automobiles prior to regulation
S2: Supply curve of automobiles after regulation
FG: Clean up cost per unit
Goods which are demanded to produce something else are said to have a(n):
A)direct demand.
B)composite demand.
C)derived demand.
D)joint demand.
E)inelastic demand.
In the figure,D: Demand curve for automobiles
S1: Supply curve of automobiles prior to regulation
S2: Supply curve of automobiles after regulation
FG: Clean up cost per unit
Goods which are demanded to produce something else are said to have a(n):
A)direct demand.
B)composite demand.
C)derived demand.
D)joint demand.
E)inelastic demand.
Question
In the following figure, the first panel shows a market situation prior to regulation and the second panel shows the effects of regulation.Figure 14.2
In the figure,
D: Demand curve for automobiles
S1: Supply curve of automobiles prior to regulation
S2: Supply curve of automobiles after regulation
FG: Clean up cost per unit
When studying the market for resources, it is important to understand that:
A)resources are wanted not for themselves, but for what they produce.
B)demand for resources is generally inelastic in nature.
C)derived demand does not apply to the resource market.
D)resource markets do not conform to the laws of supply and demand as other markets do.
E)supply is much more important than demand in determining the price of a resource.
In the figure,D: Demand curve for automobiles
S1: Supply curve of automobiles prior to regulation
S2: Supply curve of automobiles after regulation
FG: Clean up cost per unit
When studying the market for resources, it is important to understand that:
A)resources are wanted not for themselves, but for what they produce.
B)demand for resources is generally inelastic in nature.
C)derived demand does not apply to the resource market.
D)resource markets do not conform to the laws of supply and demand as other markets do.
E)supply is much more important than demand in determining the price of a resource.
Question
In the following figure, the first panel shows a market situation prior to regulation and the second panel shows the effects of regulation.Figure 14.2
In the figure,
D: Demand curve for automobiles
S1: Supply curve of automobiles prior to regulation
S2: Supply curve of automobiles after regulation
FG: Clean up cost per unit
Assume that labor is the only variable input and that an additional input of labor increases total output from 72 to 78 units. If the product sells for $6 per unit in a perfectly competitive market, then the marginal revenue product of this additional worker is:
A)$78.
B)$72.
C)$36.
D)$39.
E)$6.
In the figure,D: Demand curve for automobiles
S1: Supply curve of automobiles prior to regulation
S2: Supply curve of automobiles after regulation
FG: Clean up cost per unit
Assume that labor is the only variable input and that an additional input of labor increases total output from 72 to 78 units. If the product sells for $6 per unit in a perfectly competitive market, then the marginal revenue product of this additional worker is:
A)$78.
B)$72.
C)$36.
D)$39.
E)$6.
Question
In the following figure, the first panel shows a market situation prior to regulation and the second panel shows the effects of regulation.Figure 14.2
In the figure,
D: Demand curve for automobiles
S1: Supply curve of automobiles prior to regulation
S2: Supply curve of automobiles after regulation
FG: Clean up cost per unit
The buyers and sellers in a resource market are:
A)household and firms respectively.
B)banks and farmers respectively.
C)households and land owners respectively.
D)firms and household respectively.
E)exporters and importers respectively.
In the figure,D: Demand curve for automobiles
S1: Supply curve of automobiles prior to regulation
S2: Supply curve of automobiles after regulation
FG: Clean up cost per unit
The buyers and sellers in a resource market are:
A)household and firms respectively.
B)banks and farmers respectively.
C)households and land owners respectively.
D)firms and household respectively.
E)exporters and importers respectively.
Question
In the following figure, the first panel shows a market situation prior to regulation and the second panel shows the effects of regulation.Figure 14.2
In the figure,
D: Demand curve for automobiles
S1: Supply curve of automobiles prior to regulation
S2: Supply curve of automobiles after regulation
FG: Clean up cost per unit
Intel microchips are an input in the production of a computer. When the demand for the computer declines:
A)the quantity demanded of Intel microchips increases.
B)the quantity demanded of Intel microchips declines.
C)the demand for Intel microchips increases.
D)the demand for Intel microchips decreases.
E)there is no change in the demand for the Intel microchips.
In the figure,D: Demand curve for automobiles
S1: Supply curve of automobiles prior to regulation
S2: Supply curve of automobiles after regulation
FG: Clean up cost per unit
Intel microchips are an input in the production of a computer. When the demand for the computer declines:
A)the quantity demanded of Intel microchips increases.
B)the quantity demanded of Intel microchips declines.
C)the demand for Intel microchips increases.
D)the demand for Intel microchips decreases.
E)there is no change in the demand for the Intel microchips.
Question
In the following figure, the first panel shows a market situation prior to regulation and the second panel shows the effects of regulation.Figure 14.2
In the figure,
D: Demand curve for automobiles
S1: Supply curve of automobiles prior to regulation
S2: Supply curve of automobiles after regulation
FG: Clean up cost per unit
The marginal revenue product (MRP) is the:
A)value of the additional output that an extra unit of a resource can produce.
B)cost of hiring an additional unit of a resource.
C)extra cost of producing an additional unit of output.
D)increase in total output when an additional unit of an input is hired.
E)change in total revenue when an additional unit of a good is sold.
In the figure,D: Demand curve for automobiles
S1: Supply curve of automobiles prior to regulation
S2: Supply curve of automobiles after regulation
FG: Clean up cost per unit
The marginal revenue product (MRP) is the:
A)value of the additional output that an extra unit of a resource can produce.
B)cost of hiring an additional unit of a resource.
C)extra cost of producing an additional unit of output.
D)increase in total output when an additional unit of an input is hired.
E)change in total revenue when an additional unit of a good is sold.
Question
In the following figure, the first panel shows a market situation prior to regulation and the second panel shows the effects of regulation.Figure 14.2
In the figure,
D: Demand curve for automobiles
S1: Supply curve of automobiles prior to regulation
S2: Supply curve of automobiles after regulation
FG: Clean up cost per unit
The demand curve for labor indicates that:
A)as the real wage rate increases, employers will hire more workers.
B)as the nominal wage rate increases, employers will hire more workers.
C)as the nominal wage rate decreases, the real wage rate increases.
D)as the real wage rate increases, employers will hire fewer workers.
E)as the real wage rate decreases the nominal wage rate increases.
In the figure,D: Demand curve for automobiles
S1: Supply curve of automobiles prior to regulation
S2: Supply curve of automobiles after regulation
FG: Clean up cost per unit
The demand curve for labor indicates that:
A)as the real wage rate increases, employers will hire more workers.
B)as the nominal wage rate increases, employers will hire more workers.
C)as the nominal wage rate decreases, the real wage rate increases.
D)as the real wage rate increases, employers will hire fewer workers.
E)as the real wage rate decreases the nominal wage rate increases.
Question
In the following figure, the first panel shows a market situation prior to regulation and the second panel shows the effects of regulation.Figure 14.2
In the figure,
D: Demand curve for automobiles
S1: Supply curve of automobiles prior to regulation
S2: Supply curve of automobiles after regulation
FG: Clean up cost per unit
The resource market is the same as the product market except that, in the resource market:
A)the demand curve slopes upward.
B)the households are the sellers and the firms are the buyers.
C)there is no substitution effect.
D)the supply curve is perfectly inelastic.
E)there is no income effect.
In the figure,D: Demand curve for automobiles
S1: Supply curve of automobiles prior to regulation
S2: Supply curve of automobiles after regulation
FG: Clean up cost per unit
The resource market is the same as the product market except that, in the resource market:
A)the demand curve slopes upward.
B)the households are the sellers and the firms are the buyers.
C)there is no substitution effect.
D)the supply curve is perfectly inelastic.
E)there is no income effect.
Question
In the following figure, the first panel shows a market situation prior to regulation and the second panel shows the effects of regulation.Figure 14.2
In the figure,
D: Demand curve for automobiles
S1: Supply curve of automobiles prior to regulation
S2: Supply curve of automobiles after regulation
FG: Clean up cost per unit
Which of the following statements best illustrates the relationship between the market for products and the market for resources?
A)An increase in the price of cameras will decrease the demand for film.
B)As income rises, people demand relatively smaller amounts of food.
C)An increase in the demand for textiles will increase the demand for textile workers.
D)An increase in the price of butter will cause more people to buy margarine.
E)A decrease in the demand for tea will increase the demand for coffee.
In the figure,D: Demand curve for automobiles
S1: Supply curve of automobiles prior to regulation
S2: Supply curve of automobiles after regulation
FG: Clean up cost per unit
Which of the following statements best illustrates the relationship between the market for products and the market for resources?
A)An increase in the price of cameras will decrease the demand for film.
B)As income rises, people demand relatively smaller amounts of food.
C)An increase in the demand for textiles will increase the demand for textile workers.
D)An increase in the price of butter will cause more people to buy margarine.
E)A decrease in the demand for tea will increase the demand for coffee.
Question
In the following figure, the first panel shows a market situation prior to regulation and the second panel shows the effects of regulation.Figure 14.2
In the figure,
D: Demand curve for automobiles
S1: Supply curve of automobiles prior to regulation
S2: Supply curve of automobiles after regulation
FG: Clean up cost per unit
In the market for resources, demand and supply:
A)do not behave in the same way as they do in product markets.
B)behave in exactly the same way as they do in product markets.
C)curves usually do not intersect at equilibrium.
D)are both controlled by firms.
E)are both controlled by households
In the figure,D: Demand curve for automobiles
S1: Supply curve of automobiles prior to regulation
S2: Supply curve of automobiles after regulation
FG: Clean up cost per unit
In the market for resources, demand and supply:
A)do not behave in the same way as they do in product markets.
B)behave in exactly the same way as they do in product markets.
C)curves usually do not intersect at equilibrium.
D)are both controlled by firms.
E)are both controlled by households
Question
In the following figure, the first panel shows a market situation prior to regulation and the second panel shows the effects of regulation.Figure 14.2
In the figure,
D: Demand curve for automobiles
S1: Supply curve of automobiles prior to regulation
S2: Supply curve of automobiles after regulation
FG: Clean up cost per unit
Which of the following goods is likely to have a derived demand?
A)Tractor
B)T-shirt
C)Italian food
D)Residential buildings
E)Cigarettes
In the figure,D: Demand curve for automobiles
S1: Supply curve of automobiles prior to regulation
S2: Supply curve of automobiles after regulation
FG: Clean up cost per unit
Which of the following goods is likely to have a derived demand?
A)Tractor
B)T-shirt
C)Italian food
D)Residential buildings
E)Cigarettes
Question
In the following figure, the first panel shows a market situation prior to regulation and the second panel shows the effects of regulation.Figure 14.2
In the figure,
D: Demand curve for automobiles
S1: Supply curve of automobiles prior to regulation
S2: Supply curve of automobiles after regulation
FG: Clean up cost per unit
An automobile manufacturer uses land, labor, capital, and entrepreneurial ability to produce cars and trucks. If the price of trucks increases, the automobile manufacturer would not _____.
A)pay a lower wage rate to labor
B)increase truck production
C)hire more workers
D)increase capital used in production
E)increase land used in production
In the figure,D: Demand curve for automobiles
S1: Supply curve of automobiles prior to regulation
S2: Supply curve of automobiles after regulation
FG: Clean up cost per unit
An automobile manufacturer uses land, labor, capital, and entrepreneurial ability to produce cars and trucks. If the price of trucks increases, the automobile manufacturer would not _____.
A)pay a lower wage rate to labor
B)increase truck production
C)hire more workers
D)increase capital used in production
E)increase land used in production
Question
In the following figure, the first panel shows a market situation prior to regulation and the second panel shows the effects of regulation.Figure 14.2
In the figure,
D: Demand curve for automobiles
S1: Supply curve of automobiles prior to regulation
S2: Supply curve of automobiles after regulation
FG: Clean up cost per unit
Firms are consumers and households are producers in the _____ market.
A)stock
B)bond
C)labor
D)product
E)underground
In the figure,D: Demand curve for automobiles
S1: Supply curve of automobiles prior to regulation
S2: Supply curve of automobiles after regulation
FG: Clean up cost per unit
Firms are consumers and households are producers in the _____ market.
A)stock
B)bond
C)labor
D)product
E)underground
Question
In the following figure, the first panel shows a market situation prior to regulation and the second panel shows the effects of regulation.Figure 14.2
In the figure,
D: Demand curve for automobiles
S1: Supply curve of automobiles prior to regulation
S2: Supply curve of automobiles after regulation
FG: Clean up cost per unit
The marginal revenue product curve of a factor is negatively sloped because:
A)the additional revenue generated from an additional unit of a factor remains constant as more resources are hired.
B)the additional revenue generated from an additional unit of a factor declines as more resources are hired.
C)the additional revenue generated from an additional unit of a factor usually becomes zero as more resources are hired.
D)the additional revenue generated from an additional unit of a factor increases as more resources are hired.
E)the additional revenue generated from an additional unit of a factor doubles every time new resources are hired.
In the figure,D: Demand curve for automobiles
S1: Supply curve of automobiles prior to regulation
S2: Supply curve of automobiles after regulation
FG: Clean up cost per unit
The marginal revenue product curve of a factor is negatively sloped because:
A)the additional revenue generated from an additional unit of a factor remains constant as more resources are hired.
B)the additional revenue generated from an additional unit of a factor declines as more resources are hired.
C)the additional revenue generated from an additional unit of a factor usually becomes zero as more resources are hired.
D)the additional revenue generated from an additional unit of a factor increases as more resources are hired.
E)the additional revenue generated from an additional unit of a factor doubles every time new resources are hired.
Question
In the following figure, the first panel shows a market situation prior to regulation and the second panel shows the effects of regulation.Figure 14.2
In the figure,
D: Demand curve for automobiles
S1: Supply curve of automobiles prior to regulation
S2: Supply curve of automobiles after regulation
FG: Clean up cost per unit
The marginal factor cost (MFC) is the:
A)value of the additional output that an extra unit of a resource can produce.
B)additional cost of employing an additional unit of a resource.
C)additional cost of producing an additional unit of output.
D)the ratio of the total fixed cost to the total cost of production.
E)ratio of total cost to the total amount of resources employed.
In the figure,D: Demand curve for automobiles
S1: Supply curve of automobiles prior to regulation
S2: Supply curve of automobiles after regulation
FG: Clean up cost per unit
The marginal factor cost (MFC) is the:
A)value of the additional output that an extra unit of a resource can produce.
B)additional cost of employing an additional unit of a resource.
C)additional cost of producing an additional unit of output.
D)the ratio of the total fixed cost to the total cost of production.
E)ratio of total cost to the total amount of resources employed.
Question
In the following figure, the first panel shows a market situation prior to regulation and the second panel shows the effects of regulation.Figure 14.2
In the figure,
D: Demand curve for automobiles
S1: Supply curve of automobiles prior to regulation
S2: Supply curve of automobiles after regulation
FG: Clean up cost per unit
If the market price of the product that employs labor in production increases:
A)the marginal product of labor increases.
B)the demand curve for labor shifts to the left.
C)the price of labor decreases.
D)the marginal revenue product of labor increases.
E)the supply curve of labor shifts to the left.
In the figure,D: Demand curve for automobiles
S1: Supply curve of automobiles prior to regulation
S2: Supply curve of automobiles after regulation
FG: Clean up cost per unit
If the market price of the product that employs labor in production increases:
A)the marginal product of labor increases.
B)the demand curve for labor shifts to the left.
C)the price of labor decreases.
D)the marginal revenue product of labor increases.
E)the supply curve of labor shifts to the left.
Question
In the following figure, the first panel shows a market situation prior to regulation and the second panel shows the effects of regulation.Figure 14.2
In the figure,
D: Demand curve for automobiles
S1: Supply curve of automobiles prior to regulation
S2: Supply curve of automobiles after regulation
FG: Clean up cost per unit
Tools and equipments used in production are:
A)natural resources.
B)entrepreneurial resources.
C)human capital.
D)capital resources.
E)labor resources.
In the figure,D: Demand curve for automobiles
S1: Supply curve of automobiles prior to regulation
S2: Supply curve of automobiles after regulation
FG: Clean up cost per unit
Tools and equipments used in production are:
A)natural resources.
B)entrepreneurial resources.
C)human capital.
D)capital resources.
E)labor resources.
Question
Analysis
The following figure shows the marginal revenue product of a resource [MRP]:
Figure 14.1
![<strong>Analysis The following figure shows the marginal revenue product of a resource [MRP]: Figure 14.1 Assume that the resource market shown in Figure 14.1 is perfectly competitive. The MRP curve for the resource is negatively sloped because:</strong> A)the firm can sell more units of a good only at lower prices. B)the marginal physical product curve for the resource is negatively sloped. C)the resource gives increasing returns as more of the resource is employed. D)the firm hires more units of the resource at a higher price. E)average productivity of the resource increases as more units of the resource are used. <div style=padding-top: 35px>](https://storage.examlex.com/TB1748/11ea8882_624e_f93c_8903_0931f536244f_TB1748_00_TB1748_00.jpg)
Assume that the resource market shown in Figure 14.1 is perfectly competitive. The MRP curve for the resource is negatively sloped because:
A)the firm can sell more units of a good only at lower prices.
B)the marginal physical product curve for the resource is negatively sloped.
C)the resource gives increasing returns as more of the resource is employed.
D)the firm hires more units of the resource at a higher price.
E)average productivity of the resource increases as more units of the resource are used.
The following figure shows the marginal revenue product of a resource [MRP]:
Figure 14.1
Assume that the resource market shown in Figure 14.1 is perfectly competitive. The MRP curve for the resource is negatively sloped because:
A)the firm can sell more units of a good only at lower prices.
B)the marginal physical product curve for the resource is negatively sloped.
C)the resource gives increasing returns as more of the resource is employed.
D)the firm hires more units of the resource at a higher price.
E)average productivity of the resource increases as more units of the resource are used.
Question
In the following figure, the first panel shows a market situation prior to regulation and the second panel shows the effects of regulation.Figure 14.2
In the figure,
D: Demand curve for automobiles
S1: Supply curve of automobiles prior to regulation
S2: Supply curve of automobiles after regulation
FG: Clean up cost per unit
The price of a resource declines when:
A)both the demand for and the supply of the resource declines in the same proportion.
B)demand remaining constant, supply of the resource declines.
C)supply remaining constant, the demand for the resource declines.
D)both the demand for and the supply of the resource increases in the same proportion.
E)both the demand for and the supply of the resource declines, but supply falls by a greater proportion than demand.
In the figure,D: Demand curve for automobiles
S1: Supply curve of automobiles prior to regulation
S2: Supply curve of automobiles after regulation
FG: Clean up cost per unit
The price of a resource declines when:
A)both the demand for and the supply of the resource declines in the same proportion.
B)demand remaining constant, supply of the resource declines.
C)supply remaining constant, the demand for the resource declines.
D)both the demand for and the supply of the resource increases in the same proportion.
E)both the demand for and the supply of the resource declines, but supply falls by a greater proportion than demand.
Question
In the following figure, the first panel shows a market situation prior to regulation and the second panel shows the effects of regulation.Figure 14.2
In the figure,
D: Demand curve for automobiles
S1: Supply curve of automobiles prior to regulation
S2: Supply curve of automobiles after regulation
FG: Clean up cost per unit
During the recession witnessed in early 2001, many firms laid off their employees and downsized. The reason for this decrease in the demand for employees was:
A)a reduction in the demand for final goods.
B)a reduction in the prices of final goods.
C)an increase in the demand for final goods.
D)an increase in the prices of final goods.
E)the incompetency and poor performance of the employees.
In the figure,D: Demand curve for automobiles
S1: Supply curve of automobiles prior to regulation
S2: Supply curve of automobiles after regulation
FG: Clean up cost per unit
During the recession witnessed in early 2001, many firms laid off their employees and downsized. The reason for this decrease in the demand for employees was:
A)a reduction in the demand for final goods.
B)a reduction in the prices of final goods.
C)an increase in the demand for final goods.
D)an increase in the prices of final goods.
E)the incompetency and poor performance of the employees.
Question
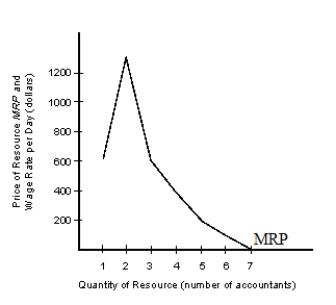
The figure given below shows the marginal revenue product (MRP) of accountants in a firm.Figure 14.2
MRP = MP X MR
Under perfect competition in the resource market, the marginal factor cost curve:
A)is positively sloped.
B)is vertical.
C)is negatively sloped.
D)is horizontal.
E)does not exist.
MRP = MP X MR
Under perfect competition in the resource market, the marginal factor cost curve:
A)is positively sloped.
B)is vertical.
C)is negatively sloped.
D)is horizontal.
E)does not exist.
Question
The figure given below shows the marginal revenue product (MRP) of accountants in a firm.Figure 14.2
MRP = MP X MR
According to Figure 14.2, the:
A)value of the resource to the firm declines after the second unit of the resource is used.
B)marginal-physical product diminishes at every resource level if we consider the product market to be competitive.
C)law of diminishing marginal product does not apply in this case.
D)optimal number of units of the resource to be used is 3.
E)optimal number of units of the resource to be used is 7.
Question
The following table shows output per hour produced by the different units of labor.Table 14.1
The marginal revenue product of a resource is equal to the product of the marginal product of an input and marginal revenue.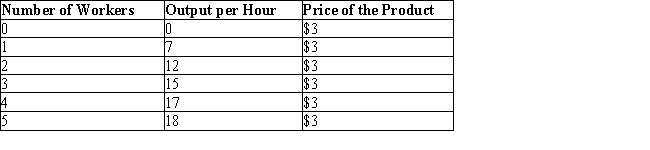
According to Table 14.1, if the wage rate is $6 per hour, how many workers should this firm hire?
A)3
B)2
C)4
D)5
E)1
The marginal revenue product of a resource is equal to the product of the marginal product of an input and marginal revenue.
According to Table 14.1, if the wage rate is $6 per hour, how many workers should this firm hire?
A)3
B)2
C)4
D)5
E)1
Question
Analysis
The following figure shows the marginal revenue product of a resource [MRP]:
Figure 14.1
In Figure 14.1, if the price of the resource is equal to 0C and the resource market is perfectly competitive, the quantity employed of the resource would be:
A)less than L2.
B)equal to L1.
C)equal to L2.
D)equal to L3.
E)more than L3.
Question
The table below shows the total output produced by different units of a resource. Assume that the resource and output markets are both perfectly competitive. The equilibrium price of the resource is $15.00, and the equilibrium price of the product is $0.50.Table 14.2
Marginal revenue product (MRP) of a resource is the product of the marginal product of the resource and the marginal revenue.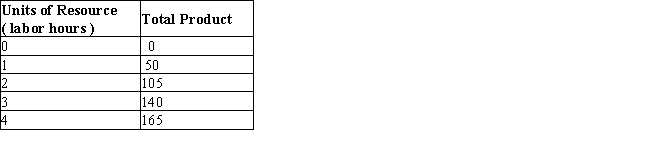
Refer to Table 14.2. How many units of the resource will a profit-maximizing firm hire?
A)Two labor hours
B)Between two and three labor hours
C)Between three and four labor hours
D)More than four labor hours
E)Three labor hours
Question
The table below shows the total output produced by different units of a resource. Assume that the resource and output markets are both perfectly competitive. The equilibrium price of the resource is $15.00, and the equilibrium price of the product is $0.50.Table 14.2
Marginal revenue product (MRP) of a resource is the product of the marginal product of the resource and the marginal revenue.
If a resource is purchased and sold in a perfectly competitive market:
A)there are a large number of resource suppliers and the resources are identical.
B)there is a single buyer of resource and the resources are identical.
C)there is a single buyer of resource and the resources are differentiated.
D)there are a large number of resource suppliers and the resources are differentiated.
E)there are a large number of resource suppliers and there is no entry or exit.
Question
The table below shows the total output produced by different units of a resource. Assume that the resource and output markets are both perfectly competitive. The equilibrium price of the resource is $15.00, and the equilibrium price of the product is $0.50.Table 14.2
Marginal revenue product (MRP) of a resource is the product of the marginal product of the resource and the marginal revenue.
Refer to Table 14.2. What is the marginal factor cost for the third unit of the resource?
A)$13.00
B)$15.00
C)$17.50
D)$195.00
E)$19.50
Marginal revenue product (MRP) of a resource is the product of the marginal product of the resource and the marginal revenue.
Refer to Table 14.2. What is the marginal factor cost for the third unit of the resource?
A)$13.00
B)$15.00
C)$17.50
D)$195.00
E)$19.50
Question
The figure given below shows the marginal revenue product (MRP) of accountants in a firm.Figure 14.2
MRP = MP X MR
A firm under any market structure maximizes profits at a point where:
A)marginal revenue product is greater than marginal factor cost.
B)marginal revenue product is equal to marginal factor cost.
C)marginal revenue product is equal to zero.
D)marginal factor cost is equal to zero.
E)marginal revenue product is less than marginal factor cost.
Question
The figure given below represents the marginal revenue product (MRP) and the marginal factor cost (MFC) of a resource in the resource market.Figure 14.3
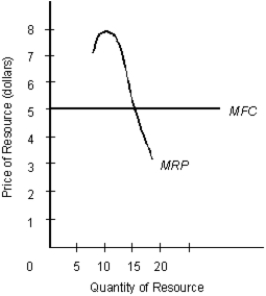
Consider the resource market shown in Figure 14.3. Given that the resource market is perfectly competitive, determine the equilibrium price of the resource.
A)$8
B)$3
C)$5
D)$4
E)Cannot be determined from the information given
Consider the resource market shown in Figure 14.3. Given that the resource market is perfectly competitive, determine the equilibrium price of the resource.
A)$8
B)$3
C)$5
D)$4
E)Cannot be determined from the information given
Question
The figure given below represents the marginal revenue product (MRP) and the marginal factor cost (MFC) of a resource in the resource market.Figure 14.3
Consider the resource market shown in Figure 14.3. Given that the resource market is perfectly competitive, how many units of the resource will be purchased when the market is in equilibrium?
A)Less than 10 units
B)10 units
C)Between 10 and 15 units
D)15 units
E)More than 15 units
Consider the resource market shown in Figure 14.3. Given that the resource market is perfectly competitive, how many units of the resource will be purchased when the market is in equilibrium?
A)Less than 10 units
B)10 units
C)Between 10 and 15 units
D)15 units
E)More than 15 units
Question
The following table shows output per hour produced by the different units of labor.Table 14.1
The marginal revenue product of a resource is equal to the product of the marginal product of an input and marginal revenue.
The structure of the product market as described by Table 14.1 is:
A)monopolistic.
B)oligopolistic.
C)perfectly competitive.
D)monopsonistic.
E)monopolistically competitive.
The marginal revenue product of a resource is equal to the product of the marginal product of an input and marginal revenue.
The structure of the product market as described by Table 14.1 is:
A)monopolistic.
B)oligopolistic.
C)perfectly competitive.
D)monopsonistic.
E)monopolistically competitive.
Question
The figure given below shows the marginal revenue product (MRP) of accountants in a firm.Figure 14.2
MRP = MP X MR
A firm will demand more units of a resource if:
A)the resource adds more to revenues than it costs.
B)the firm experiences diseconomies of scale.
C)the price of the good that uses the resource declines.
D)the resource has many substitutes.
E)the resource has few substitutes.
MRP = MP X MR
A firm will demand more units of a resource if:
A)the resource adds more to revenues than it costs.
B)the firm experiences diseconomies of scale.
C)the price of the good that uses the resource declines.
D)the resource has many substitutes.
E)the resource has few substitutes.
Question
The figure given below shows the marginal revenue product (MRP) of accountants in a firm.Figure 14.2
MRP = MP X MR
According to Figure 14.2, if the marginal cost of the resource is $600:
A)1 unit of the resource is hired.
B)3 units of the resource are hired.
C)any number of units beyond 3 units is hired.
D)zero unit of the resource is hired.
E)7 units of the resource are acquired.
MRP = MP X MR
According to Figure 14.2, if the marginal cost of the resource is $600:
A)1 unit of the resource is hired.
B)3 units of the resource are hired.
C)any number of units beyond 3 units is hired.
D)zero unit of the resource is hired.
E)7 units of the resource are acquired.
Question
The following table shows output per hour produced by the different units of labor.Table 14.1
The marginal revenue product of a resource is equal to the product of the marginal product of an input and marginal revenue.
According to Table 14.1, if the wage rate is $9 per hour, how many workers should this firm hire?
A)1
B)5
C)4
D)2
E)3
The marginal revenue product of a resource is equal to the product of the marginal product of an input and marginal revenue.
According to Table 14.1, if the wage rate is $9 per hour, how many workers should this firm hire?
A)1
B)5
C)4
D)2
E)3
Question
The following table shows output per hour produced by the different units of labor.Table 14.1
The marginal revenue product of a resource is equal to the product of the marginal product of an input and marginal revenue.
According to Table 14.1, the marginal revenue product of the:
A)fourth worker is $8.
B)fifth worker is $3.
C)first worker is $3.
D)third worker is $5.
E)second worker is $12.
The marginal revenue product of a resource is equal to the product of the marginal product of an input and marginal revenue.
According to Table 14.1, the marginal revenue product of the:
A)fourth worker is $8.
B)fifth worker is $3.
C)first worker is $3.
D)third worker is $5.
E)second worker is $12.
Question
The figure given below shows the marginal revenue product (MRP) of accountants in a firm.Figure 14.2
MRP = MP X MR
If the resource market is perfectly competitive:
A)the market demand for the resource is perfectly elastic.
B)the market demand for the resource is perfectly inelastic.
C)the suppliers can affect the input price by increasing or reducing their supply.
D)the input price to each firm is constant.
E)the supply of the resource is perfectly inelastic.
Question
The table below shows the total output produced by different units of a resource. Assume that the resource and output markets are both perfectly competitive. The equilibrium price of the resource is $15.00, and the equilibrium price of the product is $0.50.Table 14.2
Marginal revenue product (MRP) of a resource is the product of the marginal product of the resource and the marginal revenue.
Refer to Table 14.2. What is the marginal revenue product of the third unit of the resource?
A)$6.50
B)$13.00
C)$17.50
D)$70.00
E)$20.00
Marginal revenue product (MRP) of a resource is the product of the marginal product of the resource and the marginal revenue.
Refer to Table 14.2. What is the marginal revenue product of the third unit of the resource?
A)$6.50
B)$13.00
C)$17.50
D)$70.00
E)$20.00
Question
The table below shows the total output produced by different units of a resource. Assume that the resource and output markets are both perfectly competitive. The equilibrium price of the resource is $15.00, and the equilibrium price of the product is $0.50.Table 14.2
Marginal revenue product (MRP) of a resource is the product of the marginal product of the resource and the marginal revenue.
If a firm hires its fourth worker for $5 and its fifth worker for $8, then
A)the firm is a monopolist.
B)the firm must be substituting capital for labor.
C)the fifth worker must have been less productive than the fourth.
D)the firm is not maximizing its profit.
E)the labor market is not perfectly competitive.
Question
The following table shows output per hour produced by the different units of labor.Table 14.1
The marginal revenue product of a resource is equal to the product of the marginal product of an input and marginal revenue.
Refer to Table 14.1. If both the wage rate and the price of the good falls to $2, how many workers would the firm hire?
A)1
B)2
C)3
D)4
E)5
The marginal revenue product of a resource is equal to the product of the marginal product of an input and marginal revenue.
Refer to Table 14.1. If both the wage rate and the price of the good falls to $2, how many workers would the firm hire?
A)1
B)2
C)3
D)4
E)5
Question
The following table shows output per hour produced by the different units of labor.Table 14.1
The marginal revenue product of a resource is equal to the product of the marginal product of an input and marginal revenue.
After hiring 151 units of the variable input (say labor) a firm determines the marginal fixed cost (MFC) to be $0.33 and the marginal revenue product (MRP) to be $0.30. The firm should:
A)increase its production.
B)increase the use of labor.
C)decrease the use of labor.
D)produce 151 units.
E)produce 33 units of the output.
Question
The following table shows total output produced by different units of capital.Table 14.3
The marginal revenue product of a resource is the product of the marginal product of the resource and the marginal revenue.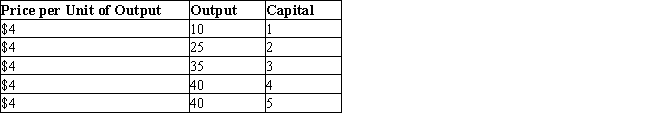
Consider a perfectly competitive firm that produces computers. Each additional worker at this firm can produce four computers. Calculate the marginal factor cost if the computers are sold for $1,000 each, and the firm is maximizing profit. (Assume that marginal revenue product is the product of marginal product of the input and the marginal revenue of the firm.)
A)$4,000
B)$500
C)$1,000
D)$1,500
E)$400
Question
The figure given below represents equilibrium in the labor market.Figure 14.5
In the figure,
VMP: Value of marginal product curve
MRP: Marginal revenue product curve
MFC: Marginal factor cost
S: Supply curve of labor
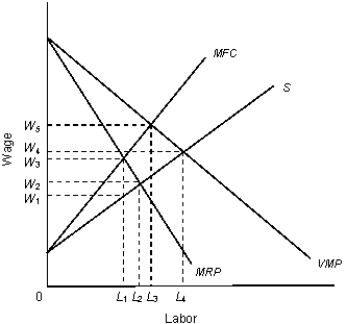
According to Figure 14.5, what is the equilibrium level of employment?
A)0 units
B)L1 units
C)L2 units
D)L3 units
E)L4 units
In the figure,
VMP: Value of marginal product curve
MRP: Marginal revenue product curve
MFC: Marginal factor cost
S: Supply curve of labor
According to Figure 14.5, what is the equilibrium level of employment?
A)0 units
B)L1 units
C)L2 units
D)L3 units
E)L4 units
Question
The following table shows the marginal productivity of different units of labor for producing a product.Table 14.4
In the table,
MR: Marginal Revenue
MPP: Marginal Physical Product
According to Table 14.4, how many laborers should be hired if the wage rate is $18? (Marginal revenue product = MPP X MR)
A)2
B)3
C)4
D)5
E)6
In the table,
MR: Marginal Revenue
MPP: Marginal Physical Product
According to Table 14.4, how many laborers should be hired if the wage rate is $18? (Marginal revenue product = MPP X MR)
A)2
B)3
C)4
D)5
E)6
Question
The figure given below represents equilibrium in the labor market.Figure 14.5
In the figure,
VMP: Value of marginal product curve
MRP: Marginal revenue product curve
MFC: Marginal factor cost
S: Supply curve of labor
Refer to Figure 14.5. What wage rate will this firm pay?
A)W1
B)W2
C)W3
D)W4
E)W5
In the figure,
VMP: Value of marginal product curve
MRP: Marginal revenue product curve
MFC: Marginal factor cost
S: Supply curve of labor
Refer to Figure 14.5. What wage rate will this firm pay?
A)W1
B)W2
C)W3
D)W4
E)W5
Question
The following table shows total output produced by different units of capital.Table 14.3
The marginal revenue product of a resource is the product of the marginal product of the resource and the marginal revenue.
The producer can raise the level of profit by hiring more units of a resource if:
A)the marginal revenue product of the resource is equal to the marginal factor cost.
B)the marginal factor cost becomes negative.
C)the marginal revenue product of the resource is greater than the marginal factor cost.
D)the marginal revenue product falls to zero.
E)the marginal revenue product of the resource is less than the marginal factor cost.
Question
The figure given below represents equilibrium in the labor market.Figure 14.5
In the figure,
VMP: Value of marginal product curve
MRP: Marginal revenue product curve
MFC: Marginal factor cost
S: Supply curve of labor
In Figure 14.5, the firm is:
A)a monopsonist in the labor market and a perfect competitor in the output market.
B)a monopsonist in the labor market and a monopolist in the output market.
C)a perfect competitor in all markets.
D)a perfect competitor in the labor market and a monopolist in the output market.
E)either a monopolist or a monopsonist, but not both.
Question
The following table shows total output produced by different units of capital.Table 14.3
The marginal revenue product of a resource is the product of the marginal product of the resource and the marginal revenue.
In a perfectly competitive labor market, a profit-maximizing firm that is also perfectly competitive in the product market will:
A)face a perfectly inelastic supply curve of labor.
B)pay a wage that is equal to the price of the product.
C)pay a wage that is equal to the marginal product of labor.
D)hire more units of labor than would a firm that sells its output in a monopoly market.
E)pay a wage equal to the marginal factor cost.
Question
The following table shows total output produced by different units of capital.Table 14.3
The marginal revenue product of a resource is the product of the marginal product of the resource and the marginal revenue.
In Table 14.3, how many units of capital will the firm hire if the price per unit of capital is $60?
A)1 unit of capital.
B)2 units of capital.
C)3 units of capital.
D)4 units of capital.
E)5 units of capital.
Question
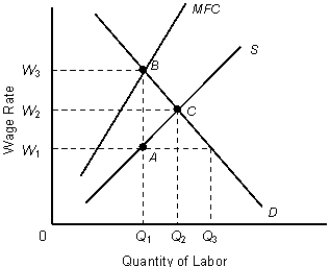
The following figure represents the equilibrium in the labor market.Figure 14.4
 In the figure,
MFC: Marginal Factor Cost curve
D: Demand or the Marginal Revenue Product curve
S: Supply curve
According to Figure 14.4, if the government imposes a minimum wage of W1, what quantity of labor will a competitive labor market hire?
A)Q1
B)Q2
C)Q3
D)Less than Q2
E)Greater than Q3
In the figure,MFC: Marginal Factor Cost curve
D: Demand or the Marginal Revenue Product curve
S: Supply curve
According to Figure 14.4, if the government imposes a minimum wage of W1, what quantity of labor will a competitive labor market hire?
A)Q1
B)Q2
C)Q3
D)Less than Q2
E)Greater than Q3
Question
The following figure represents the equilibrium in the labor market.Figure 14.4
In the figure,
MFC: Marginal Factor Cost curve
D: Demand or the Marginal Revenue Product curve
S: Supply curve
A monopsonist firm pays a price to a factor that is:
A)equal to the marginal revenue product of the factor.
B)greater than the marginal revenue product of the factor.
C)equal to the marginal factor cost.
D)greater than the marginal factor cost.
E)less than the marginal revenue product of the factor.
In the figure,MFC: Marginal Factor Cost curve
D: Demand or the Marginal Revenue Product curve
S: Supply curve
A monopsonist firm pays a price to a factor that is:
A)equal to the marginal revenue product of the factor.
B)greater than the marginal revenue product of the factor.
C)equal to the marginal factor cost.
D)greater than the marginal factor cost.
E)less than the marginal revenue product of the factor.
Question
The following figure represents the equilibrium in the labor market.Figure 14.4
In the figure,
MFC: Marginal Factor Cost curve
D: Demand or the Marginal Revenue Product curve
S: Supply curve
Refer to Figure 14.4. A competitive labor market will pay the wage rate _____ and hire _____ units of labor.
A)W1; Q1
B)W1; Q2
C)W2; Q2
D)W1; Q3
E)W3; Q1
In the figure,MFC: Marginal Factor Cost curve
D: Demand or the Marginal Revenue Product curve
S: Supply curve
Refer to Figure 14.4. A competitive labor market will pay the wage rate _____ and hire _____ units of labor.
A)W1; Q1
B)W1; Q2
C)W2; Q2
D)W1; Q3
E)W3; Q1
Question
The following figure represents the equilibrium in the labor market.Figure 14.4
In the figure,
MFC: Marginal Factor Cost curve
D: Demand or the Marginal Revenue Product curve
S: Supply curve
Refer to Figure 14.4. If the government imposes a minimum wage of W2, how many units of labor will a monopsonist hire?
A)Q2
B)Between Q2 and Q3
C)Q1
D)Q3
E)Between Q1 and Q2
In the figure,MFC: Marginal Factor Cost curve
D: Demand or the Marginal Revenue Product curve
S: Supply curve
Refer to Figure 14.4. If the government imposes a minimum wage of W2, how many units of labor will a monopsonist hire?
A)Q2
B)Between Q2 and Q3
C)Q1
D)Q3
E)Between Q1 and Q2
Question
The following table shows total output produced by different units of capital.Table 14.3
The marginal revenue product of a resource is the product of the marginal product of the resource and the marginal revenue.
A perfectly competitive employer of an input will maximize profits from the employment of the input by equating:
A)the value of the marginal product of the input with the price of the output.
B)the marginal product of the last unit of the input employed with the input price.
C)the input price with the price of the product produced.
D)the marginal revenue product of the input with the input price.
E)the marginal product of the last unit of the input employed with the price of the product produced.
Question
The following figure represents the equilibrium in the labor market.Figure 14.4
In the figure,
MFC: Marginal Factor Cost curve
D: Demand or the Marginal Revenue Product curve
S: Supply curve
Refer to Figure 14.4. A monopsonist will pay the wage rate _____ and hire _____ units of labor.
A)W2; Q2
B)W1; Q2
C)W3; Q1
D)W1; Q3
E)W1; Q1
In the figure,MFC: Marginal Factor Cost curve
D: Demand or the Marginal Revenue Product curve
S: Supply curve
Refer to Figure 14.4. A monopsonist will pay the wage rate _____ and hire _____ units of labor.
A)W2; Q2
B)W1; Q2
C)W3; Q1
D)W1; Q3
E)W1; Q1
Question
The following figure represents the equilibrium in the labor market.Figure 14.4
In the figure,
MFC: Marginal Factor Cost curve
D: Demand or the Marginal Revenue Product curve
S: Supply curve
A monopolist hiring labor in a perfectly competitive resource market is faced with a:
A)perfectly elastic demand curve for labor.
B)horizontal marginal factor cost curve.
C)perfectly inelastic demand curve for labor.
D)vertical supply curve of labor.
E)positively sloped marginal factor cost curve.
In the figure,MFC: Marginal Factor Cost curve
D: Demand or the Marginal Revenue Product curve
S: Supply curve
A monopolist hiring labor in a perfectly competitive resource market is faced with a:
A)perfectly elastic demand curve for labor.
B)horizontal marginal factor cost curve.
C)perfectly inelastic demand curve for labor.
D)vertical supply curve of labor.
E)positively sloped marginal factor cost curve.
Question
The following table shows total output produced by different units of capital.Table 14.3
The marginal revenue product of a resource is the product of the marginal product of the resource and the marginal revenue.
In Table 14.3, if there exists perfect competition in the capital market and the price per unit of capital is ten times the price of the product, the marginal factor cost at the profit maximizing level of employment is:
A)$60.
B)$50.
C)$40.
D)$30.
E)$20.
Question
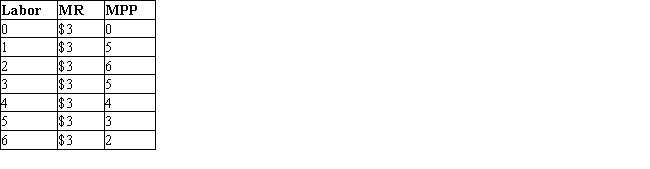
The following table shows the marginal productivity of different units of labor for producing a product.Table 14.4
In the table,
MR: Marginal Revenue
MPP: Marginal Physical Product
According to Table 14.4, what is the highest MRP the firm can reach? (MRP = MPP X MPP)
A)5
B)6
C)15
D)18
E)25
In the table,
MR: Marginal Revenue
MPP: Marginal Physical Product
According to Table 14.4, what is the highest MRP the firm can reach? (MRP = MPP X MPP)
A)5
B)6
C)15
D)18
E)25
Question
The following table shows the marginal revenue of a firm and the marginal physical product of different units of labor in a perfectly competitive labor market.Table 14.5
Note: Marginal revenue product of a resource is the product of MPP and MR.
In Table 14.5, if the wage rate is $10, how many workers will be employed by a profit-maximizing firm ?
A)1
B)2
C)3
D)4
E)5
Note: Marginal revenue product of a resource is the product of MPP and MR.
In Table 14.5, if the wage rate is $10, how many workers will be employed by a profit-maximizing firm ?
A)1
B)2
C)3
D)4
E)5
Question
The following table shows the marginal revenue of a firm and the marginal physical product of different units of labor in a perfectly competitive labor market.Table 14.5
Note: Marginal revenue product of a resource is the product of MPP and MR.
In Table 14.5, at what wage rate would one worker be hired by a profit-maximizing firm?
A)$10
B)$25
C)$30
D)$50
E)$100
Note: Marginal revenue product of a resource is the product of MPP and MR.
In Table 14.5, at what wage rate would one worker be hired by a profit-maximizing firm?
A)$10
B)$25
C)$30
D)$50
E)$100
Question
The following table shows the marginal productivity of different units of labor for producing a product.Table 14.4
In the table,
MR: Marginal Revenue
MPP: Marginal Physical Product
In Table 14.4, if marginal revenue product is equal to the product of MPP and MR, what wage rate would be consistent with a profit-maximizing firm hiring six laborers?
A)$6
B)$10
C)$12
D)$18
E)$24
In the table,
MR: Marginal Revenue
MPP: Marginal Physical Product
In Table 14.4, if marginal revenue product is equal to the product of MPP and MR, what wage rate would be consistent with a profit-maximizing firm hiring six laborers?
A)$6
B)$10
C)$12
D)$18
E)$24
Question
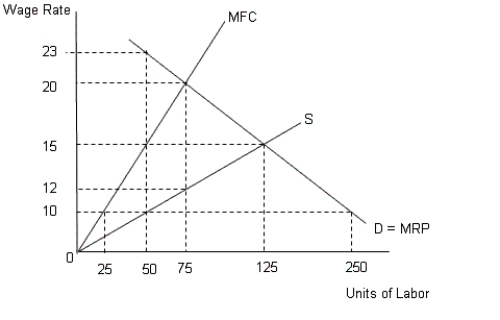
The figure given below represents equilibrium in the labor market with the demand and supply curves of labor.Figure 14.6
In the figure,
D = MRP implies demand for labor = Marginal Revenue Product
MFC represents Marginal Factor Cost curve
S represents the supply curve of labor
If the elasticity of supply of a resource is greater than zero but less than infinity, its income will comprise of:
A)only economic rent.
B)only transfer earnings.
C)salaries and traveling allowances.
D)both economic rent and transfer earnings.
E)salaries, traveling allowances, as well as other incentives.
Question
The figure given below represents equilibrium in the labor market with the demand and supply curves of labor.Figure 14.6
In the figure,
D = MRP implies demand for labor = Marginal Revenue Product
MFC represents Marginal Factor Cost curve
S represents the supply curve of labor
Which of the following statements is not true?
A)Assuming a perfectly competitive labor market, a firm selling in a monopolistic product market will have a lower marginal revenue product curve than a firm in a perfectly competitive product market.
B)The intersection of market-labor supply with market-labor demand establishes equilibrium in a perfectly competitive labor market.
C)In monopsonistic labor markets, an individual firm faces a positively sloped labor-supply curve.
D)In a perfectly competitive labor market, an individual firm can hire as many workers as it needs at the equilibrium wage rate
E)In a monopsonistic labor market, marginal revenue product is equal to the value of marginal product.
Question
The figure given below represents equilibrium in the labor market with the demand and supply curves of labor.Figure 14.6
In the figure,
D = MRP implies demand for labor = Marginal Revenue Product
MFC represents Marginal Factor Cost curve
S represents the supply curve of labor
Refer to Figure 14.6. Calculate the quantity of labor hired by a monopsonist.
A)125 laborers
B)75 laborers
C)25 laborers
D)250 laborers
E)50 laborers
Question
The figure given below represents equilibrium in the labor market with the demand and supply curves of labor.Figure 14.6
In the figure,
D = MRP implies demand for labor = Marginal Revenue Product
MFC represents Marginal Factor Cost curve
S represents the supply curve of labor
The demand for capital, as an input in production, will decrease if:
A)labor and capital are substitutes in production and the supply of labor decreases.
B)the demand for the final good it produces increases.
C)capital becomes more productive.
D)the price of capital decreases.
E)labor and capital are substitutes in production and the wage rate declines.
Question
The figure given below represents equilibrium in the labor market with the demand and supply curves of labor.Figure 14.6
In the figure,
D = MRP implies demand for labor = Marginal Revenue Product
MFC represents Marginal Factor Cost curve
S represents the supply curve of labor
The value of the marginal product is equal to the marginal revenue product under perfect competition in the product market because:
A)price is equal to average revenue.
B)price is equal to average cost.
C)marginal revenue is equal to marginal cost.
D)price is equal to marginal revenue.
E)average revenue is equal to average cost.
Question
The figure given below represents equilibrium in the labor market with the demand and supply curves of labor.Figure 14.6
In the figure,
D = MRP implies demand for labor = Marginal Revenue Product
MFC represents Marginal Factor Cost curve
S represents the supply curve of labor
If the ratio of marginal revenue product to marginal factor cost for labor is greater than that for capital, then:
A)the producer can maximize profit by hiring more units of capital.
B)the producer suffers losses by hiring more units of labor.
C)the producer does not alter the resource allocation.
D)the producer can maximize profit by hiring more units of labor.
E)the producer will earn above normal profit by hiring less units of labor.
Question
The figure given below represents equilibrium in the labor market with the demand and supply curves of labor.Figure 14.6
In the figure,
D = MRP implies demand for labor = Marginal Revenue Product
MFC represents Marginal Factor Cost curve
S represents the supply curve of labor
Earnings of a resource is termed as economic rent if:
A)it has a perfectly elastic demand.
B)it has a perfectly elastic supply.
C)it has a perfectly inelastic supply.
D)it has a perfectly inelastic demand.
E)it has no demand.
Question
The figure given below represents equilibrium in the labor market with the demand and supply curves of labor.Figure 14.6
In the figure,
D = MRP implies demand for labor = Marginal Revenue Product
MFC represents Marginal Factor Cost curve
S represents the supply curve of labor
According to Figure 14.6, what is the wage and quantity of labor hired by a competitive firm?
A)$12 and 75 laborers
B)$20 and 75 laborers
C)$15 and 125 laborers
D)$10 and 250 laborers
E)$23 and 50 laborers
Question
The figure given below represents equilibrium in the labor market with the demand and supply curves of labor.Figure 14.6
In the figure,
D = MRP implies demand for labor = Marginal Revenue Product
MFC represents Marginal Factor Cost curve
S represents the supply curve of labor
The value of the marginal product of a resource is equal to:
A)the marginal revenue of the firm, if the product market is perfectly competitive.
B)the market price of the product divided by the price of the resource.
C)the market price of the product divided by the marginal product of the resource.
D)the marginal revenue product of the resource, if the product market is perfectly competitive.
E)the marginal product of the resource divided by the price of the resource.
Question
The figure given below represents equilibrium in the labor market with the demand and supply curves of labor.Figure 14.6
In the figure,
D = MRP implies demand for labor = Marginal Revenue Product
MFC represents Marginal Factor Cost curve
S represents the supply curve of labor
The more inelastic the supply of a particular resource:
A)the higher are its transfer earnings.
B)the higher is its economic rent.
C)the higher are its total earnings.
D)the higher is the elasticity of demand for the resource.
E)the lower is the elasticity of demand for the resource.
Question
The figure given below represents equilibrium in the labor market with the demand and supply curves of labor.Figure 14.6
In the figure,
D = MRP implies demand for labor = Marginal Revenue Product
MFC represents Marginal Factor Cost curve
S represents the supply curve of labor
Other things being equal, the marginal revenue product for labor hired by a firm that is a monopolist in the output market:
A)is represented by an upward sloping curve.
B)is equal to the marginal revenue product for labor hired by a perfectly competitive firm.
C)is less than the marginal revenue product for labor hired by a perfectly competitive firm.
D)is greater than the marginal revenue product for labor hired by a perfectly competitive firm.
E)is equal to the value of marginal product of labor.
Question
The figure given below represents equilibrium in the labor market with the demand and supply curves of labor.Figure 14.6
In the figure,
D = MRP implies demand for labor = Marginal Revenue Product
MFC represents Marginal Factor Cost curve
S represents the supply curve of labor
According to Figure 14.6, if the government imposes a minimum wage of $15, what quantity of labor will a competitive firm and a monopsonist, respectively, hire?
A)50 and 25
B)50 and 75
C)75 and 125
D)125 and 250
E)50 and 125
Question
The figure given below represents equilibrium in the labor market with the demand and supply curves of labor.Figure 14.6
In the figure,
D = MRP implies demand for labor = Marginal Revenue Product
MFC represents Marginal Factor Cost curve
S represents the supply curve of labor
If a resource has a perfectly elastic supply curve then its income is termed as:
A)economic rent.
B)rental rate of capital.
C)rental income.
D)annuity.
E)transfer earnings.
Question
The figure given below represents equilibrium in the labor market with the demand and supply curves of labor.Figure 14.6
In the figure,
D = MRP implies demand for labor = Marginal Revenue Product
MFC represents Marginal Factor Cost curve
S represents the supply curve of labor
Transfer earnings of a factor is equal to its:
A)economic rent.
B)explicit cost.
C)actual earnings.
D)overhead cost.
E)opportunity cost.
In the figure,
D = MRP implies demand for labor = Marginal Revenue Product
MFC represents Marginal Factor Cost curve
S represents the supply curve of labor
Transfer earnings of a factor is equal to its:
A)economic rent.
B)explicit cost.
C)actual earnings.
D)overhead cost.
E)opportunity cost.
Question
The figure given below represents equilibrium in the labor market with the demand and supply curves of labor.Figure 14.6
In the figure,
D = MRP implies demand for labor = Marginal Revenue Product
MFC represents Marginal Factor Cost curve
S represents the supply curve of labor
A firm that was initially a monopsonist, but now has to buy from a competitive resource market will:
A)buy more amount of resources and pay a higher price for these resources.
B)buy the same amount of resources and pay a higher price for these resources.
C)buy less amount of resources and pay a lower price for these resources.
D)buy less amount of resources and pay a higher price for these resources.
E)buy more amount of resources and pay a lower price for these resources.
Question
The figure given below represents equilibrium in the labor market with the demand and supply curves of labor.Figure 14.6
In the figure,
D = MRP implies demand for labor = Marginal Revenue Product
MFC represents Marginal Factor Cost curve
S represents the supply curve of labor
According to Figure 14.6, what is the wage paid by a monopsonist?
A)$10
B)$23
C)$20
D)$12
E)$15
In the figure,
D = MRP implies demand for labor = Marginal Revenue Product
MFC represents Marginal Factor Cost curve
S represents the supply curve of labor
According to Figure 14.6, what is the wage paid by a monopsonist?
A)$10
B)$23
C)$20
D)$12
E)$15
Question
The figure given below represents equilibrium in the labor market with the demand and supply curves of labor.Figure 14.6
In the figure,
D = MRP implies demand for labor = Marginal Revenue Product
MFC represents Marginal Factor Cost curve
S represents the supply curve of labor
Which of the following statements brings out the relationship between the value of marginal product (VMP) and the marginal revenue product (MRP)?
A)They are the same for a firm selling in a perfectly competitive market structure.
B)They are the same for a firm purchasing inputs in a perfectly competitive market structure.
C)VMP is greater than MRP when a firm is perfectly competitive in the product market.
D)VMP is less than MRP when a firm is perfectly competitive in the product market.
E)They are same when a firm is a monopolist.
Question
The figure given below represents equilibrium in the labor market with the demand and supply curves of labor.Figure 14.6
In the figure,
D = MRP implies demand for labor = Marginal Revenue Product
MFC represents Marginal Factor Cost curve
S represents the supply curve of labor
An individual purchasing goods and services will allocate his expenditures so that the pleasure he gets out of spending one more dollar is the same no matter what he spends that dollar on. For a firm purchasing resources, this is the same as ensuring that:
A)the ratio between marginal revenue product and the marginal factor cost is equal for all the resources used.
B)the marginal revenue product of the resources are equal.
C)the marginal factor cost of the resources are equal.
D)the ratio between marginal revenue product and the marginal factor cost is greater than one for all resources.
E)the marginal revenue product is greater than the marginal factor cost of all resources.
Question
The figure given below represents equilibrium in the labor market with the demand and supply curves of labor.Figure 14.6
In the figure,
D = MRP implies demand for labor = Marginal Revenue Product
MFC represents Marginal Factor Cost curve
S represents the supply curve of labor
If a resource can be put to a single use and has no alternative uses then:
A)economic rents are zero.
B)transfer earnings are maximized.
C)total earnings are zero.
D)all earnings are economic rents.
E)all earnings are transfer earnings.
Question
The figure given below represents equilibrium in the labor market with the demand and supply curves of labor.Figure 14.6
In the figure,
D = MRP implies demand for labor = Marginal Revenue Product
MFC represents Marginal Factor Cost curve
S represents the supply curve of labor
If resource A and resource B are substitutes of each other and the price of resource A increases, then:
A)the price elasticity of demand for resource B will increase.
B)the demand for resource A will increase.
C)the demand for resource B will increase.
D)the price elasticity of demand for resource B will decrease.
E)the demand for resource B will decrease.

Unlock Deck
Sign up to unlock the cards in this deck!
Unlock Deck
Unlock Deck
1/110
Play
Full screen (f)
Deck 15: Resource Markets
1
In the following figure, the first panel shows a market situation prior to regulation and the second panel shows the effects of regulation.Figure 14.2
In the figure,
D: Demand curve for automobiles
S1: Supply curve of automobiles prior to regulation
S2: Supply curve of automobiles after regulation
FG: Clean up cost per unit
Goods which are demanded to produce something else are said to have a(n):
A)direct demand.
B)composite demand.
C)derived demand.
D)joint demand.
E)inelastic demand.
In the figure,D: Demand curve for automobiles
S1: Supply curve of automobiles prior to regulation
S2: Supply curve of automobiles after regulation
FG: Clean up cost per unit
Goods which are demanded to produce something else are said to have a(n):
A)direct demand.
B)composite demand.
C)derived demand.
D)joint demand.
E)inelastic demand.
derived demand.
2
In the following figure, the first panel shows a market situation prior to regulation and the second panel shows the effects of regulation.Figure 14.2
In the figure,
D: Demand curve for automobiles
S1: Supply curve of automobiles prior to regulation
S2: Supply curve of automobiles after regulation
FG: Clean up cost per unit
When studying the market for resources, it is important to understand that:
A)resources are wanted not for themselves, but for what they produce.
B)demand for resources is generally inelastic in nature.
C)derived demand does not apply to the resource market.
D)resource markets do not conform to the laws of supply and demand as other markets do.
E)supply is much more important than demand in determining the price of a resource.
In the figure,D: Demand curve for automobiles
S1: Supply curve of automobiles prior to regulation
S2: Supply curve of automobiles after regulation
FG: Clean up cost per unit
When studying the market for resources, it is important to understand that:
A)resources are wanted not for themselves, but for what they produce.
B)demand for resources is generally inelastic in nature.
C)derived demand does not apply to the resource market.
D)resource markets do not conform to the laws of supply and demand as other markets do.
E)supply is much more important than demand in determining the price of a resource.
resources are wanted not for themselves, but for what they produce.
3
In the following figure, the first panel shows a market situation prior to regulation and the second panel shows the effects of regulation.Figure 14.2
In the figure,
D: Demand curve for automobiles
S1: Supply curve of automobiles prior to regulation
S2: Supply curve of automobiles after regulation
FG: Clean up cost per unit
Assume that labor is the only variable input and that an additional input of labor increases total output from 72 to 78 units. If the product sells for $6 per unit in a perfectly competitive market, then the marginal revenue product of this additional worker is:
A)$78.
B)$72.
C)$36.
D)$39.
E)$6.
In the figure,D: Demand curve for automobiles
S1: Supply curve of automobiles prior to regulation
S2: Supply curve of automobiles after regulation
FG: Clean up cost per unit
Assume that labor is the only variable input and that an additional input of labor increases total output from 72 to 78 units. If the product sells for $6 per unit in a perfectly competitive market, then the marginal revenue product of this additional worker is:
A)$78.
B)$72.
C)$36.
D)$39.
E)$6.
$36.
4
In the following figure, the first panel shows a market situation prior to regulation and the second panel shows the effects of regulation.Figure 14.2
In the figure,
D: Demand curve for automobiles
S1: Supply curve of automobiles prior to regulation
S2: Supply curve of automobiles after regulation
FG: Clean up cost per unit
The buyers and sellers in a resource market are:
A)household and firms respectively.
B)banks and farmers respectively.
C)households and land owners respectively.
D)firms and household respectively.
E)exporters and importers respectively.
In the figure,D: Demand curve for automobiles
S1: Supply curve of automobiles prior to regulation
S2: Supply curve of automobiles after regulation
FG: Clean up cost per unit
The buyers and sellers in a resource market are:
A)household and firms respectively.
B)banks and farmers respectively.
C)households and land owners respectively.
D)firms and household respectively.
E)exporters and importers respectively.
Unlock Deck
Unlock for access to all 110 flashcards in this deck.
Unlock Deck
k this deck
5
In the following figure, the first panel shows a market situation prior to regulation and the second panel shows the effects of regulation.Figure 14.2
In the figure,
D: Demand curve for automobiles
S1: Supply curve of automobiles prior to regulation
S2: Supply curve of automobiles after regulation
FG: Clean up cost per unit
Intel microchips are an input in the production of a computer. When the demand for the computer declines:
A)the quantity demanded of Intel microchips increases.
B)the quantity demanded of Intel microchips declines.
C)the demand for Intel microchips increases.
D)the demand for Intel microchips decreases.
E)there is no change in the demand for the Intel microchips.
In the figure,D: Demand curve for automobiles
S1: Supply curve of automobiles prior to regulation
S2: Supply curve of automobiles after regulation
FG: Clean up cost per unit
Intel microchips are an input in the production of a computer. When the demand for the computer declines:
A)the quantity demanded of Intel microchips increases.
B)the quantity demanded of Intel microchips declines.
C)the demand for Intel microchips increases.
D)the demand for Intel microchips decreases.
E)there is no change in the demand for the Intel microchips.
Unlock Deck
Unlock for access to all 110 flashcards in this deck.
Unlock Deck
k this deck
6
In the following figure, the first panel shows a market situation prior to regulation and the second panel shows the effects of regulation.Figure 14.2
In the figure,
D: Demand curve for automobiles
S1: Supply curve of automobiles prior to regulation
S2: Supply curve of automobiles after regulation
FG: Clean up cost per unit
The marginal revenue product (MRP) is the:
A)value of the additional output that an extra unit of a resource can produce.
B)cost of hiring an additional unit of a resource.
C)extra cost of producing an additional unit of output.
D)increase in total output when an additional unit of an input is hired.
E)change in total revenue when an additional unit of a good is sold.
In the figure,D: Demand curve for automobiles
S1: Supply curve of automobiles prior to regulation
S2: Supply curve of automobiles after regulation
FG: Clean up cost per unit
The marginal revenue product (MRP) is the:
A)value of the additional output that an extra unit of a resource can produce.
B)cost of hiring an additional unit of a resource.
C)extra cost of producing an additional unit of output.
D)increase in total output when an additional unit of an input is hired.
E)change in total revenue when an additional unit of a good is sold.
Unlock Deck
Unlock for access to all 110 flashcards in this deck.
Unlock Deck
k this deck
7
In the following figure, the first panel shows a market situation prior to regulation and the second panel shows the effects of regulation.Figure 14.2
In the figure,
D: Demand curve for automobiles
S1: Supply curve of automobiles prior to regulation
S2: Supply curve of automobiles after regulation
FG: Clean up cost per unit
The demand curve for labor indicates that:
A)as the real wage rate increases, employers will hire more workers.
B)as the nominal wage rate increases, employers will hire more workers.
C)as the nominal wage rate decreases, the real wage rate increases.
D)as the real wage rate increases, employers will hire fewer workers.
E)as the real wage rate decreases the nominal wage rate increases.
In the figure,D: Demand curve for automobiles
S1: Supply curve of automobiles prior to regulation
S2: Supply curve of automobiles after regulation
FG: Clean up cost per unit
The demand curve for labor indicates that:
A)as the real wage rate increases, employers will hire more workers.
B)as the nominal wage rate increases, employers will hire more workers.
C)as the nominal wage rate decreases, the real wage rate increases.
D)as the real wage rate increases, employers will hire fewer workers.
E)as the real wage rate decreases the nominal wage rate increases.
Unlock Deck
Unlock for access to all 110 flashcards in this deck.
Unlock Deck
k this deck
8
In the following figure, the first panel shows a market situation prior to regulation and the second panel shows the effects of regulation.Figure 14.2
In the figure,
D: Demand curve for automobiles
S1: Supply curve of automobiles prior to regulation
S2: Supply curve of automobiles after regulation
FG: Clean up cost per unit
The resource market is the same as the product market except that, in the resource market:
A)the demand curve slopes upward.
B)the households are the sellers and the firms are the buyers.
C)there is no substitution effect.
D)the supply curve is perfectly inelastic.
E)there is no income effect.
In the figure,D: Demand curve for automobiles
S1: Supply curve of automobiles prior to regulation
S2: Supply curve of automobiles after regulation
FG: Clean up cost per unit
The resource market is the same as the product market except that, in the resource market:
A)the demand curve slopes upward.
B)the households are the sellers and the firms are the buyers.
C)there is no substitution effect.
D)the supply curve is perfectly inelastic.
E)there is no income effect.
Unlock Deck
Unlock for access to all 110 flashcards in this deck.
Unlock Deck
k this deck
9
In the following figure, the first panel shows a market situation prior to regulation and the second panel shows the effects of regulation.Figure 14.2
In the figure,
D: Demand curve for automobiles
S1: Supply curve of automobiles prior to regulation
S2: Supply curve of automobiles after regulation
FG: Clean up cost per unit
Which of the following statements best illustrates the relationship between the market for products and the market for resources?
A)An increase in the price of cameras will decrease the demand for film.
B)As income rises, people demand relatively smaller amounts of food.
C)An increase in the demand for textiles will increase the demand for textile workers.
D)An increase in the price of butter will cause more people to buy margarine.
E)A decrease in the demand for tea will increase the demand for coffee.
In the figure,D: Demand curve for automobiles
S1: Supply curve of automobiles prior to regulation
S2: Supply curve of automobiles after regulation
FG: Clean up cost per unit
Which of the following statements best illustrates the relationship between the market for products and the market for resources?
A)An increase in the price of cameras will decrease the demand for film.
B)As income rises, people demand relatively smaller amounts of food.
C)An increase in the demand for textiles will increase the demand for textile workers.
D)An increase in the price of butter will cause more people to buy margarine.
E)A decrease in the demand for tea will increase the demand for coffee.
Unlock Deck
Unlock for access to all 110 flashcards in this deck.
Unlock Deck
k this deck
10
In the following figure, the first panel shows a market situation prior to regulation and the second panel shows the effects of regulation.Figure 14.2
In the figure,
D: Demand curve for automobiles
S1: Supply curve of automobiles prior to regulation
S2: Supply curve of automobiles after regulation
FG: Clean up cost per unit
In the market for resources, demand and supply:
A)do not behave in the same way as they do in product markets.
B)behave in exactly the same way as they do in product markets.
C)curves usually do not intersect at equilibrium.
D)are both controlled by firms.
E)are both controlled by households
In the figure,D: Demand curve for automobiles
S1: Supply curve of automobiles prior to regulation
S2: Supply curve of automobiles after regulation
FG: Clean up cost per unit
In the market for resources, demand and supply:
A)do not behave in the same way as they do in product markets.
B)behave in exactly the same way as they do in product markets.
C)curves usually do not intersect at equilibrium.
D)are both controlled by firms.
E)are both controlled by households
Unlock Deck
Unlock for access to all 110 flashcards in this deck.
Unlock Deck
k this deck
11
In the following figure, the first panel shows a market situation prior to regulation and the second panel shows the effects of regulation.Figure 14.2
In the figure,
D: Demand curve for automobiles
S1: Supply curve of automobiles prior to regulation
S2: Supply curve of automobiles after regulation
FG: Clean up cost per unit
Which of the following goods is likely to have a derived demand?
A)Tractor
B)T-shirt
C)Italian food
D)Residential buildings
E)Cigarettes
In the figure,D: Demand curve for automobiles
S1: Supply curve of automobiles prior to regulation
S2: Supply curve of automobiles after regulation
FG: Clean up cost per unit
Which of the following goods is likely to have a derived demand?
A)Tractor
B)T-shirt
C)Italian food
D)Residential buildings
E)Cigarettes
Unlock Deck
Unlock for access to all 110 flashcards in this deck.
Unlock Deck
k this deck
12
In the following figure, the first panel shows a market situation prior to regulation and the second panel shows the effects of regulation.Figure 14.2
In the figure,
D: Demand curve for automobiles
S1: Supply curve of automobiles prior to regulation
S2: Supply curve of automobiles after regulation
FG: Clean up cost per unit
An automobile manufacturer uses land, labor, capital, and entrepreneurial ability to produce cars and trucks. If the price of trucks increases, the automobile manufacturer would not _____.
A)pay a lower wage rate to labor
B)increase truck production
C)hire more workers
D)increase capital used in production
E)increase land used in production
In the figure,D: Demand curve for automobiles
S1: Supply curve of automobiles prior to regulation
S2: Supply curve of automobiles after regulation
FG: Clean up cost per unit
An automobile manufacturer uses land, labor, capital, and entrepreneurial ability to produce cars and trucks. If the price of trucks increases, the automobile manufacturer would not _____.
A)pay a lower wage rate to labor
B)increase truck production
C)hire more workers
D)increase capital used in production
E)increase land used in production
Unlock Deck
Unlock for access to all 110 flashcards in this deck.
Unlock Deck
k this deck
13
In the following figure, the first panel shows a market situation prior to regulation and the second panel shows the effects of regulation.Figure 14.2
In the figure,
D: Demand curve for automobiles
S1: Supply curve of automobiles prior to regulation
S2: Supply curve of automobiles after regulation
FG: Clean up cost per unit
Firms are consumers and households are producers in the _____ market.
A)stock
B)bond
C)labor
D)product
E)underground
In the figure,D: Demand curve for automobiles
S1: Supply curve of automobiles prior to regulation
S2: Supply curve of automobiles after regulation
FG: Clean up cost per unit
Firms are consumers and households are producers in the _____ market.
A)stock
B)bond
C)labor
D)product
E)underground
Unlock Deck
Unlock for access to all 110 flashcards in this deck.
Unlock Deck
k this deck
14
In the following figure, the first panel shows a market situation prior to regulation and the second panel shows the effects of regulation.Figure 14.2
In the figure,
D: Demand curve for automobiles
S1: Supply curve of automobiles prior to regulation
S2: Supply curve of automobiles after regulation
FG: Clean up cost per unit
The marginal revenue product curve of a factor is negatively sloped because:
A)the additional revenue generated from an additional unit of a factor remains constant as more resources are hired.
B)the additional revenue generated from an additional unit of a factor declines as more resources are hired.
C)the additional revenue generated from an additional unit of a factor usually becomes zero as more resources are hired.
D)the additional revenue generated from an additional unit of a factor increases as more resources are hired.
E)the additional revenue generated from an additional unit of a factor doubles every time new resources are hired.
In the figure,D: Demand curve for automobiles
S1: Supply curve of automobiles prior to regulation
S2: Supply curve of automobiles after regulation
FG: Clean up cost per unit
The marginal revenue product curve of a factor is negatively sloped because:
A)the additional revenue generated from an additional unit of a factor remains constant as more resources are hired.
B)the additional revenue generated from an additional unit of a factor declines as more resources are hired.
C)the additional revenue generated from an additional unit of a factor usually becomes zero as more resources are hired.
D)the additional revenue generated from an additional unit of a factor increases as more resources are hired.
E)the additional revenue generated from an additional unit of a factor doubles every time new resources are hired.
Unlock Deck
Unlock for access to all 110 flashcards in this deck.
Unlock Deck
k this deck
15
In the following figure, the first panel shows a market situation prior to regulation and the second panel shows the effects of regulation.Figure 14.2
In the figure,
D: Demand curve for automobiles
S1: Supply curve of automobiles prior to regulation
S2: Supply curve of automobiles after regulation
FG: Clean up cost per unit
The marginal factor cost (MFC) is the:
A)value of the additional output that an extra unit of a resource can produce.
B)additional cost of employing an additional unit of a resource.
C)additional cost of producing an additional unit of output.
D)the ratio of the total fixed cost to the total cost of production.
E)ratio of total cost to the total amount of resources employed.
In the figure,D: Demand curve for automobiles
S1: Supply curve of automobiles prior to regulation
S2: Supply curve of automobiles after regulation
FG: Clean up cost per unit
The marginal factor cost (MFC) is the:
A)value of the additional output that an extra unit of a resource can produce.
B)additional cost of employing an additional unit of a resource.
C)additional cost of producing an additional unit of output.
D)the ratio of the total fixed cost to the total cost of production.
E)ratio of total cost to the total amount of resources employed.
Unlock Deck
Unlock for access to all 110 flashcards in this deck.
Unlock Deck
k this deck
16
In the following figure, the first panel shows a market situation prior to regulation and the second panel shows the effects of regulation.Figure 14.2
In the figure,
D: Demand curve for automobiles
S1: Supply curve of automobiles prior to regulation
S2: Supply curve of automobiles after regulation
FG: Clean up cost per unit
If the market price of the product that employs labor in production increases:
A)the marginal product of labor increases.
B)the demand curve for labor shifts to the left.
C)the price of labor decreases.
D)the marginal revenue product of labor increases.
E)the supply curve of labor shifts to the left.
In the figure,D: Demand curve for automobiles
S1: Supply curve of automobiles prior to regulation
S2: Supply curve of automobiles after regulation
FG: Clean up cost per unit
If the market price of the product that employs labor in production increases:
A)the marginal product of labor increases.
B)the demand curve for labor shifts to the left.
C)the price of labor decreases.
D)the marginal revenue product of labor increases.
E)the supply curve of labor shifts to the left.
Unlock Deck
Unlock for access to all 110 flashcards in this deck.
Unlock Deck
k this deck
17
In the following figure, the first panel shows a market situation prior to regulation and the second panel shows the effects of regulation.Figure 14.2
In the figure,
D: Demand curve for automobiles
S1: Supply curve of automobiles prior to regulation
S2: Supply curve of automobiles after regulation
FG: Clean up cost per unit
Tools and equipments used in production are:
A)natural resources.
B)entrepreneurial resources.
C)human capital.
D)capital resources.
E)labor resources.
In the figure,D: Demand curve for automobiles
S1: Supply curve of automobiles prior to regulation
S2: Supply curve of automobiles after regulation
FG: Clean up cost per unit
Tools and equipments used in production are:
A)natural resources.
B)entrepreneurial resources.
C)human capital.
D)capital resources.
E)labor resources.
Unlock Deck
Unlock for access to all 110 flashcards in this deck.
Unlock Deck
k this deck
18
Analysis
The following figure shows the marginal revenue product of a resource [MRP]:
Figure 14.1
Assume that the resource market shown in Figure 14.1 is perfectly competitive. The MRP curve for the resource is negatively sloped because:
A)the firm can sell more units of a good only at lower prices.
B)the marginal physical product curve for the resource is negatively sloped.
C)the resource gives increasing returns as more of the resource is employed.
D)the firm hires more units of the resource at a higher price.
E)average productivity of the resource increases as more units of the resource are used.
Unlock Deck
Unlock for access to all 110 flashcards in this deck.
Unlock Deck
k this deck
19
In the following figure, the first panel shows a market situation prior to regulation and the second panel shows the effects of regulation.Figure 14.2
In the figure,
D: Demand curve for automobiles
S1: Supply curve of automobiles prior to regulation
S2: Supply curve of automobiles after regulation
FG: Clean up cost per unit
The price of a resource declines when:
A)both the demand for and the supply of the resource declines in the same proportion.
B)demand remaining constant, supply of the resource declines.
C)supply remaining constant, the demand for the resource declines.
D)both the demand for and the supply of the resource increases in the same proportion.
E)both the demand for and the supply of the resource declines, but supply falls by a greater proportion than demand.
In the figure,D: Demand curve for automobiles
S1: Supply curve of automobiles prior to regulation
S2: Supply curve of automobiles after regulation
FG: Clean up cost per unit
The price of a resource declines when:
A)both the demand for and the supply of the resource declines in the same proportion.
B)demand remaining constant, supply of the resource declines.
C)supply remaining constant, the demand for the resource declines.
D)both the demand for and the supply of the resource increases in the same proportion.
E)both the demand for and the supply of the resource declines, but supply falls by a greater proportion than demand.
Unlock Deck
Unlock for access to all 110 flashcards in this deck.
Unlock Deck
k this deck
20
In the following figure, the first panel shows a market situation prior to regulation and the second panel shows the effects of regulation.Figure 14.2
In the figure,
D: Demand curve for automobiles
S1: Supply curve of automobiles prior to regulation
S2: Supply curve of automobiles after regulation
FG: Clean up cost per unit
During the recession witnessed in early 2001, many firms laid off their employees and downsized. The reason for this decrease in the demand for employees was:
A)a reduction in the demand for final goods.
B)a reduction in the prices of final goods.
C)an increase in the demand for final goods.
D)an increase in the prices of final goods.
E)the incompetency and poor performance of the employees.
In the figure,D: Demand curve for automobiles
S1: Supply curve of automobiles prior to regulation
S2: Supply curve of automobiles after regulation
FG: Clean up cost per unit
During the recession witnessed in early 2001, many firms laid off their employees and downsized. The reason for this decrease in the demand for employees was:
A)a reduction in the demand for final goods.
B)a reduction in the prices of final goods.
C)an increase in the demand for final goods.
D)an increase in the prices of final goods.
E)the incompetency and poor performance of the employees.
Unlock Deck
Unlock for access to all 110 flashcards in this deck.
Unlock Deck
k this deck
21
The figure given below shows the marginal revenue product (MRP) of accountants in a firm.Figure 14.2
MRP = MP X MR
Under perfect competition in the resource market, the marginal factor cost curve:
A)is positively sloped.
B)is vertical.
C)is negatively sloped.
D)is horizontal.
E)does not exist.
MRP = MP X MR
Under perfect competition in the resource market, the marginal factor cost curve:
A)is positively sloped.
B)is vertical.
C)is negatively sloped.
D)is horizontal.
E)does not exist.
Unlock Deck
Unlock for access to all 110 flashcards in this deck.
Unlock Deck
k this deck
22
The figure given below shows the marginal revenue product (MRP) of accountants in a firm.Figure 14.2
MRP = MP X MR
According to Figure 14.2, the:
A)value of the resource to the firm declines after the second unit of the resource is used.
B)marginal-physical product diminishes at every resource level if we consider the product market to be competitive.
C)law of diminishing marginal product does not apply in this case.
D)optimal number of units of the resource to be used is 3.
E)optimal number of units of the resource to be used is 7.
Unlock Deck
Unlock for access to all 110 flashcards in this deck.
Unlock Deck
k this deck
23
The following table shows output per hour produced by the different units of labor.Table 14.1
The marginal revenue product of a resource is equal to the product of the marginal product of an input and marginal revenue.
According to Table 14.1, if the wage rate is $6 per hour, how many workers should this firm hire?
A)3
B)2
C)4
D)5
E)1
The marginal revenue product of a resource is equal to the product of the marginal product of an input and marginal revenue.
According to Table 14.1, if the wage rate is $6 per hour, how many workers should this firm hire?
A)3
B)2
C)4
D)5
E)1
Unlock Deck
Unlock for access to all 110 flashcards in this deck.
Unlock Deck
k this deck
24
Analysis
The following figure shows the marginal revenue product of a resource [MRP]:
Figure 14.1
In Figure 14.1, if the price of the resource is equal to 0C and the resource market is perfectly competitive, the quantity employed of the resource would be:
A)less than L2.
B)equal to L1.
C)equal to L2.
D)equal to L3.
E)more than L3.
Unlock Deck
Unlock for access to all 110 flashcards in this deck.
Unlock Deck
k this deck
25
The table below shows the total output produced by different units of a resource. Assume that the resource and output markets are both perfectly competitive. The equilibrium price of the resource is $15.00, and the equilibrium price of the product is $0.50.Table 14.2
Marginal revenue product (MRP) of a resource is the product of the marginal product of the resource and the marginal revenue.
Refer to Table 14.2. How many units of the resource will a profit-maximizing firm hire?
A)Two labor hours
B)Between two and three labor hours
C)Between three and four labor hours
D)More than four labor hours
E)Three labor hours
Unlock Deck
Unlock for access to all 110 flashcards in this deck.
Unlock Deck
k this deck
26
The table below shows the total output produced by different units of a resource. Assume that the resource and output markets are both perfectly competitive. The equilibrium price of the resource is $15.00, and the equilibrium price of the product is $0.50.Table 14.2
Marginal revenue product (MRP) of a resource is the product of the marginal product of the resource and the marginal revenue.
If a resource is purchased and sold in a perfectly competitive market:
A)there are a large number of resource suppliers and the resources are identical.
B)there is a single buyer of resource and the resources are identical.
C)there is a single buyer of resource and the resources are differentiated.
D)there are a large number of resource suppliers and the resources are differentiated.
E)there are a large number of resource suppliers and there is no entry or exit.
Unlock Deck
Unlock for access to all 110 flashcards in this deck.
Unlock Deck
k this deck
27
The table below shows the total output produced by different units of a resource. Assume that the resource and output markets are both perfectly competitive. The equilibrium price of the resource is $15.00, and the equilibrium price of the product is $0.50.Table 14.2
Marginal revenue product (MRP) of a resource is the product of the marginal product of the resource and the marginal revenue.
Refer to Table 14.2. What is the marginal factor cost for the third unit of the resource?
A)$13.00
B)$15.00
C)$17.50
D)$195.00
E)$19.50
Marginal revenue product (MRP) of a resource is the product of the marginal product of the resource and the marginal revenue.
Refer to Table 14.2. What is the marginal factor cost for the third unit of the resource?
A)$13.00
B)$15.00
C)$17.50
D)$195.00
E)$19.50
Unlock Deck
Unlock for access to all 110 flashcards in this deck.
Unlock Deck
k this deck
28
The figure given below shows the marginal revenue product (MRP) of accountants in a firm.Figure 14.2
MRP = MP X MR
A firm under any market structure maximizes profits at a point where:
A)marginal revenue product is greater than marginal factor cost.
B)marginal revenue product is equal to marginal factor cost.
C)marginal revenue product is equal to zero.
D)marginal factor cost is equal to zero.
E)marginal revenue product is less than marginal factor cost.
Unlock Deck
Unlock for access to all 110 flashcards in this deck.
Unlock Deck
k this deck
29
The figure given below represents the marginal revenue product (MRP) and the marginal factor cost (MFC) of a resource in the resource market.Figure 14.3
Consider the resource market shown in Figure 14.3. Given that the resource market is perfectly competitive, determine the equilibrium price of the resource.
A)$8
B)$3
C)$5
D)$4
E)Cannot be determined from the information given
Consider the resource market shown in Figure 14.3. Given that the resource market is perfectly competitive, determine the equilibrium price of the resource.
A)$8
B)$3
C)$5
D)$4
E)Cannot be determined from the information given
Unlock Deck
Unlock for access to all 110 flashcards in this deck.
Unlock Deck
k this deck
30
The figure given below represents the marginal revenue product (MRP) and the marginal factor cost (MFC) of a resource in the resource market.Figure 14.3
Consider the resource market shown in Figure 14.3. Given that the resource market is perfectly competitive, how many units of the resource will be purchased when the market is in equilibrium?
A)Less than 10 units
B)10 units
C)Between 10 and 15 units
D)15 units
E)More than 15 units
Consider the resource market shown in Figure 14.3. Given that the resource market is perfectly competitive, how many units of the resource will be purchased when the market is in equilibrium?
A)Less than 10 units
B)10 units
C)Between 10 and 15 units
D)15 units
E)More than 15 units
Unlock Deck
Unlock for access to all 110 flashcards in this deck.
Unlock Deck
k this deck
31
The following table shows output per hour produced by the different units of labor.Table 14.1
The marginal revenue product of a resource is equal to the product of the marginal product of an input and marginal revenue.
The structure of the product market as described by Table 14.1 is:
A)monopolistic.
B)oligopolistic.
C)perfectly competitive.
D)monopsonistic.
E)monopolistically competitive.
The marginal revenue product of a resource is equal to the product of the marginal product of an input and marginal revenue.
The structure of the product market as described by Table 14.1 is:
A)monopolistic.
B)oligopolistic.
C)perfectly competitive.
D)monopsonistic.
E)monopolistically competitive.
Unlock Deck
Unlock for access to all 110 flashcards in this deck.
Unlock Deck
k this deck
32
The figure given below shows the marginal revenue product (MRP) of accountants in a firm.Figure 14.2
MRP = MP X MR
A firm will demand more units of a resource if:
A)the resource adds more to revenues than it costs.
B)the firm experiences diseconomies of scale.
C)the price of the good that uses the resource declines.
D)the resource has many substitutes.
E)the resource has few substitutes.
MRP = MP X MR
A firm will demand more units of a resource if:
A)the resource adds more to revenues than it costs.
B)the firm experiences diseconomies of scale.
C)the price of the good that uses the resource declines.
D)the resource has many substitutes.
E)the resource has few substitutes.
Unlock Deck
Unlock for access to all 110 flashcards in this deck.
Unlock Deck
k this deck
33
The figure given below shows the marginal revenue product (MRP) of accountants in a firm.Figure 14.2
MRP = MP X MR
According to Figure 14.2, if the marginal cost of the resource is $600:
A)1 unit of the resource is hired.
B)3 units of the resource are hired.
C)any number of units beyond 3 units is hired.
D)zero unit of the resource is hired.
E)7 units of the resource are acquired.
MRP = MP X MR
According to Figure 14.2, if the marginal cost of the resource is $600:
A)1 unit of the resource is hired.
B)3 units of the resource are hired.
C)any number of units beyond 3 units is hired.
D)zero unit of the resource is hired.
E)7 units of the resource are acquired.
Unlock Deck
Unlock for access to all 110 flashcards in this deck.
Unlock Deck
k this deck
34
The following table shows output per hour produced by the different units of labor.Table 14.1
The marginal revenue product of a resource is equal to the product of the marginal product of an input and marginal revenue.
According to Table 14.1, if the wage rate is $9 per hour, how many workers should this firm hire?
A)1
B)5
C)4
D)2
E)3
The marginal revenue product of a resource is equal to the product of the marginal product of an input and marginal revenue.
According to Table 14.1, if the wage rate is $9 per hour, how many workers should this firm hire?
A)1
B)5
C)4
D)2
E)3
Unlock Deck
Unlock for access to all 110 flashcards in this deck.
Unlock Deck
k this deck
35
The following table shows output per hour produced by the different units of labor.Table 14.1
The marginal revenue product of a resource is equal to the product of the marginal product of an input and marginal revenue.
According to Table 14.1, the marginal revenue product of the:
A)fourth worker is $8.
B)fifth worker is $3.
C)first worker is $3.
D)third worker is $5.
E)second worker is $12.
The marginal revenue product of a resource is equal to the product of the marginal product of an input and marginal revenue.
According to Table 14.1, the marginal revenue product of the:
A)fourth worker is $8.
B)fifth worker is $3.
C)first worker is $3.
D)third worker is $5.
E)second worker is $12.
Unlock Deck
Unlock for access to all 110 flashcards in this deck.
Unlock Deck
k this deck
36
The figure given below shows the marginal revenue product (MRP) of accountants in a firm.Figure 14.2
MRP = MP X MR
If the resource market is perfectly competitive:
A)the market demand for the resource is perfectly elastic.
B)the market demand for the resource is perfectly inelastic.
C)the suppliers can affect the input price by increasing or reducing their supply.
D)the input price to each firm is constant.
E)the supply of the resource is perfectly inelastic.
Unlock Deck
Unlock for access to all 110 flashcards in this deck.
Unlock Deck
k this deck
37
The table below shows the total output produced by different units of a resource. Assume that the resource and output markets are both perfectly competitive. The equilibrium price of the resource is $15.00, and the equilibrium price of the product is $0.50.Table 14.2
Marginal revenue product (MRP) of a resource is the product of the marginal product of the resource and the marginal revenue.
Refer to Table 14.2. What is the marginal revenue product of the third unit of the resource?
A)$6.50
B)$13.00
C)$17.50
D)$70.00
E)$20.00
Marginal revenue product (MRP) of a resource is the product of the marginal product of the resource and the marginal revenue.
Refer to Table 14.2. What is the marginal revenue product of the third unit of the resource?
A)$6.50
B)$13.00
C)$17.50
D)$70.00
E)$20.00
Unlock Deck
Unlock for access to all 110 flashcards in this deck.
Unlock Deck
k this deck
38
The table below shows the total output produced by different units of a resource. Assume that the resource and output markets are both perfectly competitive. The equilibrium price of the resource is $15.00, and the equilibrium price of the product is $0.50.Table 14.2
Marginal revenue product (MRP) of a resource is the product of the marginal product of the resource and the marginal revenue.
If a firm hires its fourth worker for $5 and its fifth worker for $8, then
A)the firm is a monopolist.
B)the firm must be substituting capital for labor.
C)the fifth worker must have been less productive than the fourth.
D)the firm is not maximizing its profit.
E)the labor market is not perfectly competitive.
Unlock Deck
Unlock for access to all 110 flashcards in this deck.
Unlock Deck
k this deck
39
The following table shows output per hour produced by the different units of labor.Table 14.1
The marginal revenue product of a resource is equal to the product of the marginal product of an input and marginal revenue.
Refer to Table 14.1. If both the wage rate and the price of the good falls to $2, how many workers would the firm hire?
A)1
B)2
C)3
D)4
E)5
The marginal revenue product of a resource is equal to the product of the marginal product of an input and marginal revenue.
Refer to Table 14.1. If both the wage rate and the price of the good falls to $2, how many workers would the firm hire?
A)1
B)2
C)3
D)4
E)5
Unlock Deck
Unlock for access to all 110 flashcards in this deck.
Unlock Deck
k this deck
40
The following table shows output per hour produced by the different units of labor.Table 14.1
The marginal revenue product of a resource is equal to the product of the marginal product of an input and marginal revenue.
After hiring 151 units of the variable input (say labor) a firm determines the marginal fixed cost (MFC) to be $0.33 and the marginal revenue product (MRP) to be $0.30. The firm should:
A)increase its production.
B)increase the use of labor.
C)decrease the use of labor.
D)produce 151 units.
E)produce 33 units of the output.
Unlock Deck
Unlock for access to all 110 flashcards in this deck.
Unlock Deck
k this deck
41
The following table shows total output produced by different units of capital.Table 14.3
The marginal revenue product of a resource is the product of the marginal product of the resource and the marginal revenue.
Consider a perfectly competitive firm that produces computers. Each additional worker at this firm can produce four computers. Calculate the marginal factor cost if the computers are sold for $1,000 each, and the firm is maximizing profit. (Assume that marginal revenue product is the product of marginal product of the input and the marginal revenue of the firm.)
A)$4,000
B)$500
C)$1,000
D)$1,500
E)$400
Unlock Deck
Unlock for access to all 110 flashcards in this deck.
Unlock Deck
k this deck
42
The figure given below represents equilibrium in the labor market.Figure 14.5
In the figure,
VMP: Value of marginal product curve
MRP: Marginal revenue product curve
MFC: Marginal factor cost
S: Supply curve of labor
According to Figure 14.5, what is the equilibrium level of employment?
A)0 units
B)L1 units
C)L2 units
D)L3 units
E)L4 units
In the figure,
VMP: Value of marginal product curve
MRP: Marginal revenue product curve
MFC: Marginal factor cost
S: Supply curve of labor
According to Figure 14.5, what is the equilibrium level of employment?
A)0 units
B)L1 units
C)L2 units
D)L3 units
E)L4 units
Unlock Deck
Unlock for access to all 110 flashcards in this deck.
Unlock Deck
k this deck
43
The following table shows the marginal productivity of different units of labor for producing a product.Table 14.4
In the table,
MR: Marginal Revenue
MPP: Marginal Physical Product
According to Table 14.4, how many laborers should be hired if the wage rate is $18? (Marginal revenue product = MPP X MR)
A)2
B)3
C)4
D)5
E)6
In the table,
MR: Marginal Revenue
MPP: Marginal Physical Product
According to Table 14.4, how many laborers should be hired if the wage rate is $18? (Marginal revenue product = MPP X MR)
A)2
B)3
C)4
D)5
E)6
Unlock Deck
Unlock for access to all 110 flashcards in this deck.
Unlock Deck
k this deck
44
The figure given below represents equilibrium in the labor market.Figure 14.5
In the figure,
VMP: Value of marginal product curve
MRP: Marginal revenue product curve
MFC: Marginal factor cost
S: Supply curve of labor
Refer to Figure 14.5. What wage rate will this firm pay?
A)W1
B)W2
C)W3
D)W4
E)W5
In the figure,
VMP: Value of marginal product curve
MRP: Marginal revenue product curve
MFC: Marginal factor cost
S: Supply curve of labor
Refer to Figure 14.5. What wage rate will this firm pay?
A)W1
B)W2
C)W3
D)W4
E)W5
Unlock Deck
Unlock for access to all 110 flashcards in this deck.
Unlock Deck
k this deck
45
The following table shows total output produced by different units of capital.Table 14.3
The marginal revenue product of a resource is the product of the marginal product of the resource and the marginal revenue.
The producer can raise the level of profit by hiring more units of a resource if:
A)the marginal revenue product of the resource is equal to the marginal factor cost.
B)the marginal factor cost becomes negative.
C)the marginal revenue product of the resource is greater than the marginal factor cost.
D)the marginal revenue product falls to zero.
E)the marginal revenue product of the resource is less than the marginal factor cost.
Unlock Deck
Unlock for access to all 110 flashcards in this deck.
Unlock Deck
k this deck
46
The figure given below represents equilibrium in the labor market.Figure 14.5
In the figure,
VMP: Value of marginal product curve
MRP: Marginal revenue product curve
MFC: Marginal factor cost
S: Supply curve of labor
In Figure 14.5, the firm is:
A)a monopsonist in the labor market and a perfect competitor in the output market.
B)a monopsonist in the labor market and a monopolist in the output market.
C)a perfect competitor in all markets.
D)a perfect competitor in the labor market and a monopolist in the output market.
E)either a monopolist or a monopsonist, but not both.
Unlock Deck
Unlock for access to all 110 flashcards in this deck.
Unlock Deck
k this deck
47
The following table shows total output produced by different units of capital.Table 14.3
The marginal revenue product of a resource is the product of the marginal product of the resource and the marginal revenue.
In a perfectly competitive labor market, a profit-maximizing firm that is also perfectly competitive in the product market will:
A)face a perfectly inelastic supply curve of labor.
B)pay a wage that is equal to the price of the product.
C)pay a wage that is equal to the marginal product of labor.
D)hire more units of labor than would a firm that sells its output in a monopoly market.
E)pay a wage equal to the marginal factor cost.
Unlock Deck
Unlock for access to all 110 flashcards in this deck.
Unlock Deck
k this deck
48
The following table shows total output produced by different units of capital.Table 14.3
The marginal revenue product of a resource is the product of the marginal product of the resource and the marginal revenue.
In Table 14.3, how many units of capital will the firm hire if the price per unit of capital is $60?
A)1 unit of capital.
B)2 units of capital.
C)3 units of capital.
D)4 units of capital.
E)5 units of capital.
Unlock Deck
Unlock for access to all 110 flashcards in this deck.
Unlock Deck
k this deck
49
The following figure represents the equilibrium in the labor market.Figure 14.4
In the figure,
MFC: Marginal Factor Cost curve
D: Demand or the Marginal Revenue Product curve
S: Supply curve
According to Figure 14.4, if the government imposes a minimum wage of W1, what quantity of labor will a competitive labor market hire?
A)Q1
B)Q2
C)Q3
D)Less than Q2
E)Greater than Q3
In the figure,MFC: Marginal Factor Cost curve
D: Demand or the Marginal Revenue Product curve
S: Supply curve
According to Figure 14.4, if the government imposes a minimum wage of W1, what quantity of labor will a competitive labor market hire?
A)Q1
B)Q2
C)Q3
D)Less than Q2
E)Greater than Q3
Unlock Deck
Unlock for access to all 110 flashcards in this deck.
Unlock Deck
k this deck
50
The following figure represents the equilibrium in the labor market.Figure 14.4
In the figure,
MFC: Marginal Factor Cost curve
D: Demand or the Marginal Revenue Product curve
S: Supply curve
A monopsonist firm pays a price to a factor that is:
A)equal to the marginal revenue product of the factor.
B)greater than the marginal revenue product of the factor.
C)equal to the marginal factor cost.
D)greater than the marginal factor cost.
E)less than the marginal revenue product of the factor.
In the figure,MFC: Marginal Factor Cost curve
D: Demand or the Marginal Revenue Product curve
S: Supply curve
A monopsonist firm pays a price to a factor that is:
A)equal to the marginal revenue product of the factor.
B)greater than the marginal revenue product of the factor.
C)equal to the marginal factor cost.
D)greater than the marginal factor cost.
E)less than the marginal revenue product of the factor.
Unlock Deck
Unlock for access to all 110 flashcards in this deck.
Unlock Deck
k this deck
51
The following figure represents the equilibrium in the labor market.Figure 14.4
In the figure,
MFC: Marginal Factor Cost curve
D: Demand or the Marginal Revenue Product curve
S: Supply curve
Refer to Figure 14.4. A competitive labor market will pay the wage rate _____ and hire _____ units of labor.
A)W1; Q1
B)W1; Q2
C)W2; Q2
D)W1; Q3
E)W3; Q1
In the figure,MFC: Marginal Factor Cost curve
D: Demand or the Marginal Revenue Product curve
S: Supply curve
Refer to Figure 14.4. A competitive labor market will pay the wage rate _____ and hire _____ units of labor.
A)W1; Q1
B)W1; Q2
C)W2; Q2
D)W1; Q3
E)W3; Q1
Unlock Deck
Unlock for access to all 110 flashcards in this deck.
Unlock Deck
k this deck
52
The following figure represents the equilibrium in the labor market.Figure 14.4
In the figure,
MFC: Marginal Factor Cost curve
D: Demand or the Marginal Revenue Product curve
S: Supply curve
Refer to Figure 14.4. If the government imposes a minimum wage of W2, how many units of labor will a monopsonist hire?
A)Q2
B)Between Q2 and Q3
C)Q1
D)Q3
E)Between Q1 and Q2
In the figure,MFC: Marginal Factor Cost curve
D: Demand or the Marginal Revenue Product curve
S: Supply curve
Refer to Figure 14.4. If the government imposes a minimum wage of W2, how many units of labor will a monopsonist hire?
A)Q2
B)Between Q2 and Q3
C)Q1
D)Q3
E)Between Q1 and Q2
Unlock Deck
Unlock for access to all 110 flashcards in this deck.
Unlock Deck
k this deck
53
The following table shows total output produced by different units of capital.Table 14.3
The marginal revenue product of a resource is the product of the marginal product of the resource and the marginal revenue.
A perfectly competitive employer of an input will maximize profits from the employment of the input by equating:
A)the value of the marginal product of the input with the price of the output.
B)the marginal product of the last unit of the input employed with the input price.
C)the input price with the price of the product produced.
D)the marginal revenue product of the input with the input price.
E)the marginal product of the last unit of the input employed with the price of the product produced.
Unlock Deck
Unlock for access to all 110 flashcards in this deck.
Unlock Deck
k this deck
54
The following figure represents the equilibrium in the labor market.Figure 14.4
In the figure,
MFC: Marginal Factor Cost curve
D: Demand or the Marginal Revenue Product curve
S: Supply curve
Refer to Figure 14.4. A monopsonist will pay the wage rate _____ and hire _____ units of labor.
A)W2; Q2
B)W1; Q2
C)W3; Q1
D)W1; Q3
E)W1; Q1
In the figure,MFC: Marginal Factor Cost curve
D: Demand or the Marginal Revenue Product curve
S: Supply curve
Refer to Figure 14.4. A monopsonist will pay the wage rate _____ and hire _____ units of labor.
A)W2; Q2
B)W1; Q2
C)W3; Q1
D)W1; Q3
E)W1; Q1
Unlock Deck
Unlock for access to all 110 flashcards in this deck.
Unlock Deck
k this deck
55
The following figure represents the equilibrium in the labor market.Figure 14.4
In the figure,
MFC: Marginal Factor Cost curve
D: Demand or the Marginal Revenue Product curve
S: Supply curve
A monopolist hiring labor in a perfectly competitive resource market is faced with a:
A)perfectly elastic demand curve for labor.
B)horizontal marginal factor cost curve.
C)perfectly inelastic demand curve for labor.
D)vertical supply curve of labor.
E)positively sloped marginal factor cost curve.
In the figure,MFC: Marginal Factor Cost curve
D: Demand or the Marginal Revenue Product curve
S: Supply curve
A monopolist hiring labor in a perfectly competitive resource market is faced with a:
A)perfectly elastic demand curve for labor.
B)horizontal marginal factor cost curve.
C)perfectly inelastic demand curve for labor.
D)vertical supply curve of labor.
E)positively sloped marginal factor cost curve.
Unlock Deck
Unlock for access to all 110 flashcards in this deck.
Unlock Deck
k this deck
56
The following table shows total output produced by different units of capital.Table 14.3
The marginal revenue product of a resource is the product of the marginal product of the resource and the marginal revenue.
In Table 14.3, if there exists perfect competition in the capital market and the price per unit of capital is ten times the price of the product, the marginal factor cost at the profit maximizing level of employment is:
A)$60.
B)$50.
C)$40.
D)$30.
E)$20.
Unlock Deck
Unlock for access to all 110 flashcards in this deck.
Unlock Deck
k this deck
57
The following table shows the marginal productivity of different units of labor for producing a product.Table 14.4
In the table,
MR: Marginal Revenue
MPP: Marginal Physical Product
According to Table 14.4, what is the highest MRP the firm can reach? (MRP = MPP X MPP)
A)5
B)6
C)15
D)18
E)25
In the table,
MR: Marginal Revenue
MPP: Marginal Physical Product
According to Table 14.4, what is the highest MRP the firm can reach? (MRP = MPP X MPP)
A)5
B)6
C)15
D)18
E)25
Unlock Deck
Unlock for access to all 110 flashcards in this deck.
Unlock Deck
k this deck
58
The following table shows the marginal revenue of a firm and the marginal physical product of different units of labor in a perfectly competitive labor market.Table 14.5
Note: Marginal revenue product of a resource is the product of MPP and MR.
In Table 14.5, if the wage rate is $10, how many workers will be employed by a profit-maximizing firm ?
A)1
B)2
C)3
D)4
E)5
Note: Marginal revenue product of a resource is the product of MPP and MR.
In Table 14.5, if the wage rate is $10, how many workers will be employed by a profit-maximizing firm ?
A)1
B)2
C)3
D)4
E)5
Unlock Deck
Unlock for access to all 110 flashcards in this deck.
Unlock Deck
k this deck
59
The following table shows the marginal revenue of a firm and the marginal physical product of different units of labor in a perfectly competitive labor market.Table 14.5
Note: Marginal revenue product of a resource is the product of MPP and MR.
In Table 14.5, at what wage rate would one worker be hired by a profit-maximizing firm?
A)$10
B)$25
C)$30
D)$50
E)$100
Note: Marginal revenue product of a resource is the product of MPP and MR.
In Table 14.5, at what wage rate would one worker be hired by a profit-maximizing firm?
A)$10
B)$25
C)$30
D)$50
E)$100
Unlock Deck
Unlock for access to all 110 flashcards in this deck.
Unlock Deck
k this deck
60
The following table shows the marginal productivity of different units of labor for producing a product.Table 14.4
In the table,
MR: Marginal Revenue
MPP: Marginal Physical Product
In Table 14.4, if marginal revenue product is equal to the product of MPP and MR, what wage rate would be consistent with a profit-maximizing firm hiring six laborers?
A)$6
B)$10
C)$12
D)$18
E)$24
In the table,
MR: Marginal Revenue
MPP: Marginal Physical Product
In Table 14.4, if marginal revenue product is equal to the product of MPP and MR, what wage rate would be consistent with a profit-maximizing firm hiring six laborers?
A)$6
B)$10
C)$12
D)$18
E)$24
Unlock Deck
Unlock for access to all 110 flashcards in this deck.
Unlock Deck
k this deck
61
The figure given below represents equilibrium in the labor market with the demand and supply curves of labor.Figure 14.6
In the figure,
D = MRP implies demand for labor = Marginal Revenue Product
MFC represents Marginal Factor Cost curve
S represents the supply curve of labor
If the elasticity of supply of a resource is greater than zero but less than infinity, its income will comprise of:
A)only economic rent.
B)only transfer earnings.
C)salaries and traveling allowances.
D)both economic rent and transfer earnings.
E)salaries, traveling allowances, as well as other incentives.
Unlock Deck
Unlock for access to all 110 flashcards in this deck.
Unlock Deck
k this deck
62
The figure given below represents equilibrium in the labor market with the demand and supply curves of labor.Figure 14.6
In the figure,
D = MRP implies demand for labor = Marginal Revenue Product
MFC represents Marginal Factor Cost curve
S represents the supply curve of labor
Which of the following statements is not true?
A)Assuming a perfectly competitive labor market, a firm selling in a monopolistic product market will have a lower marginal revenue product curve than a firm in a perfectly competitive product market.
B)The intersection of market-labor supply with market-labor demand establishes equilibrium in a perfectly competitive labor market.
C)In monopsonistic labor markets, an individual firm faces a positively sloped labor-supply curve.
D)In a perfectly competitive labor market, an individual firm can hire as many workers as it needs at the equilibrium wage rate
E)In a monopsonistic labor market, marginal revenue product is equal to the value of marginal product.
Unlock Deck
Unlock for access to all 110 flashcards in this deck.
Unlock Deck
k this deck
63
The figure given below represents equilibrium in the labor market with the demand and supply curves of labor.Figure 14.6
In the figure,
D = MRP implies demand for labor = Marginal Revenue Product
MFC represents Marginal Factor Cost curve
S represents the supply curve of labor
Refer to Figure 14.6. Calculate the quantity of labor hired by a monopsonist.
A)125 laborers
B)75 laborers
C)25 laborers
D)250 laborers
E)50 laborers
Unlock Deck
Unlock for access to all 110 flashcards in this deck.
Unlock Deck
k this deck
64
The figure given below represents equilibrium in the labor market with the demand and supply curves of labor.Figure 14.6
In the figure,
D = MRP implies demand for labor = Marginal Revenue Product
MFC represents Marginal Factor Cost curve
S represents the supply curve of labor
The demand for capital, as an input in production, will decrease if:
A)labor and capital are substitutes in production and the supply of labor decreases.
B)the demand for the final good it produces increases.
C)capital becomes more productive.
D)the price of capital decreases.
E)labor and capital are substitutes in production and the wage rate declines.
Unlock Deck
Unlock for access to all 110 flashcards in this deck.
Unlock Deck
k this deck
65
The figure given below represents equilibrium in the labor market with the demand and supply curves of labor.Figure 14.6
In the figure,
D = MRP implies demand for labor = Marginal Revenue Product
MFC represents Marginal Factor Cost curve
S represents the supply curve of labor
The value of the marginal product is equal to the marginal revenue product under perfect competition in the product market because:
A)price is equal to average revenue.
B)price is equal to average cost.
C)marginal revenue is equal to marginal cost.
D)price is equal to marginal revenue.
E)average revenue is equal to average cost.
Unlock Deck
Unlock for access to all 110 flashcards in this deck.
Unlock Deck
k this deck
66
The figure given below represents equilibrium in the labor market with the demand and supply curves of labor.Figure 14.6
In the figure,
D = MRP implies demand for labor = Marginal Revenue Product
MFC represents Marginal Factor Cost curve
S represents the supply curve of labor
If the ratio of marginal revenue product to marginal factor cost for labor is greater than that for capital, then:
A)the producer can maximize profit by hiring more units of capital.
B)the producer suffers losses by hiring more units of labor.
C)the producer does not alter the resource allocation.
D)the producer can maximize profit by hiring more units of labor.
E)the producer will earn above normal profit by hiring less units of labor.
Unlock Deck
Unlock for access to all 110 flashcards in this deck.
Unlock Deck
k this deck
67
The figure given below represents equilibrium in the labor market with the demand and supply curves of labor.Figure 14.6
In the figure,
D = MRP implies demand for labor = Marginal Revenue Product
MFC represents Marginal Factor Cost curve
S represents the supply curve of labor
Earnings of a resource is termed as economic rent if:
A)it has a perfectly elastic demand.
B)it has a perfectly elastic supply.
C)it has a perfectly inelastic supply.
D)it has a perfectly inelastic demand.
E)it has no demand.
Unlock Deck
Unlock for access to all 110 flashcards in this deck.
Unlock Deck
k this deck
68
The figure given below represents equilibrium in the labor market with the demand and supply curves of labor.Figure 14.6
In the figure,
D = MRP implies demand for labor = Marginal Revenue Product
MFC represents Marginal Factor Cost curve
S represents the supply curve of labor
According to Figure 14.6, what is the wage and quantity of labor hired by a competitive firm?
A)$12 and 75 laborers
B)$20 and 75 laborers
C)$15 and 125 laborers
D)$10 and 250 laborers
E)$23 and 50 laborers
Unlock Deck
Unlock for access to all 110 flashcards in this deck.
Unlock Deck
k this deck
69
The figure given below represents equilibrium in the labor market with the demand and supply curves of labor.Figure 14.6
In the figure,
D = MRP implies demand for labor = Marginal Revenue Product
MFC represents Marginal Factor Cost curve
S represents the supply curve of labor
The value of the marginal product of a resource is equal to:
A)the marginal revenue of the firm, if the product market is perfectly competitive.
B)the market price of the product divided by the price of the resource.
C)the market price of the product divided by the marginal product of the resource.
D)the marginal revenue product of the resource, if the product market is perfectly competitive.
E)the marginal product of the resource divided by the price of the resource.
Unlock Deck
Unlock for access to all 110 flashcards in this deck.
Unlock Deck
k this deck
70
The figure given below represents equilibrium in the labor market with the demand and supply curves of labor.Figure 14.6
In the figure,
D = MRP implies demand for labor = Marginal Revenue Product
MFC represents Marginal Factor Cost curve
S represents the supply curve of labor
The more inelastic the supply of a particular resource:
A)the higher are its transfer earnings.
B)the higher is its economic rent.
C)the higher are its total earnings.
D)the higher is the elasticity of demand for the resource.
E)the lower is the elasticity of demand for the resource.
Unlock Deck
Unlock for access to all 110 flashcards in this deck.
Unlock Deck
k this deck
71
The figure given below represents equilibrium in the labor market with the demand and supply curves of labor.Figure 14.6
In the figure,
D = MRP implies demand for labor = Marginal Revenue Product
MFC represents Marginal Factor Cost curve
S represents the supply curve of labor
Other things being equal, the marginal revenue product for labor hired by a firm that is a monopolist in the output market:
A)is represented by an upward sloping curve.
B)is equal to the marginal revenue product for labor hired by a perfectly competitive firm.
C)is less than the marginal revenue product for labor hired by a perfectly competitive firm.
D)is greater than the marginal revenue product for labor hired by a perfectly competitive firm.
E)is equal to the value of marginal product of labor.
Unlock Deck
Unlock for access to all 110 flashcards in this deck.
Unlock Deck
k this deck
72
The figure given below represents equilibrium in the labor market with the demand and supply curves of labor.Figure 14.6
In the figure,
D = MRP implies demand for labor = Marginal Revenue Product
MFC represents Marginal Factor Cost curve
S represents the supply curve of labor
According to Figure 14.6, if the government imposes a minimum wage of $15, what quantity of labor will a competitive firm and a monopsonist, respectively, hire?
A)50 and 25
B)50 and 75
C)75 and 125
D)125 and 250
E)50 and 125
Unlock Deck
Unlock for access to all 110 flashcards in this deck.
Unlock Deck
k this deck
73
The figure given below represents equilibrium in the labor market with the demand and supply curves of labor.Figure 14.6
In the figure,
D = MRP implies demand for labor = Marginal Revenue Product
MFC represents Marginal Factor Cost curve
S represents the supply curve of labor
If a resource has a perfectly elastic supply curve then its income is termed as:
A)economic rent.
B)rental rate of capital.
C)rental income.
D)annuity.
E)transfer earnings.
Unlock Deck
Unlock for access to all 110 flashcards in this deck.
Unlock Deck
k this deck
74
The figure given below represents equilibrium in the labor market with the demand and supply curves of labor.Figure 14.6
In the figure,
D = MRP implies demand for labor = Marginal Revenue Product
MFC represents Marginal Factor Cost curve
S represents the supply curve of labor
Transfer earnings of a factor is equal to its:
A)economic rent.
B)explicit cost.
C)actual earnings.
D)overhead cost.
E)opportunity cost.
In the figure,
D = MRP implies demand for labor = Marginal Revenue Product
MFC represents Marginal Factor Cost curve
S represents the supply curve of labor
Transfer earnings of a factor is equal to its:
A)economic rent.
B)explicit cost.
C)actual earnings.
D)overhead cost.
E)opportunity cost.
Unlock Deck
Unlock for access to all 110 flashcards in this deck.
Unlock Deck
k this deck
75
The figure given below represents equilibrium in the labor market with the demand and supply curves of labor.Figure 14.6
In the figure,
D = MRP implies demand for labor = Marginal Revenue Product
MFC represents Marginal Factor Cost curve
S represents the supply curve of labor
A firm that was initially a monopsonist, but now has to buy from a competitive resource market will:
A)buy more amount of resources and pay a higher price for these resources.
B)buy the same amount of resources and pay a higher price for these resources.
C)buy less amount of resources and pay a lower price for these resources.
D)buy less amount of resources and pay a higher price for these resources.
E)buy more amount of resources and pay a lower price for these resources.
Unlock Deck
Unlock for access to all 110 flashcards in this deck.
Unlock Deck
k this deck
76
The figure given below represents equilibrium in the labor market with the demand and supply curves of labor.Figure 14.6
In the figure,
D = MRP implies demand for labor = Marginal Revenue Product
MFC represents Marginal Factor Cost curve
S represents the supply curve of labor
According to Figure 14.6, what is the wage paid by a monopsonist?
A)$10
B)$23
C)$20
D)$12
E)$15
In the figure,
D = MRP implies demand for labor = Marginal Revenue Product
MFC represents Marginal Factor Cost curve
S represents the supply curve of labor
According to Figure 14.6, what is the wage paid by a monopsonist?
A)$10
B)$23
C)$20
D)$12
E)$15
Unlock Deck
Unlock for access to all 110 flashcards in this deck.
Unlock Deck
k this deck
77
The figure given below represents equilibrium in the labor market with the demand and supply curves of labor.Figure 14.6
In the figure,
D = MRP implies demand for labor = Marginal Revenue Product
MFC represents Marginal Factor Cost curve
S represents the supply curve of labor
Which of the following statements brings out the relationship between the value of marginal product (VMP) and the marginal revenue product (MRP)?
A)They are the same for a firm selling in a perfectly competitive market structure.
B)They are the same for a firm purchasing inputs in a perfectly competitive market structure.
C)VMP is greater than MRP when a firm is perfectly competitive in the product market.
D)VMP is less than MRP when a firm is perfectly competitive in the product market.
E)They are same when a firm is a monopolist.
Unlock Deck
Unlock for access to all 110 flashcards in this deck.
Unlock Deck
k this deck
78
The figure given below represents equilibrium in the labor market with the demand and supply curves of labor.Figure 14.6
In the figure,
D = MRP implies demand for labor = Marginal Revenue Product
MFC represents Marginal Factor Cost curve
S represents the supply curve of labor
An individual purchasing goods and services will allocate his expenditures so that the pleasure he gets out of spending one more dollar is the same no matter what he spends that dollar on. For a firm purchasing resources, this is the same as ensuring that:
A)the ratio between marginal revenue product and the marginal factor cost is equal for all the resources used.
B)the marginal revenue product of the resources are equal.
C)the marginal factor cost of the resources are equal.
D)the ratio between marginal revenue product and the marginal factor cost is greater than one for all resources.
E)the marginal revenue product is greater than the marginal factor cost of all resources.
Unlock Deck
Unlock for access to all 110 flashcards in this deck.
Unlock Deck
k this deck
79
The figure given below represents equilibrium in the labor market with the demand and supply curves of labor.Figure 14.6
In the figure,
D = MRP implies demand for labor = Marginal Revenue Product
MFC represents Marginal Factor Cost curve
S represents the supply curve of labor
If a resource can be put to a single use and has no alternative uses then:
A)economic rents are zero.
B)transfer earnings are maximized.
C)total earnings are zero.
D)all earnings are economic rents.
E)all earnings are transfer earnings.
Unlock Deck
Unlock for access to all 110 flashcards in this deck.
Unlock Deck
k this deck
80
The figure given below represents equilibrium in the labor market with the demand and supply curves of labor.Figure 14.6
In the figure,
D = MRP implies demand for labor = Marginal Revenue Product
MFC represents Marginal Factor Cost curve
S represents the supply curve of labor
If resource A and resource B are substitutes of each other and the price of resource A increases, then:
A)the price elasticity of demand for resource B will increase.
B)the demand for resource A will increase.
C)the demand for resource B will increase.
D)the price elasticity of demand for resource B will decrease.
E)the demand for resource B will decrease.
Unlock Deck
Unlock for access to all 110 flashcards in this deck.
Unlock Deck
k this deck
Unlock Deck
Unlock for access to all 110 flashcards in this deck.


