Deck 14: Antitrust and Regulation
Full screen (f)
Question
In an antitrust lawsuit, which of the following parties is entitled to receive treble damages?
A)The Antitrust Division of the Justice Department
B)The Federal Trade Commission
C)Private plaintiffs
D)State attorney generals
E)The Department of Labor
Question
Which of the following is true of the per se rule?
A)The per se rule was used by U.S. courts from 1914 until the 1920s.
B)The per se rule had the effect of making antitrust policy more liberal.
C)According to the per se rule, activities that were potentially monopolizing tactics were illegal.
D)The per se rule did not allow the mere existence of anti-competitive activities to be sufficient evidence for a guilty verdict.
E)The per se rule was revived by Bush administration.
Question
Which of the following entities is able to sue a firm for alleged antitrust misbehavior in the U.S.?
A)Department of Illegal Affairs
B)Department of State
C)Department of Homeland Security
D)Department of Justice
E)Department of Labor
Question
The U.S. Justice Department, on the basis of the Herfindahl index, classifies the industries with the value:
A)below 500 as highly competitive; 500-1000 as moderately competitive; and above 1000 as highly concentrated.
B)below 1000 as highly competitive; 1000-1500 as moderately competitive; and above 1500 as highly concentrated.
C)below 500 as highly competitive; 500-1500 as moderately competitive; and above 1500 as highly concentrated.
D)below 1000 as highly competitive; 1000-1800 as moderately competitive; and above 1800 as highly concentrated.
E)below 1500 as highly competitive; 1500-2000 as moderately competitive; and above 2000 as highly concentrated.
Question
The first phase of antitrust policy in the U.S. began with the passage of the Sherman Antitrust Act in 1890. To judge a firm's action, the courts in this period used:
A)a per se rule.
B)a rule of reason.
C)a rule of thumb.
D)rules of order.
E)strict enforcement rule.
Question
Which of the following is most likely to happen if the Federal Trade Commission (FTC) wins a suit against alleged violators of antitrust law?
A)The FTC will receive compensation up to three times the damage caused.
B)The FTC will not be able to impose substantial penalties.
C)The FTC will force firms to break up through dissolution.
D)The FTC will force firms to merge together.
E)The FTC will file criminal actions that may result in fines but not prison sentences.
Question
What are the three phases of antitrust policy in the United States, since 1890?
A)1890 to 1914, the rule of reason; 1914 to the early 1980s, per se; since then, the rule of reason
B)1890 to 1914, per se; 1914 to the early 1980s, the rule of reason; since then, per se
C)1890 to 1914, the rule of reason; 1914 to the early 1980s, per se; since then, no antitrust policy
D)1890 to 1914, the rule of reason; 1914 to the early 1980s, per se; since then, a period of rate of return regulation
E)1890 to 1914, the rule of reason; 1914 to the early 1980s, per se; since then, a period of nationalization
Question
Antitrust policy is used to describe government policies and programs that are designed to:
A)promote the creation of trusts, or combinations of independent firms.
B)control the growth of monopoly and enhance competition.
C)deal with the threat of competitive practices to public interests.
D)create an environment in which the government will distrust firms.
E)create an environment in which firms will distrust the government.
Question
Which of the following is true of Antitrust policy?
A)Antitrust policy prohibits agreements that allow free trade.
B)Antitrust policy restricts abusive behavior by a firm dominating a market.
C)Antitrust policy allows anti-competitive practices.
D)Antitrust policy restricts subsidies in goods and services.
E)Antitrust policy creates trade barriers like tariffs and quota.
Question
The antitrust laws in the United States were created in the late 1800s as a result of :
A)the emergence of large and dominant businesses in railroads, steel, oil, mining and finance.
B)the government decision to take responsibility for the improvement of trade deficit.
C)the first illegal cartel, created in late 1800s.
D)a steep decline in prices of primary goods in the United States.
E)the threats of an external aggression received by the country.
Question
Which of the following does the Sherman Antitrust Act forbid?
A)Monopolization or attempts to monopolize
B)All types of price discrimination
C)Competition among firms
D)Unfair methods of competition
E)Privatization of government owned firms
Question
Under George W. Bush's administration, antitrust policy:
A)became much more strict.
B)prohibited every merger attempts.
C)focused increasingly on environmental concerns.
D)became more relaxed.
E)ignored financial regulation and corporate scandals.
Question
Under the second phase of antitrust policy that began in 1914 in the U.S., the courts used _____ in order to judge the firms' actions.
A)a rule of reason
B)the rule of 72
C)a rule of thirds
D)a per se rule
E)the rule of law
Question
The most reliable measure of market concentration is:
A)the Cost of Living index.
B)the Herfindahl-Hirschman index.
C)the Market index.
D)the Market-Value weighted index.
E)the Wholesale Price index.
Question
A market is said to be concentrated when:
A)the degree of competition in the market increases.
B)many firms supply to a small number of consumers.
C)the firms producing identical goods are clustered in a particular location.
D)a firm or a few firms are able to dictate the competitive conditions in a market.
E)there is a huge immigration of workers from neighboring areas.
Question
Which of the following practices is restricted by the antitrust laws of the United States?
A)Merger of smaller firms into a large firm
B)Entry of new firms in the long run
C)Standardization of products in a market
D)Exit of non-performing firms in the long run
E)Quality differentiation by competitive firms
Question
Which of the following practices is not restricted by the antitrust law in the United States?
A)Contracts and conspiracies in restraint of trade
B)Attempts to monopolize a market
C)Mergers that substantially reduces competition
D)Unfair or deceptive acts of competition
E)All forms of quality discrimination
Question
Which of the following laws was enacted to forbid monopolization and attempts to monopolize?
A)The Anti-Monopoly Act
B)The Sherman Antitrust Act
C)The Trade Act
D)The National Banking Act
E)The Celler-Kefauver Act
Question
Which of the following are the three laws that define the U.S government's approach to antitrust?
A)The Wilmington, Jackson, and International Trade Commission Acts
B)The Springfield, Clayton, and Trade Commission Acts
C)The Sherman, Clayton, and Federal Trade Commission Acts
D)The Sherman, Jackson, and Regional Trade Commission Acts
E)The Jackson, Charleston and Sherman Monopoly Restrictive Trade Acts
Question
The judicial doctrine, being a monopoly or attempting to monopolize is not in itself illegal; to be illegal, an action had to be shown to have negative economic effects, is called:
A)the "big is bad" policy.
B)the per se rule.
C)predatory price-cutting policy.
D)the rule of law.
E)the rule of reason.
Question
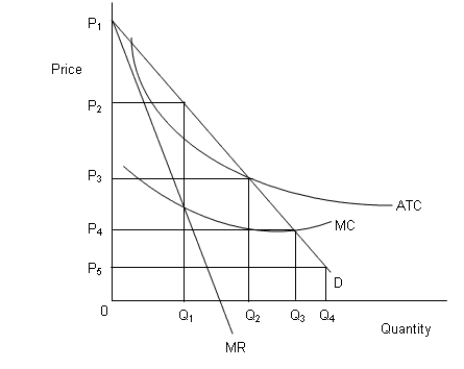
The figure below shows revenue and cost curves of a natural monopoly firm.Figure 14.1
 In the figure,
D: Demand curve
MR: Marginal revenue curve
MC: Marginal cost curve
ATC: Average total cost curve
Refer to Figure 14.1. Identify the fair-rate-of-return price.
A)P5
B)P2
C)P4
D)P1
E)P3
In the figure,D: Demand curve
MR: Marginal revenue curve
MC: Marginal cost curve
ATC: Average total cost curve
Refer to Figure 14.1. Identify the fair-rate-of-return price.
A)P5
B)P2
C)P4
D)P1
E)P3
Question
One necessary step in demonstrating monopolistic behavior is to define the market. In this process, defendants would:
A)claim that the market was not in equilibrium.
B)want the market defined as narrowly as possible.
C)deny that a market existed.
D)assert that the market was not stable.
E)want the market defined as broadly as possible.
Question
A Herfindahl index of 5,000 would indicate:
A)a monopoly.
B)a duopoly (two firms) with equal shares.
C)an oligopoly with three firms.
D)a monopolistically competitive industry.
E)a perfectly competitive market.
Question
A monopolistic industry will have a Herfindahl index value of:
A)1.
B)100.
C)500.
D)1000.
E)10.
Question
The figure below shows revenue and cost curves of a natural monopoly firm.Figure 14.1
In the figure,
D: Demand curve
MR: Marginal revenue curve
MC: Marginal cost curve
ATC: Average total cost curve
According to Figure 14.1, the price under perfect competition will be:
A)P1.
B)P3.
C)P5.
D)P4.
E)P2.
In the figure,D: Demand curve
MR: Marginal revenue curve
MC: Marginal cost curve
ATC: Average total cost curve
According to Figure 14.1, the price under perfect competition will be:
A)P1.
B)P3.
C)P5.
D)P4.
E)P2.
Question
The figure below shows revenue and cost curves of a natural monopoly firm.Figure 14.1
In the figure,
D: Demand curve
MR: Marginal revenue curve
MC: Marginal cost curve
ATC: Average total cost curve
Refer to Figure 14.1. The natural monopolist will charge a price equal to:
A)P4.
B)P3.
C)P2.
D)P1.
E)P5.
In the figure,D: Demand curve
MR: Marginal revenue curve
MC: Marginal cost curve
ATC: Average total cost curve
Refer to Figure 14.1. The natural monopolist will charge a price equal to:
A)P4.
B)P3.
C)P2.
D)P1.
E)P5.
Question
The figure below shows revenue and cost curves of a natural monopoly firm.Figure 14.1
In the figure,
D: Demand curve
MR: Marginal revenue curve
MC: Marginal cost curve
ATC: Average total cost curve
Refer to Figure 14.1. If the regulatory agency sets the fair-rate-of-return price, the monopolist will:
A)suspend production.
B)just break even.
C)earn super normal profits.
D)incur losses.
E)be able to cover only the variable costs.
In the figure,D: Demand curve
MR: Marginal revenue curve
MC: Marginal cost curve
ATC: Average total cost curve
Refer to Figure 14.1. If the regulatory agency sets the fair-rate-of-return price, the monopolist will:
A)suspend production.
B)just break even.
C)earn super normal profits.
D)incur losses.
E)be able to cover only the variable costs.
Question
A Herfindahl index value of 20, for a particular industry, indicates that the industry is most likely to be:
A)perfectly competitive.
B)highly concentrated.
C)oligopolistic.
D)monopolistic.
E)made up of illegal firms.
Question
A market that is shared equally by 100 firms would have a Herfindahl index of :
A)1.
B)1,000.
C)500.
D)100.
E)50.
Question
When regulators require that a natural monopoly sets price equal to average total cost:
A)it is said to be allowing a fair rate of return.
B)the firm earns a super normal profit.
C)the firm shuts down permanently.
D)the firm operates at the profit-maximizing level of output.
E)the firm shuts down temporarily.
Question
Consider a market consisting of seven firms with market shares of 40, 20, 10, 10, 8, 7, and 5 percent, respectively. Which of the following statements is true?
A)The four-firm concentration ratio would be 0.03.
B)The Herfindahl index would be 1,000.
C)The Herfindahl index would be 2,228.
D)The Herfindahl index would be 1,500.
E)The Herfindahl index would be 2,338.
Question
Which of the following statements is true of price fixing?
A)It represents a high level of competition in an industry.
B)It is allowed only under the provisions of the Federal Trade Commission Act.
C)It is, by definition, illegal, as there is no justification for it.
D)It occurs only in perfectly competitive industries.
E)It is legal in United States.
Question
The figure below shows revenue and cost curves of a natural monopoly firm.Figure 14.1
In the figure,
D: Demand curve
MR: Marginal revenue curve
MC: Marginal cost curve
ATC: Average total cost curve
Which of the following is a possible reason for governments to regulate business operations?
A)To increase monopoly profits
B)To reduce the amount of information consumers have about a product
C)To increase negative externalities
D)To promote competitive behavior
E)To decrease positive externalities
In the figure,D: Demand curve
MR: Marginal revenue curve
MC: Marginal cost curve
ATC: Average total cost curve
Which of the following is a possible reason for governments to regulate business operations?
A)To increase monopoly profits
B)To reduce the amount of information consumers have about a product
C)To increase negative externalities
D)To promote competitive behavior
E)To decrease positive externalities
Question
The figure below shows revenue and cost curves of a natural monopoly firm.Figure 14.1
In the figure,
D: Demand curve
MR: Marginal revenue curve
MC: Marginal cost curve
ATC: Average total cost curve
According to Figure 14.1, in order to attain allocative efficiency, the regulatory body must attempt to set the price equal to:
A)P2.
B)P3.
C)P1.
D)P4.
E)P5.
In the figure,D: Demand curve
MR: Marginal revenue curve
MC: Marginal cost curve
ATC: Average total cost curve
According to Figure 14.1, in order to attain allocative efficiency, the regulatory body must attempt to set the price equal to:
A)P2.
B)P3.
C)P1.
D)P4.
E)P5.
Question
A regulated firm may have an incentive to spend an inefficiently high amount on capital when:
A)it becomes deregulated.
B)fair rate of return regulation is used.
C)regulators set price equal to marginal cost.
D)it is part of a monopolistically competitive industry.
E)it is allowed to charge a monopoly price.
Question
In the United States, monopoly regulation began primarily because:
A)there were no natural monopolies in the real world.
B)the government wanted to promote other forms of business practices.
C)monopolies did not typically follow occupational and safety rules.
D)monopolies tended to restrict output and raise prices.
E)most economists believed that the majority of industries were following the purely competitive model.
Question
Which of the following was formed in October 2001 to make the national antitrust laws more consistent across the developing and developed countries of the world?
A)International Cooperation Network
B)International Competition Network
C)International Communication Network
D)International Organization for Standardization
E)International Court of Justice
Question
Which of the following statements best describes the difference between economic regulation and social regulation?
A)Economic regulation has little to do with price and output while social regulation explicitly deals with price and output.
B)Social regulation is concerned with direct redistribution of wealth while economic regulation is concerned with accumulation of wealth.
C)Economic regulation is concerned with direct redistribution of wealth while social regulation is concerned with accumulation of wealth.
D)Social regulation has historically targeted industries such as railroads and airlines while economic regulation has all the industries under its purview.
E)Economic regulation deals with price and output , while social regulation deals with health and safety matters that apply across several industries.
Question
Most natural monopolies are regulated at some level by a government because:
A)an unregulated natural monopolist would cause the problem of capital outflow.
B)an unregulated natural monopolist would produce only for government bureaucrats.
C)an unregulated natural monopolist would charge an inefficiently low price in the market.
D)an unregulated natural monopolist would charge an inefficiently high price in the market.
E)an unregulated natural monopolist would incur losses.
Question
Consider an oligopoly that has two firms, one with a 75 percent market share and the other with a 25 percent market share. The Herfindahl index for this market is:
A)5,625.
B)6,250.
C)625.
D)5,000.
E)8,500.
Question
The figure below shows revenue and cost curves of a natural monopoly firm.Figure 14.1
In the figure,
D: Demand curve
MR: Marginal revenue curve
MC: Marginal cost curve
ATC: Average total cost curve
Which of the following calculations is necessary to determine whether a regulation should be implemented?
A)Marginal cost-marginal revenue calculations
B)Cost effectiveness calculations
C)Total cost-total revenue calculations
D)Cost minimization calculations
E)Cost-benefit calculations
In the figure,D: Demand curve
MR: Marginal revenue curve
MC: Marginal cost curve
ATC: Average total cost curve
Which of the following calculations is necessary to determine whether a regulation should be implemented?
A)Marginal cost-marginal revenue calculations
B)Cost effectiveness calculations
C)Total cost-total revenue calculations
D)Cost minimization calculations
E)Cost-benefit calculations
Question
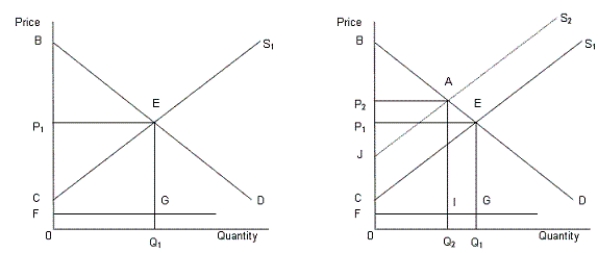
In the following figure, the first panel shows a market situation prior to regulation and the second panel shows the effects of regulation.Figure 14.2
 In the figure,
D: Demand curve for automobiles
S1: Supply curve of automobiles prior to regulation
S2: Supply curve of automobiles after regulation
FG: Clean up cost per unit
Refer to Figure 14.2. The regulation will benefit the society if:
A)area BAJ > area 0FIQ2.
B)area AECJ > area IGQ1Q2.
C)area IGQ1Q2 > area AECJ.
D)area BAJ > BAC.
E)area 0FIQ2 > area BAJ.
In the figure,D: Demand curve for automobiles
S1: Supply curve of automobiles prior to regulation
S2: Supply curve of automobiles after regulation
FG: Clean up cost per unit
Refer to Figure 14.2. The regulation will benefit the society if:
A)area BAJ > area 0FIQ2.
B)area AECJ > area IGQ1Q2.
C)area IGQ1Q2 > area AECJ.
D)area BAJ > BAC.
E)area 0FIQ2 > area BAJ.
Question
In the following figure, the first panel shows a market situation prior to regulation and the second panel shows the effects of regulation.Figure 14.2
In the figure,
D: Demand curve for automobiles
S1: Supply curve of automobiles prior to regulation
S2: Supply curve of automobiles after regulation
FG: Clean up cost per unit
Monetary freedom refers to:
A)the ability to create and operate an enterprise easily.
B)the absence of tariff and non-tariff barriers that affect imports of goods.
C)the tax burden and overall tax revenue of the government.
D)price stability with an assessment of price control.
E)the free flow of foreign capital.
In the figure,D: Demand curve for automobiles
S1: Supply curve of automobiles prior to regulation
S2: Supply curve of automobiles after regulation
FG: Clean up cost per unit
Monetary freedom refers to:
A)the ability to create and operate an enterprise easily.
B)the absence of tariff and non-tariff barriers that affect imports of goods.
C)the tax burden and overall tax revenue of the government.
D)price stability with an assessment of price control.
E)the free flow of foreign capital.
Question
The figure below shows revenue and cost curves of a natural monopoly firm.Figure 14.1
In the figure,
D: Demand curve
MR: Marginal revenue curve
MC: Marginal cost curve
ATC: Average total cost curve
When regulating a natural monopoly, government officials face a dilemma that:
A)the efficient price may not allow the firm to break even.
B)the efficient price may lead to an inefficiently high level of output.
C)the efficient price leads to an output level that is too low.
D)the efficient price may force the firm to shut-down.
E)long-run average costs are constantly increasing.
In the figure,D: Demand curve
MR: Marginal revenue curve
MC: Marginal cost curve
ATC: Average total cost curve
When regulating a natural monopoly, government officials face a dilemma that:
A)the efficient price may not allow the firm to break even.
B)the efficient price may lead to an inefficiently high level of output.
C)the efficient price leads to an output level that is too low.
D)the efficient price may force the firm to shut-down.
E)long-run average costs are constantly increasing.
Question
The figure below shows revenue and cost curves of a natural monopoly firm.Figure 14.1
In the figure,
D: Demand curve
MR: Marginal revenue curve
MC: Marginal cost curve
ATC: Average total cost curve
If social regulation causes the supply curve in a market to shift up because of higher marginal costs, then:
A)both consumer and producer surplus will decrease.
B)both producer and consumer surplus will increase.
C)consumers will gain at the expense of producers.
D)producers will gain at the expense of consumers.
E)there will be no change in the sum of producer and consumer surplus, although its division may change.
In the figure,D: Demand curve
MR: Marginal revenue curve
MC: Marginal cost curve
ATC: Average total cost curve
If social regulation causes the supply curve in a market to shift up because of higher marginal costs, then:
A)both consumer and producer surplus will decrease.
B)both producer and consumer surplus will increase.
C)consumers will gain at the expense of producers.
D)producers will gain at the expense of consumers.
E)there will be no change in the sum of producer and consumer surplus, although its division may change.
Question
In the following figure, the first panel shows a market situation prior to regulation and the second panel shows the effects of regulation.Figure 14.2
In the figure,
D: Demand curve for automobiles
S1: Supply curve of automobiles prior to regulation
S2: Supply curve of automobiles after regulation
FG: Clean up cost per unit
What is the total social surplus prior to regulation, in Figure 14.2?
A)Area 0FGQ1.
B)Area BEP1.
C)Area CEP1.
D)Area FGEP1.
E)Area BEC.
In the figure,D: Demand curve for automobiles
S1: Supply curve of automobiles prior to regulation
S2: Supply curve of automobiles after regulation
FG: Clean up cost per unit
What is the total social surplus prior to regulation, in Figure 14.2?
A)Area 0FGQ1.
B)Area BEP1.
C)Area CEP1.
D)Area FGEP1.
E)Area BEC.
Question
The figure below shows revenue and cost curves of a natural monopoly firm.Figure 14.1
In the figure,
D: Demand curve
MR: Marginal revenue curve
MC: Marginal cost curve
ATC: Average total cost curve
Why do the regulated companies oppose deregulation?
A)They would be deprived of an opportunity to compete with other firms.
B)They would be deprived of their rights to continue business.
C)They would be denied any kind of support from the government.
D)They would incur losses on account of increased competition.
E)They would become unpopular as they would no longer be controlled by the government.
In the figure,D: Demand curve
MR: Marginal revenue curve
MC: Marginal cost curve
ATC: Average total cost curve
Why do the regulated companies oppose deregulation?
A)They would be deprived of an opportunity to compete with other firms.
B)They would be deprived of their rights to continue business.
C)They would be denied any kind of support from the government.
D)They would incur losses on account of increased competition.
E)They would become unpopular as they would no longer be controlled by the government.
Question
In the following figure, the first panel shows a market situation prior to regulation and the second panel shows the effects of regulation.Figure 14.2
In the figure,
D: Demand curve for automobiles
S1: Supply curve of automobiles prior to regulation
S2: Supply curve of automobiles after regulation
FG: Clean up cost per unit
According to Figure 14.2, the total clean up cost for the society prior to regulation is the:
A)area 0BEQ1.
B)area 0FIQ2.
C)area 0FGQ1.
D)area 0P1EQ1.
E)area 0CEQ1.
In the figure,D: Demand curve for automobiles
S1: Supply curve of automobiles prior to regulation
S2: Supply curve of automobiles after regulation
FG: Clean up cost per unit
According to Figure 14.2, the total clean up cost for the society prior to regulation is the:
A)area 0BEQ1.
B)area 0FIQ2.
C)area 0FGQ1.
D)area 0P1EQ1.
E)area 0CEQ1.
Question
In the following figure, the first panel shows a market situation prior to regulation and the second panel shows the effects of regulation.Figure 14.2
In the figure,
D: Demand curve for automobiles
S1: Supply curve of automobiles prior to regulation
S2: Supply curve of automobiles after regulation
FG: Clean up cost per unit
According to Figure 14.2, the total clean up cost after the regulation is the:
A)area 0FIQ2.
B)area 0FGQ1.
C)area BEC.
D)area BEP1.
E)area BEGF.
In the figure,D: Demand curve for automobiles
S1: Supply curve of automobiles prior to regulation
S2: Supply curve of automobiles after regulation
FG: Clean up cost per unit
According to Figure 14.2, the total clean up cost after the regulation is the:
A)area 0FIQ2.
B)area 0FGQ1.
C)area BEC.
D)area BEP1.
E)area BEGF.
Question
In the following figure, the first panel shows a market situation prior to regulation and the second panel shows the effects of regulation.Figure 14.2
In the figure,
D: Demand curve for automobiles
S1: Supply curve of automobiles prior to regulation
S2: Supply curve of automobiles after regulation
FG: Clean up cost per unit
Which of the following is true of the General Agreement on Tariffs and Trade (GATT)?
A)It is now called the World Agreement on Trade and Tariffs.
B)It was the global trade agreement that did away with the gold standard.
C)It was a policy of the United States to raise tariffs on imported sugar.
D)It was the first global trade agreement that followed World War II.
E)It was a global trade agreement to raise tariffs.
In the figure,D: Demand curve for automobiles
S1: Supply curve of automobiles prior to regulation
S2: Supply curve of automobiles after regulation
FG: Clean up cost per unit
Which of the following is true of the General Agreement on Tariffs and Trade (GATT)?
A)It is now called the World Agreement on Trade and Tariffs.
B)It was the global trade agreement that did away with the gold standard.
C)It was a policy of the United States to raise tariffs on imported sugar.
D)It was the first global trade agreement that followed World War II.
E)It was a global trade agreement to raise tariffs.
Question
In the following figure, the first panel shows a market situation prior to regulation and the second panel shows the effects of regulation.Figure 14.2
In the figure,
D: Demand curve for automobiles
S1: Supply curve of automobiles prior to regulation
S2: Supply curve of automobiles after regulation
FG: Clean up cost per unit
According to the Index of Economic Freedom, which of the following is the freest economy in the world?
A)Cuba
B)Zimbabwe
C)Hong Kong
D)North Korea
E)Libya
In the figure,D: Demand curve for automobiles
S1: Supply curve of automobiles prior to regulation
S2: Supply curve of automobiles after regulation
FG: Clean up cost per unit
According to the Index of Economic Freedom, which of the following is the freest economy in the world?
A)Cuba
B)Zimbabwe
C)Hong Kong
D)North Korea
E)Libya
Question
In the following figure, the first panel shows a market situation prior to regulation and the second panel shows the effects of regulation.Figure 14.2
In the figure,
D: Demand curve for automobiles
S1: Supply curve of automobiles prior to regulation
S2: Supply curve of automobiles after regulation
FG: Clean up cost per unit
According to Figure 14.2, the total social surplus after the regulation is the:
A)area BEC.
B)area AECJ.
C)area IGQ1Q2.
D)area 0FIQ2.
E)area BAJ.
In the figure,D: Demand curve for automobiles
S1: Supply curve of automobiles prior to regulation
S2: Supply curve of automobiles after regulation
FG: Clean up cost per unit
According to Figure 14.2, the total social surplus after the regulation is the:
A)area BEC.
B)area AECJ.
C)area IGQ1Q2.
D)area 0FIQ2.
E)area BAJ.
Question
In the following figure, the first panel shows a market situation prior to regulation and the second panel shows the effects of regulation.Figure 14.2
In the figure,
D: Demand curve for automobiles
S1: Supply curve of automobiles prior to regulation
S2: Supply curve of automobiles after regulation
FG: Clean up cost per unit
Which of the following is not a component of the index which measures economic freedom of a country?
A)Monetary freedom
B)Cultural freedom
C)Government size
D)Freedom from corruption
E)Labor freedom
In the figure,D: Demand curve for automobiles
S1: Supply curve of automobiles prior to regulation
S2: Supply curve of automobiles after regulation
FG: Clean up cost per unit
Which of the following is not a component of the index which measures economic freedom of a country?
A)Monetary freedom
B)Cultural freedom
C)Government size
D)Freedom from corruption
E)Labor freedom
Question
The figure below shows revenue and cost curves of a natural monopoly firm.Figure 14.1
In the figure,
D: Demand curve
MR: Marginal revenue curve
MC: Marginal cost curve
ATC: Average total cost curve
If social regulation increases a firm's fixed and variable costs:
A)then both marginal cost and average total cost will increase, and the firm will produce more.
B)then both marginal cost and average total cost will increase, and the firm will produce less.
C)then both marginal cost and average total cost will decrease, and profits will increase.
D)then marginal cost will increase, average total cost will be constant, and price will decline.
E)then both price and quantity produced will fall.
In the figure,D: Demand curve
MR: Marginal revenue curve
MC: Marginal cost curve
ATC: Average total cost curve
If social regulation increases a firm's fixed and variable costs:
A)then both marginal cost and average total cost will increase, and the firm will produce more.
B)then both marginal cost and average total cost will increase, and the firm will produce less.
C)then both marginal cost and average total cost will decrease, and profits will increase.
D)then marginal cost will increase, average total cost will be constant, and price will decline.
E)then both price and quantity produced will fall.
Question
In the following figure, the first panel shows a market situation prior to regulation and the second panel shows the effects of regulation.Figure 14.2
In the figure,
D: Demand curve for automobiles
S1: Supply curve of automobiles prior to regulation
S2: Supply curve of automobiles after regulation
FG: Clean up cost per unit
Graphically, consumer surplus is the area:
A)above the demand curve.
B)below the supply curve.
C)under the demand curve and the supply curve.
D)above the market supply curve and under the equilibrium price.
E)under the market demand curve and above the equilibrium price.
In the figure,D: Demand curve for automobiles
S1: Supply curve of automobiles prior to regulation
S2: Supply curve of automobiles after regulation
FG: Clean up cost per unit
Graphically, consumer surplus is the area:
A)above the demand curve.
B)below the supply curve.
C)under the demand curve and the supply curve.
D)above the market supply curve and under the equilibrium price.
E)under the market demand curve and above the equilibrium price.
Question
In the following figure, the first panel shows a market situation prior to regulation and the second panel shows the effects of regulation.Figure 14.2
In the figure,
D: Demand curve for automobiles
S1: Supply curve of automobiles prior to regulation
S2: Supply curve of automobiles after regulation
FG: Clean up cost per unit
Which of the following raises the economic freedom of a country?
A)Limited international movement of productive resources
B)Higher taxes
C)Red-tapism and bureaucracy
D)Reduction of trade barriers like tariffs and quotas
E)Reduction of government subsidies on gasoline
In the figure,D: Demand curve for automobiles
S1: Supply curve of automobiles prior to regulation
S2: Supply curve of automobiles after regulation
FG: Clean up cost per unit
Which of the following raises the economic freedom of a country?
A)Limited international movement of productive resources
B)Higher taxes
C)Red-tapism and bureaucracy
D)Reduction of trade barriers like tariffs and quotas
E)Reduction of government subsidies on gasoline
Question
The figure below shows revenue and cost curves of a natural monopoly firm.Figure 14.1
In the figure,
D: Demand curve
MR: Marginal revenue curve
MC: Marginal cost curve
ATC: Average total cost curve
To avoid driving a natural monopolist into bankruptcy, regulatory commissions:
A)allow the monopolist to enjoy an economic profit.
B)do not allow the monopolist to make an accounting profit.
C)subsidize the monopolist to help it break even.
D)allow the monopolist to earn a fair rate of return.
E)allow the monopolist to temporarily shut down.
In the figure,D: Demand curve
MR: Marginal revenue curve
MC: Marginal cost curve
ATC: Average total cost curve
To avoid driving a natural monopolist into bankruptcy, regulatory commissions:
A)allow the monopolist to enjoy an economic profit.
B)do not allow the monopolist to make an accounting profit.
C)subsidize the monopolist to help it break even.
D)allow the monopolist to earn a fair rate of return.
E)allow the monopolist to temporarily shut down.
Question
The figure below shows revenue and cost curves of a natural monopoly firm.Figure 14.1
In the figure,
D: Demand curve
MR: Marginal revenue curve
MC: Marginal cost curve
ATC: Average total cost curve
Which of the following factors will help determine how the costs of social regulation are split between consumers and producers?
A)The price elasticities of demand and supply
B)The quantity produced by the firm
C)The average total costs of the firm before regulation
D)The number of consumers in the market
E)The number of producers in the market
In the figure,D: Demand curve
MR: Marginal revenue curve
MC: Marginal cost curve
ATC: Average total cost curve
Which of the following factors will help determine how the costs of social regulation are split between consumers and producers?
A)The price elasticities of demand and supply
B)The quantity produced by the firm
C)The average total costs of the firm before regulation
D)The number of consumers in the market
E)The number of producers in the market
Question
The figure below shows revenue and cost curves of a natural monopoly firm.Figure 14.1
In the figure,
D: Demand curve
MR: Marginal revenue curve
MC: Marginal cost curve
ATC: Average total cost curve
Which of the following is an example of the opportunity cost involved with social regulation?
A)The monetary costs of hiring administrative assistants to fill out OSHA safety reports
B)The environmental costs of pollution control required under the Clean Air Act
C)The monetary costs of laboratory trials required to try out a new drug
D)The lives that are lost because new drugs are not introduced quickly
E)The monetary cost of manufacturing a life saving drug
In the figure,D: Demand curve
MR: Marginal revenue curve
MC: Marginal cost curve
ATC: Average total cost curve
Which of the following is an example of the opportunity cost involved with social regulation?
A)The monetary costs of hiring administrative assistants to fill out OSHA safety reports
B)The environmental costs of pollution control required under the Clean Air Act
C)The monetary costs of laboratory trials required to try out a new drug
D)The lives that are lost because new drugs are not introduced quickly
E)The monetary cost of manufacturing a life saving drug
Question
The figure below shows revenue and cost curves of a natural monopoly firm.Figure 14.1
In the figure,
D: Demand curve
MR: Marginal revenue curve
MC: Marginal cost curve
ATC: Average total cost curve
Suppose that the demand for apples in Washington is elastic and the supply is inelastic. If the government of Washington passes a law prohibiting the use of synthetic pesticides that increases the marginal and average costs of producing apples, then:
A)the price of Washington State apples will decline.
B)Washington will stop producing apples, and New York apple growers will benefit.
C)apple growers will pass most of the increased costs on to consumers in the form of higher apple prices.
D)apple growers will keep prices constant but reduce costs by advertising less.
E)apple growers will bear most of the increased costs of regulation, and prices will increase only slightly.
In the figure,D: Demand curve
MR: Marginal revenue curve
MC: Marginal cost curve
ATC: Average total cost curve
Suppose that the demand for apples in Washington is elastic and the supply is inelastic. If the government of Washington passes a law prohibiting the use of synthetic pesticides that increases the marginal and average costs of producing apples, then:
A)the price of Washington State apples will decline.
B)Washington will stop producing apples, and New York apple growers will benefit.
C)apple growers will pass most of the increased costs on to consumers in the form of higher apple prices.
D)apple growers will keep prices constant but reduce costs by advertising less.
E)apple growers will bear most of the increased costs of regulation, and prices will increase only slightly.
Question
In the following figure, the first panel shows a market situation prior to regulation and the second panel shows the effects of regulation.Figure 14.2
In the figure,
D: Demand curve for automobiles
S1: Supply curve of automobiles prior to regulation
S2: Supply curve of automobiles after regulation
FG: Clean up cost per unit
Social regulation means that the government dictates the price that a firm must charge and/or the quantity that a firm must supply.
In the figure,D: Demand curve for automobiles
S1: Supply curve of automobiles prior to regulation
S2: Supply curve of automobiles after regulation
FG: Clean up cost per unit
Social regulation means that the government dictates the price that a firm must charge and/or the quantity that a firm must supply.
Question
In the following figure, the first panel shows a market situation prior to regulation and the second panel shows the effects of regulation.Figure 14.2
In the figure,
D: Demand curve for automobiles
S1: Supply curve of automobiles prior to regulation
S2: Supply curve of automobiles after regulation
FG: Clean up cost per unit
According to the per se rule, activities that were potentially monopolizing tactics were illegal.
In the figure,D: Demand curve for automobiles
S1: Supply curve of automobiles prior to regulation
S2: Supply curve of automobiles after regulation
FG: Clean up cost per unit
According to the per se rule, activities that were potentially monopolizing tactics were illegal.
Question
In the following figure, the first panel shows a market situation prior to regulation and the second panel shows the effects of regulation.Figure 14.2
In the figure,
D: Demand curve for automobiles
S1: Supply curve of automobiles prior to regulation
S2: Supply curve of automobiles after regulation
FG: Clean up cost per unit
If there are 50 firms in the industry, and each have an equal market share, the Herfindahl index will be equal to 1,00,000.
In the figure,D: Demand curve for automobiles
S1: Supply curve of automobiles prior to regulation
S2: Supply curve of automobiles after regulation
FG: Clean up cost per unit
If there are 50 firms in the industry, and each have an equal market share, the Herfindahl index will be equal to 1,00,000.
Question
In the following figure, the first panel shows a market situation prior to regulation and the second panel shows the effects of regulation.Figure 14.2
In the figure,
D: Demand curve for automobiles
S1: Supply curve of automobiles prior to regulation
S2: Supply curve of automobiles after regulation
FG: Clean up cost per unit
A regulated natural monopoly is allowed to set a price which will enable it to earn an above-normal profit.
In the figure,D: Demand curve for automobiles
S1: Supply curve of automobiles prior to regulation
S2: Supply curve of automobiles after regulation
FG: Clean up cost per unit
A regulated natural monopoly is allowed to set a price which will enable it to earn an above-normal profit.
Question
In the following figure, the first panel shows a market situation prior to regulation and the second panel shows the effects of regulation.Figure 14.2
In the figure,
D: Demand curve for automobiles
S1: Supply curve of automobiles prior to regulation
S2: Supply curve of automobiles after regulation
FG: Clean up cost per unit
In a natural monopoly, government regulation is often used to ensure more beneficial price and output combinations for consumers in the market than would exist in the absence of regulation.
In the figure,D: Demand curve for automobiles
S1: Supply curve of automobiles prior to regulation
S2: Supply curve of automobiles after regulation
FG: Clean up cost per unit
In a natural monopoly, government regulation is often used to ensure more beneficial price and output combinations for consumers in the market than would exist in the absence of regulation.
Question
In the following figure, the first panel shows a market situation prior to regulation and the second panel shows the effects of regulation.Figure 14.2
In the figure,
D: Demand curve for automobiles
S1: Supply curve of automobiles prior to regulation
S2: Supply curve of automobiles after regulation
FG: Clean up cost per unit
Restrictions on the types of food additives that breakfast cereal manufacturers can use is an example of a social regulation.
In the figure,D: Demand curve for automobiles
S1: Supply curve of automobiles prior to regulation
S2: Supply curve of automobiles after regulation
FG: Clean up cost per unit
Restrictions on the types of food additives that breakfast cereal manufacturers can use is an example of a social regulation.
Question
In the following figure, the first panel shows a market situation prior to regulation and the second panel shows the effects of regulation.Figure 14.2
In the figure,
D: Demand curve for automobiles
S1: Supply curve of automobiles prior to regulation
S2: Supply curve of automobiles after regulation
FG: Clean up cost per unit
If a market is narrowly defined, the market share of each firm declines than if it is broadly defined.
In the figure,D: Demand curve for automobiles
S1: Supply curve of automobiles prior to regulation
S2: Supply curve of automobiles after regulation
FG: Clean up cost per unit
If a market is narrowly defined, the market share of each firm declines than if it is broadly defined.
Question
In the following figure, the first panel shows a market situation prior to regulation and the second panel shows the effects of regulation.Figure 14.2
In the figure,
D: Demand curve for automobiles
S1: Supply curve of automobiles prior to regulation
S2: Supply curve of automobiles after regulation
FG: Clean up cost per unit
Delegates from different countries of the world met at Geneva in April 1947 which resulted in the formation of the first global trade agreement. Its main objective was:
A)to create multiple trade barriers in the member countries.
B)to enable the member countries to maintain their autarkic conditions.
C)to provide security to the domestic producers of the member countries by prohibiting international trade.
D)to create an atmosphere of economic rivalry in the international sphere.
E)to liberalize trade for mutual prosperity of the members.
In the figure,D: Demand curve for automobiles
S1: Supply curve of automobiles prior to regulation
S2: Supply curve of automobiles after regulation
FG: Clean up cost per unit
Delegates from different countries of the world met at Geneva in April 1947 which resulted in the formation of the first global trade agreement. Its main objective was:
A)to create multiple trade barriers in the member countries.
B)to enable the member countries to maintain their autarkic conditions.
C)to provide security to the domestic producers of the member countries by prohibiting international trade.
D)to create an atmosphere of economic rivalry in the international sphere.
E)to liberalize trade for mutual prosperity of the members.
Question
In the following figure, the first panel shows a market situation prior to regulation and the second panel shows the effects of regulation.Figure 14.2
In the figure,
D: Demand curve for automobiles
S1: Supply curve of automobiles prior to regulation
S2: Supply curve of automobiles after regulation
FG: Clean up cost per unit
One difference between economic and social regulation is that economic regulation usually pertains to a specific industry, whereas social regulation applies to most if not all industries.
In the figure,D: Demand curve for automobiles
S1: Supply curve of automobiles prior to regulation
S2: Supply curve of automobiles after regulation
FG: Clean up cost per unit
One difference between economic and social regulation is that economic regulation usually pertains to a specific industry, whereas social regulation applies to most if not all industries.
Question
In the following figure, the first panel shows a market situation prior to regulation and the second panel shows the effects of regulation.Figure 14.2
In the figure,
D: Demand curve for automobiles
S1: Supply curve of automobiles prior to regulation
S2: Supply curve of automobiles after regulation
FG: Clean up cost per unit
Regulation of monopolies is justified on the ground that a monopolist sells too less at a too high price.
In the figure,D: Demand curve for automobiles
S1: Supply curve of automobiles prior to regulation
S2: Supply curve of automobiles after regulation
FG: Clean up cost per unit
Regulation of monopolies is justified on the ground that a monopolist sells too less at a too high price.
Question
In the following figure, the first panel shows a market situation prior to regulation and the second panel shows the effects of regulation.Figure 14.2
In the figure,
D: Demand curve for automobiles
S1: Supply curve of automobiles prior to regulation
S2: Supply curve of automobiles after regulation
FG: Clean up cost per unit
If the Herfindahl index for automobiles take foreign competition into account, the Herfindahl index for the U.S. automobile industry would be significantly higher.
In the figure,D: Demand curve for automobiles
S1: Supply curve of automobiles prior to regulation
S2: Supply curve of automobiles after regulation
FG: Clean up cost per unit
If the Herfindahl index for automobiles take foreign competition into account, the Herfindahl index for the U.S. automobile industry would be significantly higher.
Question
In the following figure, the first panel shows a market situation prior to regulation and the second panel shows the effects of regulation.Figure 14.2
In the figure,
D: Demand curve for automobiles
S1: Supply curve of automobiles prior to regulation
S2: Supply curve of automobiles after regulation
FG: Clean up cost per unit
Actions against alleged violators of the antitrust statutes may be initiated by the Justice Department, by the Federal Trade Commission, and by private plaintiffs.
In the figure,D: Demand curve for automobiles
S1: Supply curve of automobiles prior to regulation
S2: Supply curve of automobiles after regulation
FG: Clean up cost per unit
Actions against alleged violators of the antitrust statutes may be initiated by the Justice Department, by the Federal Trade Commission, and by private plaintiffs.
Question
In the following figure, the first panel shows a market situation prior to regulation and the second panel shows the effects of regulation.Figure 14.2
In the figure,
D: Demand curve for automobiles
S1: Supply curve of automobiles prior to regulation
S2: Supply curve of automobiles after regulation
FG: Clean up cost per unit
Regulation of enterprises by the government has always been found to make the market more efficient.
In the figure,D: Demand curve for automobiles
S1: Supply curve of automobiles prior to regulation
S2: Supply curve of automobiles after regulation
FG: Clean up cost per unit
Regulation of enterprises by the government has always been found to make the market more efficient.
Question
In the following figure, the first panel shows a market situation prior to regulation and the second panel shows the effects of regulation.Figure 14.2
In the figure,
D: Demand curve for automobiles
S1: Supply curve of automobiles prior to regulation
S2: Supply curve of automobiles after regulation
FG: Clean up cost per unit
Sherman Antitrust Act bans price discrimination that substantially lessens competition or injures particular competitors.
In the figure,D: Demand curve for automobiles
S1: Supply curve of automobiles prior to regulation
S2: Supply curve of automobiles after regulation
FG: Clean up cost per unit
Sherman Antitrust Act bans price discrimination that substantially lessens competition or injures particular competitors.
Question
In the following figure, the first panel shows a market situation prior to regulation and the second panel shows the effects of regulation.Figure 14.2
In the figure,
D: Demand curve for automobiles
S1: Supply curve of automobiles prior to regulation
S2: Supply curve of automobiles after regulation
FG: Clean up cost per unit
Antitrust policies are a set of measures which are taken to liberate the economy from unnecessary governmental controls.
In the figure,D: Demand curve for automobiles
S1: Supply curve of automobiles prior to regulation
S2: Supply curve of automobiles after regulation
FG: Clean up cost per unit
Antitrust policies are a set of measures which are taken to liberate the economy from unnecessary governmental controls.
Question
In the following figure, the first panel shows a market situation prior to regulation and the second panel shows the effects of regulation.Figure 14.2
In the figure,
D: Demand curve for automobiles
S1: Supply curve of automobiles prior to regulation
S2: Supply curve of automobiles after regulation
FG: Clean up cost per unit
Being a monopoly or attempting to monopolize act as sufficient evidence that lead to a guilty verdict under the rule of reason.
In the figure,D: Demand curve for automobiles
S1: Supply curve of automobiles prior to regulation
S2: Supply curve of automobiles after regulation
FG: Clean up cost per unit
Being a monopoly or attempting to monopolize act as sufficient evidence that lead to a guilty verdict under the rule of reason.
Question
In the following figure, the first panel shows a market situation prior to regulation and the second panel shows the effects of regulation.Figure 14.2
In the figure,
D: Demand curve for automobiles
S1: Supply curve of automobiles prior to regulation
S2: Supply curve of automobiles after regulation
FG: Clean up cost per unit
Antitrust laws in the United States rely more on economic theory and the rule of reason approach, whereas the European Union relies more on the per se approach.
In the figure,D: Demand curve for automobiles
S1: Supply curve of automobiles prior to regulation
S2: Supply curve of automobiles after regulation
FG: Clean up cost per unit
Antitrust laws in the United States rely more on economic theory and the rule of reason approach, whereas the European Union relies more on the per se approach.
Question
In the following figure, the first panel shows a market situation prior to regulation and the second panel shows the effects of regulation.Figure 14.2
In the figure,
D: Demand curve for automobiles
S1: Supply curve of automobiles prior to regulation
S2: Supply curve of automobiles after regulation
FG: Clean up cost per unit
Under the Clinton administration, attempts were made to relax the antitrust enforcement efforts of the Reagan administration.
In the figure,D: Demand curve for automobiles
S1: Supply curve of automobiles prior to regulation
S2: Supply curve of automobiles after regulation
FG: Clean up cost per unit
Under the Clinton administration, attempts were made to relax the antitrust enforcement efforts of the Reagan administration.
Question
In the following figure, the first panel shows a market situation prior to regulation and the second panel shows the effects of regulation.Figure 14.2
In the figure,
D: Demand curve for automobiles
S1: Supply curve of automobiles prior to regulation
S2: Supply curve of automobiles after regulation
FG: Clean up cost per unit
When a monopoly is regulated it is required to sell lower output at a lower price.
In the figure,D: Demand curve for automobiles
S1: Supply curve of automobiles prior to regulation
S2: Supply curve of automobiles after regulation
FG: Clean up cost per unit
When a monopoly is regulated it is required to sell lower output at a lower price.
Question
In the following figure, the first panel shows a market situation prior to regulation and the second panel shows the effects of regulation.Figure 14.2
In the figure,
D: Demand curve for automobiles
S1: Supply curve of automobiles prior to regulation
S2: Supply curve of automobiles after regulation
FG: Clean up cost per unit
Although the GATT was supported by most of the countries of the world, yet global trade shrank during the close of the last decade. This was due to:
A)growing suspicion among the nations of the world.
B)hyperinflation in the major economies of the world.
C)the recession which began in 2007.
D)political turmoil in the Asian countries.
E)the desire among the major players to dominate the international market.
In the figure,D: Demand curve for automobiles
S1: Supply curve of automobiles prior to regulation
S2: Supply curve of automobiles after regulation
FG: Clean up cost per unit
Although the GATT was supported by most of the countries of the world, yet global trade shrank during the close of the last decade. This was due to:
A)growing suspicion among the nations of the world.
B)hyperinflation in the major economies of the world.
C)the recession which began in 2007.
D)political turmoil in the Asian countries.
E)the desire among the major players to dominate the international market.

Unlock Deck
Sign up to unlock the cards in this deck!
Unlock Deck
Unlock Deck
1/88
Play
Full screen (f)
Deck 14: Antitrust and Regulation
1
In an antitrust lawsuit, which of the following parties is entitled to receive treble damages?
A)The Antitrust Division of the Justice Department
B)The Federal Trade Commission
C)Private plaintiffs
D)State attorney generals
E)The Department of Labor
Private plaintiffs
2
Which of the following is true of the per se rule?
A)The per se rule was used by U.S. courts from 1914 until the 1920s.
B)The per se rule had the effect of making antitrust policy more liberal.
C)According to the per se rule, activities that were potentially monopolizing tactics were illegal.
D)The per se rule did not allow the mere existence of anti-competitive activities to be sufficient evidence for a guilty verdict.
E)The per se rule was revived by Bush administration.
According to the per se rule, activities that were potentially monopolizing tactics were illegal.
3
Which of the following entities is able to sue a firm for alleged antitrust misbehavior in the U.S.?
A)Department of Illegal Affairs
B)Department of State
C)Department of Homeland Security
D)Department of Justice
E)Department of Labor
Department of Justice
4
The U.S. Justice Department, on the basis of the Herfindahl index, classifies the industries with the value:
A)below 500 as highly competitive; 500-1000 as moderately competitive; and above 1000 as highly concentrated.
B)below 1000 as highly competitive; 1000-1500 as moderately competitive; and above 1500 as highly concentrated.
C)below 500 as highly competitive; 500-1500 as moderately competitive; and above 1500 as highly concentrated.
D)below 1000 as highly competitive; 1000-1800 as moderately competitive; and above 1800 as highly concentrated.
E)below 1500 as highly competitive; 1500-2000 as moderately competitive; and above 2000 as highly concentrated.
Unlock Deck
Unlock for access to all 88 flashcards in this deck.
Unlock Deck
k this deck
5
The first phase of antitrust policy in the U.S. began with the passage of the Sherman Antitrust Act in 1890. To judge a firm's action, the courts in this period used:
A)a per se rule.
B)a rule of reason.
C)a rule of thumb.
D)rules of order.
E)strict enforcement rule.
Unlock Deck
Unlock for access to all 88 flashcards in this deck.
Unlock Deck
k this deck
6
Which of the following is most likely to happen if the Federal Trade Commission (FTC) wins a suit against alleged violators of antitrust law?
A)The FTC will receive compensation up to three times the damage caused.
B)The FTC will not be able to impose substantial penalties.
C)The FTC will force firms to break up through dissolution.
D)The FTC will force firms to merge together.
E)The FTC will file criminal actions that may result in fines but not prison sentences.
Unlock Deck
Unlock for access to all 88 flashcards in this deck.
Unlock Deck
k this deck
7
What are the three phases of antitrust policy in the United States, since 1890?
A)1890 to 1914, the rule of reason; 1914 to the early 1980s, per se; since then, the rule of reason
B)1890 to 1914, per se; 1914 to the early 1980s, the rule of reason; since then, per se
C)1890 to 1914, the rule of reason; 1914 to the early 1980s, per se; since then, no antitrust policy
D)1890 to 1914, the rule of reason; 1914 to the early 1980s, per se; since then, a period of rate of return regulation
E)1890 to 1914, the rule of reason; 1914 to the early 1980s, per se; since then, a period of nationalization
Unlock Deck
Unlock for access to all 88 flashcards in this deck.
Unlock Deck
k this deck
8
Antitrust policy is used to describe government policies and programs that are designed to:
A)promote the creation of trusts, or combinations of independent firms.
B)control the growth of monopoly and enhance competition.
C)deal with the threat of competitive practices to public interests.
D)create an environment in which the government will distrust firms.
E)create an environment in which firms will distrust the government.
Unlock Deck
Unlock for access to all 88 flashcards in this deck.
Unlock Deck
k this deck
9
Which of the following is true of Antitrust policy?
A)Antitrust policy prohibits agreements that allow free trade.
B)Antitrust policy restricts abusive behavior by a firm dominating a market.
C)Antitrust policy allows anti-competitive practices.
D)Antitrust policy restricts subsidies in goods and services.
E)Antitrust policy creates trade barriers like tariffs and quota.
Unlock Deck
Unlock for access to all 88 flashcards in this deck.
Unlock Deck
k this deck
10
The antitrust laws in the United States were created in the late 1800s as a result of :
A)the emergence of large and dominant businesses in railroads, steel, oil, mining and finance.
B)the government decision to take responsibility for the improvement of trade deficit.
C)the first illegal cartel, created in late 1800s.
D)a steep decline in prices of primary goods in the United States.
E)the threats of an external aggression received by the country.
Unlock Deck
Unlock for access to all 88 flashcards in this deck.
Unlock Deck
k this deck
11
Which of the following does the Sherman Antitrust Act forbid?
A)Monopolization or attempts to monopolize
B)All types of price discrimination
C)Competition among firms
D)Unfair methods of competition
E)Privatization of government owned firms
Unlock Deck
Unlock for access to all 88 flashcards in this deck.
Unlock Deck
k this deck
12
Under George W. Bush's administration, antitrust policy:
A)became much more strict.
B)prohibited every merger attempts.
C)focused increasingly on environmental concerns.
D)became more relaxed.
E)ignored financial regulation and corporate scandals.
Unlock Deck
Unlock for access to all 88 flashcards in this deck.
Unlock Deck
k this deck
13
Under the second phase of antitrust policy that began in 1914 in the U.S., the courts used _____ in order to judge the firms' actions.
A)a rule of reason
B)the rule of 72
C)a rule of thirds
D)a per se rule
E)the rule of law
Unlock Deck
Unlock for access to all 88 flashcards in this deck.
Unlock Deck
k this deck
14
The most reliable measure of market concentration is:
A)the Cost of Living index.
B)the Herfindahl-Hirschman index.
C)the Market index.
D)the Market-Value weighted index.
E)the Wholesale Price index.
Unlock Deck
Unlock for access to all 88 flashcards in this deck.
Unlock Deck
k this deck
15
A market is said to be concentrated when:
A)the degree of competition in the market increases.
B)many firms supply to a small number of consumers.
C)the firms producing identical goods are clustered in a particular location.
D)a firm or a few firms are able to dictate the competitive conditions in a market.
E)there is a huge immigration of workers from neighboring areas.
Unlock Deck
Unlock for access to all 88 flashcards in this deck.
Unlock Deck
k this deck
16
Which of the following practices is restricted by the antitrust laws of the United States?
A)Merger of smaller firms into a large firm
B)Entry of new firms in the long run
C)Standardization of products in a market
D)Exit of non-performing firms in the long run
E)Quality differentiation by competitive firms
Unlock Deck
Unlock for access to all 88 flashcards in this deck.
Unlock Deck
k this deck
17
Which of the following practices is not restricted by the antitrust law in the United States?
A)Contracts and conspiracies in restraint of trade
B)Attempts to monopolize a market
C)Mergers that substantially reduces competition
D)Unfair or deceptive acts of competition
E)All forms of quality discrimination
Unlock Deck
Unlock for access to all 88 flashcards in this deck.
Unlock Deck
k this deck
18
Which of the following laws was enacted to forbid monopolization and attempts to monopolize?
A)The Anti-Monopoly Act
B)The Sherman Antitrust Act
C)The Trade Act
D)The National Banking Act
E)The Celler-Kefauver Act
Unlock Deck
Unlock for access to all 88 flashcards in this deck.
Unlock Deck
k this deck
19
Which of the following are the three laws that define the U.S government's approach to antitrust?
A)The Wilmington, Jackson, and International Trade Commission Acts
B)The Springfield, Clayton, and Trade Commission Acts
C)The Sherman, Clayton, and Federal Trade Commission Acts
D)The Sherman, Jackson, and Regional Trade Commission Acts
E)The Jackson, Charleston and Sherman Monopoly Restrictive Trade Acts
Unlock Deck
Unlock for access to all 88 flashcards in this deck.
Unlock Deck
k this deck
20
The judicial doctrine, being a monopoly or attempting to monopolize is not in itself illegal; to be illegal, an action had to be shown to have negative economic effects, is called:
A)the "big is bad" policy.
B)the per se rule.
C)predatory price-cutting policy.
D)the rule of law.
E)the rule of reason.
Unlock Deck
Unlock for access to all 88 flashcards in this deck.
Unlock Deck
k this deck
21
The figure below shows revenue and cost curves of a natural monopoly firm.Figure 14.1
In the figure,
D: Demand curve
MR: Marginal revenue curve
MC: Marginal cost curve
ATC: Average total cost curve
Refer to Figure 14.1. Identify the fair-rate-of-return price.
A)P5
B)P2
C)P4
D)P1
E)P3
In the figure,D: Demand curve
MR: Marginal revenue curve
MC: Marginal cost curve
ATC: Average total cost curve
Refer to Figure 14.1. Identify the fair-rate-of-return price.
A)P5
B)P2
C)P4
D)P1
E)P3
Unlock Deck
Unlock for access to all 88 flashcards in this deck.
Unlock Deck
k this deck
22
One necessary step in demonstrating monopolistic behavior is to define the market. In this process, defendants would:
A)claim that the market was not in equilibrium.
B)want the market defined as narrowly as possible.
C)deny that a market existed.
D)assert that the market was not stable.
E)want the market defined as broadly as possible.
Unlock Deck
Unlock for access to all 88 flashcards in this deck.
Unlock Deck
k this deck
23
A Herfindahl index of 5,000 would indicate:
A)a monopoly.
B)a duopoly (two firms) with equal shares.
C)an oligopoly with three firms.
D)a monopolistically competitive industry.
E)a perfectly competitive market.
Unlock Deck
Unlock for access to all 88 flashcards in this deck.
Unlock Deck
k this deck
24
A monopolistic industry will have a Herfindahl index value of:
A)1.
B)100.
C)500.
D)1000.
E)10.
Unlock Deck
Unlock for access to all 88 flashcards in this deck.
Unlock Deck
k this deck
25
The figure below shows revenue and cost curves of a natural monopoly firm.Figure 14.1
In the figure,
D: Demand curve
MR: Marginal revenue curve
MC: Marginal cost curve
ATC: Average total cost curve
According to Figure 14.1, the price under perfect competition will be:
A)P1.
B)P3.
C)P5.
D)P4.
E)P2.
In the figure,D: Demand curve
MR: Marginal revenue curve
MC: Marginal cost curve
ATC: Average total cost curve
According to Figure 14.1, the price under perfect competition will be:
A)P1.
B)P3.
C)P5.
D)P4.
E)P2.
Unlock Deck
Unlock for access to all 88 flashcards in this deck.
Unlock Deck
k this deck
26
The figure below shows revenue and cost curves of a natural monopoly firm.Figure 14.1
In the figure,
D: Demand curve
MR: Marginal revenue curve
MC: Marginal cost curve
ATC: Average total cost curve
Refer to Figure 14.1. The natural monopolist will charge a price equal to:
A)P4.
B)P3.
C)P2.
D)P1.
E)P5.
In the figure,D: Demand curve
MR: Marginal revenue curve
MC: Marginal cost curve
ATC: Average total cost curve
Refer to Figure 14.1. The natural monopolist will charge a price equal to:
A)P4.
B)P3.
C)P2.
D)P1.
E)P5.
Unlock Deck
Unlock for access to all 88 flashcards in this deck.
Unlock Deck
k this deck
27
The figure below shows revenue and cost curves of a natural monopoly firm.Figure 14.1
In the figure,
D: Demand curve
MR: Marginal revenue curve
MC: Marginal cost curve
ATC: Average total cost curve
Refer to Figure 14.1. If the regulatory agency sets the fair-rate-of-return price, the monopolist will:
A)suspend production.
B)just break even.
C)earn super normal profits.
D)incur losses.
E)be able to cover only the variable costs.
In the figure,D: Demand curve
MR: Marginal revenue curve
MC: Marginal cost curve
ATC: Average total cost curve
Refer to Figure 14.1. If the regulatory agency sets the fair-rate-of-return price, the monopolist will:
A)suspend production.
B)just break even.
C)earn super normal profits.
D)incur losses.
E)be able to cover only the variable costs.
Unlock Deck
Unlock for access to all 88 flashcards in this deck.
Unlock Deck
k this deck
28
A Herfindahl index value of 20, for a particular industry, indicates that the industry is most likely to be:
A)perfectly competitive.
B)highly concentrated.
C)oligopolistic.
D)monopolistic.
E)made up of illegal firms.
Unlock Deck
Unlock for access to all 88 flashcards in this deck.
Unlock Deck
k this deck
29
A market that is shared equally by 100 firms would have a Herfindahl index of :
A)1.
B)1,000.
C)500.
D)100.
E)50.
Unlock Deck
Unlock for access to all 88 flashcards in this deck.
Unlock Deck
k this deck
30
When regulators require that a natural monopoly sets price equal to average total cost:
A)it is said to be allowing a fair rate of return.
B)the firm earns a super normal profit.
C)the firm shuts down permanently.
D)the firm operates at the profit-maximizing level of output.
E)the firm shuts down temporarily.
Unlock Deck
Unlock for access to all 88 flashcards in this deck.
Unlock Deck
k this deck
31
Consider a market consisting of seven firms with market shares of 40, 20, 10, 10, 8, 7, and 5 percent, respectively. Which of the following statements is true?
A)The four-firm concentration ratio would be 0.03.
B)The Herfindahl index would be 1,000.
C)The Herfindahl index would be 2,228.
D)The Herfindahl index would be 1,500.
E)The Herfindahl index would be 2,338.
Unlock Deck
Unlock for access to all 88 flashcards in this deck.
Unlock Deck
k this deck
32
Which of the following statements is true of price fixing?
A)It represents a high level of competition in an industry.
B)It is allowed only under the provisions of the Federal Trade Commission Act.
C)It is, by definition, illegal, as there is no justification for it.
D)It occurs only in perfectly competitive industries.
E)It is legal in United States.
Unlock Deck
Unlock for access to all 88 flashcards in this deck.
Unlock Deck
k this deck
33
The figure below shows revenue and cost curves of a natural monopoly firm.Figure 14.1
In the figure,
D: Demand curve
MR: Marginal revenue curve
MC: Marginal cost curve
ATC: Average total cost curve
Which of the following is a possible reason for governments to regulate business operations?
A)To increase monopoly profits
B)To reduce the amount of information consumers have about a product
C)To increase negative externalities
D)To promote competitive behavior
E)To decrease positive externalities
In the figure,D: Demand curve
MR: Marginal revenue curve
MC: Marginal cost curve
ATC: Average total cost curve
Which of the following is a possible reason for governments to regulate business operations?
A)To increase monopoly profits
B)To reduce the amount of information consumers have about a product
C)To increase negative externalities
D)To promote competitive behavior
E)To decrease positive externalities
Unlock Deck
Unlock for access to all 88 flashcards in this deck.
Unlock Deck
k this deck
34
The figure below shows revenue and cost curves of a natural monopoly firm.Figure 14.1
In the figure,
D: Demand curve
MR: Marginal revenue curve
MC: Marginal cost curve
ATC: Average total cost curve
According to Figure 14.1, in order to attain allocative efficiency, the regulatory body must attempt to set the price equal to:
A)P2.
B)P3.
C)P1.
D)P4.
E)P5.
In the figure,D: Demand curve
MR: Marginal revenue curve
MC: Marginal cost curve
ATC: Average total cost curve
According to Figure 14.1, in order to attain allocative efficiency, the regulatory body must attempt to set the price equal to:
A)P2.
B)P3.
C)P1.
D)P4.
E)P5.
Unlock Deck
Unlock for access to all 88 flashcards in this deck.
Unlock Deck
k this deck
35
A regulated firm may have an incentive to spend an inefficiently high amount on capital when:
A)it becomes deregulated.
B)fair rate of return regulation is used.
C)regulators set price equal to marginal cost.
D)it is part of a monopolistically competitive industry.
E)it is allowed to charge a monopoly price.
Unlock Deck
Unlock for access to all 88 flashcards in this deck.
Unlock Deck
k this deck
36
In the United States, monopoly regulation began primarily because:
A)there were no natural monopolies in the real world.
B)the government wanted to promote other forms of business practices.
C)monopolies did not typically follow occupational and safety rules.
D)monopolies tended to restrict output and raise prices.
E)most economists believed that the majority of industries were following the purely competitive model.
Unlock Deck
Unlock for access to all 88 flashcards in this deck.
Unlock Deck
k this deck
37
Which of the following was formed in October 2001 to make the national antitrust laws more consistent across the developing and developed countries of the world?
A)International Cooperation Network
B)International Competition Network
C)International Communication Network
D)International Organization for Standardization
E)International Court of Justice
Unlock Deck
Unlock for access to all 88 flashcards in this deck.
Unlock Deck
k this deck
38
Which of the following statements best describes the difference between economic regulation and social regulation?
A)Economic regulation has little to do with price and output while social regulation explicitly deals with price and output.
B)Social regulation is concerned with direct redistribution of wealth while economic regulation is concerned with accumulation of wealth.
C)Economic regulation is concerned with direct redistribution of wealth while social regulation is concerned with accumulation of wealth.
D)Social regulation has historically targeted industries such as railroads and airlines while economic regulation has all the industries under its purview.
E)Economic regulation deals with price and output , while social regulation deals with health and safety matters that apply across several industries.
Unlock Deck
Unlock for access to all 88 flashcards in this deck.
Unlock Deck
k this deck
39
Most natural monopolies are regulated at some level by a government because:
A)an unregulated natural monopolist would cause the problem of capital outflow.
B)an unregulated natural monopolist would produce only for government bureaucrats.
C)an unregulated natural monopolist would charge an inefficiently low price in the market.
D)an unregulated natural monopolist would charge an inefficiently high price in the market.
E)an unregulated natural monopolist would incur losses.
Unlock Deck
Unlock for access to all 88 flashcards in this deck.
Unlock Deck
k this deck
40
Consider an oligopoly that has two firms, one with a 75 percent market share and the other with a 25 percent market share. The Herfindahl index for this market is:
A)5,625.
B)6,250.
C)625.
D)5,000.
E)8,500.
Unlock Deck
Unlock for access to all 88 flashcards in this deck.
Unlock Deck
k this deck
41
The figure below shows revenue and cost curves of a natural monopoly firm.Figure 14.1
In the figure,
D: Demand curve
MR: Marginal revenue curve
MC: Marginal cost curve
ATC: Average total cost curve
Which of the following calculations is necessary to determine whether a regulation should be implemented?
A)Marginal cost-marginal revenue calculations
B)Cost effectiveness calculations
C)Total cost-total revenue calculations
D)Cost minimization calculations
E)Cost-benefit calculations
In the figure,D: Demand curve
MR: Marginal revenue curve
MC: Marginal cost curve
ATC: Average total cost curve
Which of the following calculations is necessary to determine whether a regulation should be implemented?
A)Marginal cost-marginal revenue calculations
B)Cost effectiveness calculations
C)Total cost-total revenue calculations
D)Cost minimization calculations
E)Cost-benefit calculations
Unlock Deck
Unlock for access to all 88 flashcards in this deck.
Unlock Deck
k this deck
42
In the following figure, the first panel shows a market situation prior to regulation and the second panel shows the effects of regulation.Figure 14.2
In the figure,
D: Demand curve for automobiles
S1: Supply curve of automobiles prior to regulation
S2: Supply curve of automobiles after regulation
FG: Clean up cost per unit
Refer to Figure 14.2. The regulation will benefit the society if:
A)area BAJ > area 0FIQ2.
B)area AECJ > area IGQ1Q2.
C)area IGQ1Q2 > area AECJ.
D)area BAJ > BAC.
E)area 0FIQ2 > area BAJ.
In the figure,D: Demand curve for automobiles
S1: Supply curve of automobiles prior to regulation
S2: Supply curve of automobiles after regulation
FG: Clean up cost per unit
Refer to Figure 14.2. The regulation will benefit the society if:
A)area BAJ > area 0FIQ2.
B)area AECJ > area IGQ1Q2.
C)area IGQ1Q2 > area AECJ.
D)area BAJ > BAC.
E)area 0FIQ2 > area BAJ.
Unlock Deck
Unlock for access to all 88 flashcards in this deck.
Unlock Deck
k this deck
43
In the following figure, the first panel shows a market situation prior to regulation and the second panel shows the effects of regulation.Figure 14.2
In the figure,
D: Demand curve for automobiles
S1: Supply curve of automobiles prior to regulation
S2: Supply curve of automobiles after regulation
FG: Clean up cost per unit
Monetary freedom refers to:
A)the ability to create and operate an enterprise easily.
B)the absence of tariff and non-tariff barriers that affect imports of goods.
C)the tax burden and overall tax revenue of the government.
D)price stability with an assessment of price control.
E)the free flow of foreign capital.
In the figure,D: Demand curve for automobiles
S1: Supply curve of automobiles prior to regulation
S2: Supply curve of automobiles after regulation
FG: Clean up cost per unit
Monetary freedom refers to:
A)the ability to create and operate an enterprise easily.
B)the absence of tariff and non-tariff barriers that affect imports of goods.
C)the tax burden and overall tax revenue of the government.
D)price stability with an assessment of price control.
E)the free flow of foreign capital.
Unlock Deck
Unlock for access to all 88 flashcards in this deck.
Unlock Deck
k this deck
44
The figure below shows revenue and cost curves of a natural monopoly firm.Figure 14.1
In the figure,
D: Demand curve
MR: Marginal revenue curve
MC: Marginal cost curve
ATC: Average total cost curve
When regulating a natural monopoly, government officials face a dilemma that:
A)the efficient price may not allow the firm to break even.
B)the efficient price may lead to an inefficiently high level of output.
C)the efficient price leads to an output level that is too low.
D)the efficient price may force the firm to shut-down.
E)long-run average costs are constantly increasing.
In the figure,D: Demand curve
MR: Marginal revenue curve
MC: Marginal cost curve
ATC: Average total cost curve
When regulating a natural monopoly, government officials face a dilemma that:
A)the efficient price may not allow the firm to break even.
B)the efficient price may lead to an inefficiently high level of output.
C)the efficient price leads to an output level that is too low.
D)the efficient price may force the firm to shut-down.
E)long-run average costs are constantly increasing.
Unlock Deck
Unlock for access to all 88 flashcards in this deck.
Unlock Deck
k this deck
45
The figure below shows revenue and cost curves of a natural monopoly firm.Figure 14.1
In the figure,
D: Demand curve
MR: Marginal revenue curve
MC: Marginal cost curve
ATC: Average total cost curve
If social regulation causes the supply curve in a market to shift up because of higher marginal costs, then:
A)both consumer and producer surplus will decrease.
B)both producer and consumer surplus will increase.
C)consumers will gain at the expense of producers.
D)producers will gain at the expense of consumers.
E)there will be no change in the sum of producer and consumer surplus, although its division may change.
In the figure,D: Demand curve
MR: Marginal revenue curve
MC: Marginal cost curve
ATC: Average total cost curve
If social regulation causes the supply curve in a market to shift up because of higher marginal costs, then:
A)both consumer and producer surplus will decrease.
B)both producer and consumer surplus will increase.
C)consumers will gain at the expense of producers.
D)producers will gain at the expense of consumers.
E)there will be no change in the sum of producer and consumer surplus, although its division may change.
Unlock Deck
Unlock for access to all 88 flashcards in this deck.
Unlock Deck
k this deck
46
In the following figure, the first panel shows a market situation prior to regulation and the second panel shows the effects of regulation.Figure 14.2
In the figure,
D: Demand curve for automobiles
S1: Supply curve of automobiles prior to regulation
S2: Supply curve of automobiles after regulation
FG: Clean up cost per unit
What is the total social surplus prior to regulation, in Figure 14.2?
A)Area 0FGQ1.
B)Area BEP1.
C)Area CEP1.
D)Area FGEP1.
E)Area BEC.
In the figure,D: Demand curve for automobiles
S1: Supply curve of automobiles prior to regulation
S2: Supply curve of automobiles after regulation
FG: Clean up cost per unit
What is the total social surplus prior to regulation, in Figure 14.2?
A)Area 0FGQ1.
B)Area BEP1.
C)Area CEP1.
D)Area FGEP1.
E)Area BEC.
Unlock Deck
Unlock for access to all 88 flashcards in this deck.
Unlock Deck
k this deck
47
The figure below shows revenue and cost curves of a natural monopoly firm.Figure 14.1
In the figure,
D: Demand curve
MR: Marginal revenue curve
MC: Marginal cost curve
ATC: Average total cost curve
Why do the regulated companies oppose deregulation?
A)They would be deprived of an opportunity to compete with other firms.
B)They would be deprived of their rights to continue business.
C)They would be denied any kind of support from the government.
D)They would incur losses on account of increased competition.
E)They would become unpopular as they would no longer be controlled by the government.
In the figure,D: Demand curve
MR: Marginal revenue curve
MC: Marginal cost curve
ATC: Average total cost curve
Why do the regulated companies oppose deregulation?
A)They would be deprived of an opportunity to compete with other firms.
B)They would be deprived of their rights to continue business.
C)They would be denied any kind of support from the government.
D)They would incur losses on account of increased competition.
E)They would become unpopular as they would no longer be controlled by the government.
Unlock Deck
Unlock for access to all 88 flashcards in this deck.
Unlock Deck
k this deck
48
In the following figure, the first panel shows a market situation prior to regulation and the second panel shows the effects of regulation.Figure 14.2
In the figure,
D: Demand curve for automobiles
S1: Supply curve of automobiles prior to regulation
S2: Supply curve of automobiles after regulation
FG: Clean up cost per unit
According to Figure 14.2, the total clean up cost for the society prior to regulation is the:
A)area 0BEQ1.
B)area 0FIQ2.
C)area 0FGQ1.
D)area 0P1EQ1.
E)area 0CEQ1.
In the figure,D: Demand curve for automobiles
S1: Supply curve of automobiles prior to regulation
S2: Supply curve of automobiles after regulation
FG: Clean up cost per unit
According to Figure 14.2, the total clean up cost for the society prior to regulation is the:
A)area 0BEQ1.
B)area 0FIQ2.
C)area 0FGQ1.
D)area 0P1EQ1.
E)area 0CEQ1.
Unlock Deck
Unlock for access to all 88 flashcards in this deck.
Unlock Deck
k this deck
49
In the following figure, the first panel shows a market situation prior to regulation and the second panel shows the effects of regulation.Figure 14.2
In the figure,
D: Demand curve for automobiles
S1: Supply curve of automobiles prior to regulation
S2: Supply curve of automobiles after regulation
FG: Clean up cost per unit
According to Figure 14.2, the total clean up cost after the regulation is the:
A)area 0FIQ2.
B)area 0FGQ1.
C)area BEC.
D)area BEP1.
E)area BEGF.
In the figure,D: Demand curve for automobiles
S1: Supply curve of automobiles prior to regulation
S2: Supply curve of automobiles after regulation
FG: Clean up cost per unit
According to Figure 14.2, the total clean up cost after the regulation is the:
A)area 0FIQ2.
B)area 0FGQ1.
C)area BEC.
D)area BEP1.
E)area BEGF.
Unlock Deck
Unlock for access to all 88 flashcards in this deck.
Unlock Deck
k this deck
50
In the following figure, the first panel shows a market situation prior to regulation and the second panel shows the effects of regulation.Figure 14.2
In the figure,
D: Demand curve for automobiles
S1: Supply curve of automobiles prior to regulation
S2: Supply curve of automobiles after regulation
FG: Clean up cost per unit
Which of the following is true of the General Agreement on Tariffs and Trade (GATT)?
A)It is now called the World Agreement on Trade and Tariffs.
B)It was the global trade agreement that did away with the gold standard.
C)It was a policy of the United States to raise tariffs on imported sugar.
D)It was the first global trade agreement that followed World War II.
E)It was a global trade agreement to raise tariffs.
In the figure,D: Demand curve for automobiles
S1: Supply curve of automobiles prior to regulation
S2: Supply curve of automobiles after regulation
FG: Clean up cost per unit
Which of the following is true of the General Agreement on Tariffs and Trade (GATT)?
A)It is now called the World Agreement on Trade and Tariffs.
B)It was the global trade agreement that did away with the gold standard.
C)It was a policy of the United States to raise tariffs on imported sugar.
D)It was the first global trade agreement that followed World War II.
E)It was a global trade agreement to raise tariffs.
Unlock Deck
Unlock for access to all 88 flashcards in this deck.
Unlock Deck
k this deck
51
In the following figure, the first panel shows a market situation prior to regulation and the second panel shows the effects of regulation.Figure 14.2
In the figure,
D: Demand curve for automobiles
S1: Supply curve of automobiles prior to regulation
S2: Supply curve of automobiles after regulation
FG: Clean up cost per unit
According to the Index of Economic Freedom, which of the following is the freest economy in the world?
A)Cuba
B)Zimbabwe
C)Hong Kong
D)North Korea
E)Libya
In the figure,D: Demand curve for automobiles
S1: Supply curve of automobiles prior to regulation
S2: Supply curve of automobiles after regulation
FG: Clean up cost per unit
According to the Index of Economic Freedom, which of the following is the freest economy in the world?
A)Cuba
B)Zimbabwe
C)Hong Kong
D)North Korea
E)Libya
Unlock Deck
Unlock for access to all 88 flashcards in this deck.
Unlock Deck
k this deck
52
In the following figure, the first panel shows a market situation prior to regulation and the second panel shows the effects of regulation.Figure 14.2
In the figure,
D: Demand curve for automobiles
S1: Supply curve of automobiles prior to regulation
S2: Supply curve of automobiles after regulation
FG: Clean up cost per unit
According to Figure 14.2, the total social surplus after the regulation is the:
A)area BEC.
B)area AECJ.
C)area IGQ1Q2.
D)area 0FIQ2.
E)area BAJ.
In the figure,D: Demand curve for automobiles
S1: Supply curve of automobiles prior to regulation
S2: Supply curve of automobiles after regulation
FG: Clean up cost per unit
According to Figure 14.2, the total social surplus after the regulation is the:
A)area BEC.
B)area AECJ.
C)area IGQ1Q2.
D)area 0FIQ2.
E)area BAJ.
Unlock Deck
Unlock for access to all 88 flashcards in this deck.
Unlock Deck
k this deck
53
In the following figure, the first panel shows a market situation prior to regulation and the second panel shows the effects of regulation.Figure 14.2
In the figure,
D: Demand curve for automobiles
S1: Supply curve of automobiles prior to regulation
S2: Supply curve of automobiles after regulation
FG: Clean up cost per unit
Which of the following is not a component of the index which measures economic freedom of a country?
A)Monetary freedom
B)Cultural freedom
C)Government size
D)Freedom from corruption
E)Labor freedom
In the figure,D: Demand curve for automobiles
S1: Supply curve of automobiles prior to regulation
S2: Supply curve of automobiles after regulation
FG: Clean up cost per unit
Which of the following is not a component of the index which measures economic freedom of a country?
A)Monetary freedom
B)Cultural freedom
C)Government size
D)Freedom from corruption
E)Labor freedom
Unlock Deck
Unlock for access to all 88 flashcards in this deck.
Unlock Deck
k this deck
54
The figure below shows revenue and cost curves of a natural monopoly firm.Figure 14.1
In the figure,
D: Demand curve
MR: Marginal revenue curve
MC: Marginal cost curve
ATC: Average total cost curve
If social regulation increases a firm's fixed and variable costs:
A)then both marginal cost and average total cost will increase, and the firm will produce more.
B)then both marginal cost and average total cost will increase, and the firm will produce less.
C)then both marginal cost and average total cost will decrease, and profits will increase.
D)then marginal cost will increase, average total cost will be constant, and price will decline.
E)then both price and quantity produced will fall.
In the figure,D: Demand curve
MR: Marginal revenue curve
MC: Marginal cost curve
ATC: Average total cost curve
If social regulation increases a firm's fixed and variable costs:
A)then both marginal cost and average total cost will increase, and the firm will produce more.
B)then both marginal cost and average total cost will increase, and the firm will produce less.
C)then both marginal cost and average total cost will decrease, and profits will increase.
D)then marginal cost will increase, average total cost will be constant, and price will decline.
E)then both price and quantity produced will fall.
Unlock Deck
Unlock for access to all 88 flashcards in this deck.
Unlock Deck
k this deck
55
In the following figure, the first panel shows a market situation prior to regulation and the second panel shows the effects of regulation.Figure 14.2
In the figure,
D: Demand curve for automobiles
S1: Supply curve of automobiles prior to regulation
S2: Supply curve of automobiles after regulation
FG: Clean up cost per unit
Graphically, consumer surplus is the area:
A)above the demand curve.
B)below the supply curve.
C)under the demand curve and the supply curve.
D)above the market supply curve and under the equilibrium price.
E)under the market demand curve and above the equilibrium price.
In the figure,D: Demand curve for automobiles
S1: Supply curve of automobiles prior to regulation
S2: Supply curve of automobiles after regulation
FG: Clean up cost per unit
Graphically, consumer surplus is the area:
A)above the demand curve.
B)below the supply curve.
C)under the demand curve and the supply curve.
D)above the market supply curve and under the equilibrium price.
E)under the market demand curve and above the equilibrium price.
Unlock Deck
Unlock for access to all 88 flashcards in this deck.
Unlock Deck
k this deck
56
In the following figure, the first panel shows a market situation prior to regulation and the second panel shows the effects of regulation.Figure 14.2
In the figure,
D: Demand curve for automobiles
S1: Supply curve of automobiles prior to regulation
S2: Supply curve of automobiles after regulation
FG: Clean up cost per unit
Which of the following raises the economic freedom of a country?
A)Limited international movement of productive resources
B)Higher taxes
C)Red-tapism and bureaucracy
D)Reduction of trade barriers like tariffs and quotas
E)Reduction of government subsidies on gasoline
In the figure,D: Demand curve for automobiles
S1: Supply curve of automobiles prior to regulation
S2: Supply curve of automobiles after regulation
FG: Clean up cost per unit
Which of the following raises the economic freedom of a country?
A)Limited international movement of productive resources
B)Higher taxes
C)Red-tapism and bureaucracy
D)Reduction of trade barriers like tariffs and quotas
E)Reduction of government subsidies on gasoline
Unlock Deck
Unlock for access to all 88 flashcards in this deck.
Unlock Deck
k this deck
57
The figure below shows revenue and cost curves of a natural monopoly firm.Figure 14.1
In the figure,
D: Demand curve
MR: Marginal revenue curve
MC: Marginal cost curve
ATC: Average total cost curve
To avoid driving a natural monopolist into bankruptcy, regulatory commissions:
A)allow the monopolist to enjoy an economic profit.
B)do not allow the monopolist to make an accounting profit.
C)subsidize the monopolist to help it break even.
D)allow the monopolist to earn a fair rate of return.
E)allow the monopolist to temporarily shut down.
In the figure,D: Demand curve
MR: Marginal revenue curve
MC: Marginal cost curve
ATC: Average total cost curve
To avoid driving a natural monopolist into bankruptcy, regulatory commissions:
A)allow the monopolist to enjoy an economic profit.
B)do not allow the monopolist to make an accounting profit.
C)subsidize the monopolist to help it break even.
D)allow the monopolist to earn a fair rate of return.
E)allow the monopolist to temporarily shut down.
Unlock Deck
Unlock for access to all 88 flashcards in this deck.
Unlock Deck
k this deck
58
The figure below shows revenue and cost curves of a natural monopoly firm.Figure 14.1
In the figure,
D: Demand curve
MR: Marginal revenue curve
MC: Marginal cost curve
ATC: Average total cost curve
Which of the following factors will help determine how the costs of social regulation are split between consumers and producers?
A)The price elasticities of demand and supply
B)The quantity produced by the firm
C)The average total costs of the firm before regulation
D)The number of consumers in the market
E)The number of producers in the market
In the figure,D: Demand curve
MR: Marginal revenue curve
MC: Marginal cost curve
ATC: Average total cost curve
Which of the following factors will help determine how the costs of social regulation are split between consumers and producers?
A)The price elasticities of demand and supply
B)The quantity produced by the firm
C)The average total costs of the firm before regulation
D)The number of consumers in the market
E)The number of producers in the market
Unlock Deck
Unlock for access to all 88 flashcards in this deck.
Unlock Deck
k this deck
59
The figure below shows revenue and cost curves of a natural monopoly firm.Figure 14.1
In the figure,
D: Demand curve
MR: Marginal revenue curve
MC: Marginal cost curve
ATC: Average total cost curve
Which of the following is an example of the opportunity cost involved with social regulation?
A)The monetary costs of hiring administrative assistants to fill out OSHA safety reports
B)The environmental costs of pollution control required under the Clean Air Act
C)The monetary costs of laboratory trials required to try out a new drug
D)The lives that are lost because new drugs are not introduced quickly
E)The monetary cost of manufacturing a life saving drug
In the figure,D: Demand curve
MR: Marginal revenue curve
MC: Marginal cost curve
ATC: Average total cost curve
Which of the following is an example of the opportunity cost involved with social regulation?
A)The monetary costs of hiring administrative assistants to fill out OSHA safety reports
B)The environmental costs of pollution control required under the Clean Air Act
C)The monetary costs of laboratory trials required to try out a new drug
D)The lives that are lost because new drugs are not introduced quickly
E)The monetary cost of manufacturing a life saving drug
Unlock Deck
Unlock for access to all 88 flashcards in this deck.
Unlock Deck
k this deck
60
The figure below shows revenue and cost curves of a natural monopoly firm.Figure 14.1
In the figure,
D: Demand curve
MR: Marginal revenue curve
MC: Marginal cost curve
ATC: Average total cost curve
Suppose that the demand for apples in Washington is elastic and the supply is inelastic. If the government of Washington passes a law prohibiting the use of synthetic pesticides that increases the marginal and average costs of producing apples, then:
A)the price of Washington State apples will decline.
B)Washington will stop producing apples, and New York apple growers will benefit.
C)apple growers will pass most of the increased costs on to consumers in the form of higher apple prices.
D)apple growers will keep prices constant but reduce costs by advertising less.
E)apple growers will bear most of the increased costs of regulation, and prices will increase only slightly.
In the figure,D: Demand curve
MR: Marginal revenue curve
MC: Marginal cost curve
ATC: Average total cost curve
Suppose that the demand for apples in Washington is elastic and the supply is inelastic. If the government of Washington passes a law prohibiting the use of synthetic pesticides that increases the marginal and average costs of producing apples, then:
A)the price of Washington State apples will decline.
B)Washington will stop producing apples, and New York apple growers will benefit.
C)apple growers will pass most of the increased costs on to consumers in the form of higher apple prices.
D)apple growers will keep prices constant but reduce costs by advertising less.
E)apple growers will bear most of the increased costs of regulation, and prices will increase only slightly.
Unlock Deck
Unlock for access to all 88 flashcards in this deck.
Unlock Deck
k this deck
61
In the following figure, the first panel shows a market situation prior to regulation and the second panel shows the effects of regulation.Figure 14.2
In the figure,
D: Demand curve for automobiles
S1: Supply curve of automobiles prior to regulation
S2: Supply curve of automobiles after regulation
FG: Clean up cost per unit
Social regulation means that the government dictates the price that a firm must charge and/or the quantity that a firm must supply.
In the figure,D: Demand curve for automobiles
S1: Supply curve of automobiles prior to regulation
S2: Supply curve of automobiles after regulation
FG: Clean up cost per unit
Social regulation means that the government dictates the price that a firm must charge and/or the quantity that a firm must supply.
Unlock Deck
Unlock for access to all 88 flashcards in this deck.
Unlock Deck
k this deck
62
In the following figure, the first panel shows a market situation prior to regulation and the second panel shows the effects of regulation.Figure 14.2
In the figure,
D: Demand curve for automobiles
S1: Supply curve of automobiles prior to regulation
S2: Supply curve of automobiles after regulation
FG: Clean up cost per unit
According to the per se rule, activities that were potentially monopolizing tactics were illegal.
In the figure,D: Demand curve for automobiles
S1: Supply curve of automobiles prior to regulation
S2: Supply curve of automobiles after regulation
FG: Clean up cost per unit
According to the per se rule, activities that were potentially monopolizing tactics were illegal.
Unlock Deck
Unlock for access to all 88 flashcards in this deck.
Unlock Deck
k this deck
63
In the following figure, the first panel shows a market situation prior to regulation and the second panel shows the effects of regulation.Figure 14.2
In the figure,
D: Demand curve for automobiles
S1: Supply curve of automobiles prior to regulation
S2: Supply curve of automobiles after regulation
FG: Clean up cost per unit
If there are 50 firms in the industry, and each have an equal market share, the Herfindahl index will be equal to 1,00,000.
In the figure,D: Demand curve for automobiles
S1: Supply curve of automobiles prior to regulation
S2: Supply curve of automobiles after regulation
FG: Clean up cost per unit
If there are 50 firms in the industry, and each have an equal market share, the Herfindahl index will be equal to 1,00,000.
Unlock Deck
Unlock for access to all 88 flashcards in this deck.
Unlock Deck
k this deck
64
In the following figure, the first panel shows a market situation prior to regulation and the second panel shows the effects of regulation.Figure 14.2
In the figure,
D: Demand curve for automobiles
S1: Supply curve of automobiles prior to regulation
S2: Supply curve of automobiles after regulation
FG: Clean up cost per unit
A regulated natural monopoly is allowed to set a price which will enable it to earn an above-normal profit.
In the figure,D: Demand curve for automobiles
S1: Supply curve of automobiles prior to regulation
S2: Supply curve of automobiles after regulation
FG: Clean up cost per unit
A regulated natural monopoly is allowed to set a price which will enable it to earn an above-normal profit.
Unlock Deck
Unlock for access to all 88 flashcards in this deck.
Unlock Deck
k this deck
65
In the following figure, the first panel shows a market situation prior to regulation and the second panel shows the effects of regulation.Figure 14.2
In the figure,
D: Demand curve for automobiles
S1: Supply curve of automobiles prior to regulation
S2: Supply curve of automobiles after regulation
FG: Clean up cost per unit
In a natural monopoly, government regulation is often used to ensure more beneficial price and output combinations for consumers in the market than would exist in the absence of regulation.
In the figure,D: Demand curve for automobiles
S1: Supply curve of automobiles prior to regulation
S2: Supply curve of automobiles after regulation
FG: Clean up cost per unit
In a natural monopoly, government regulation is often used to ensure more beneficial price and output combinations for consumers in the market than would exist in the absence of regulation.
Unlock Deck
Unlock for access to all 88 flashcards in this deck.
Unlock Deck
k this deck
66
In the following figure, the first panel shows a market situation prior to regulation and the second panel shows the effects of regulation.Figure 14.2
In the figure,
D: Demand curve for automobiles
S1: Supply curve of automobiles prior to regulation
S2: Supply curve of automobiles after regulation
FG: Clean up cost per unit
Restrictions on the types of food additives that breakfast cereal manufacturers can use is an example of a social regulation.
In the figure,D: Demand curve for automobiles
S1: Supply curve of automobiles prior to regulation
S2: Supply curve of automobiles after regulation
FG: Clean up cost per unit
Restrictions on the types of food additives that breakfast cereal manufacturers can use is an example of a social regulation.
Unlock Deck
Unlock for access to all 88 flashcards in this deck.
Unlock Deck
k this deck
67
In the following figure, the first panel shows a market situation prior to regulation and the second panel shows the effects of regulation.Figure 14.2
In the figure,
D: Demand curve for automobiles
S1: Supply curve of automobiles prior to regulation
S2: Supply curve of automobiles after regulation
FG: Clean up cost per unit
If a market is narrowly defined, the market share of each firm declines than if it is broadly defined.
In the figure,D: Demand curve for automobiles
S1: Supply curve of automobiles prior to regulation
S2: Supply curve of automobiles after regulation
FG: Clean up cost per unit
If a market is narrowly defined, the market share of each firm declines than if it is broadly defined.
Unlock Deck
Unlock for access to all 88 flashcards in this deck.
Unlock Deck
k this deck
68
In the following figure, the first panel shows a market situation prior to regulation and the second panel shows the effects of regulation.Figure 14.2
In the figure,
D: Demand curve for automobiles
S1: Supply curve of automobiles prior to regulation
S2: Supply curve of automobiles after regulation
FG: Clean up cost per unit
Delegates from different countries of the world met at Geneva in April 1947 which resulted in the formation of the first global trade agreement. Its main objective was:
A)to create multiple trade barriers in the member countries.
B)to enable the member countries to maintain their autarkic conditions.
C)to provide security to the domestic producers of the member countries by prohibiting international trade.
D)to create an atmosphere of economic rivalry in the international sphere.
E)to liberalize trade for mutual prosperity of the members.
In the figure,D: Demand curve for automobiles
S1: Supply curve of automobiles prior to regulation
S2: Supply curve of automobiles after regulation
FG: Clean up cost per unit
Delegates from different countries of the world met at Geneva in April 1947 which resulted in the formation of the first global trade agreement. Its main objective was:
A)to create multiple trade barriers in the member countries.
B)to enable the member countries to maintain their autarkic conditions.
C)to provide security to the domestic producers of the member countries by prohibiting international trade.
D)to create an atmosphere of economic rivalry in the international sphere.
E)to liberalize trade for mutual prosperity of the members.
Unlock Deck
Unlock for access to all 88 flashcards in this deck.
Unlock Deck
k this deck
69
In the following figure, the first panel shows a market situation prior to regulation and the second panel shows the effects of regulation.Figure 14.2
In the figure,
D: Demand curve for automobiles
S1: Supply curve of automobiles prior to regulation
S2: Supply curve of automobiles after regulation
FG: Clean up cost per unit
One difference between economic and social regulation is that economic regulation usually pertains to a specific industry, whereas social regulation applies to most if not all industries.
In the figure,D: Demand curve for automobiles
S1: Supply curve of automobiles prior to regulation
S2: Supply curve of automobiles after regulation
FG: Clean up cost per unit
One difference between economic and social regulation is that economic regulation usually pertains to a specific industry, whereas social regulation applies to most if not all industries.
Unlock Deck
Unlock for access to all 88 flashcards in this deck.
Unlock Deck
k this deck
70
In the following figure, the first panel shows a market situation prior to regulation and the second panel shows the effects of regulation.Figure 14.2
In the figure,
D: Demand curve for automobiles
S1: Supply curve of automobiles prior to regulation
S2: Supply curve of automobiles after regulation
FG: Clean up cost per unit
Regulation of monopolies is justified on the ground that a monopolist sells too less at a too high price.
In the figure,D: Demand curve for automobiles
S1: Supply curve of automobiles prior to regulation
S2: Supply curve of automobiles after regulation
FG: Clean up cost per unit
Regulation of monopolies is justified on the ground that a monopolist sells too less at a too high price.
Unlock Deck
Unlock for access to all 88 flashcards in this deck.
Unlock Deck
k this deck
71
In the following figure, the first panel shows a market situation prior to regulation and the second panel shows the effects of regulation.Figure 14.2
In the figure,
D: Demand curve for automobiles
S1: Supply curve of automobiles prior to regulation
S2: Supply curve of automobiles after regulation
FG: Clean up cost per unit
If the Herfindahl index for automobiles take foreign competition into account, the Herfindahl index for the U.S. automobile industry would be significantly higher.
In the figure,D: Demand curve for automobiles
S1: Supply curve of automobiles prior to regulation
S2: Supply curve of automobiles after regulation
FG: Clean up cost per unit
If the Herfindahl index for automobiles take foreign competition into account, the Herfindahl index for the U.S. automobile industry would be significantly higher.
Unlock Deck
Unlock for access to all 88 flashcards in this deck.
Unlock Deck
k this deck
72
In the following figure, the first panel shows a market situation prior to regulation and the second panel shows the effects of regulation.Figure 14.2
In the figure,
D: Demand curve for automobiles
S1: Supply curve of automobiles prior to regulation
S2: Supply curve of automobiles after regulation
FG: Clean up cost per unit
Actions against alleged violators of the antitrust statutes may be initiated by the Justice Department, by the Federal Trade Commission, and by private plaintiffs.
In the figure,D: Demand curve for automobiles
S1: Supply curve of automobiles prior to regulation
S2: Supply curve of automobiles after regulation
FG: Clean up cost per unit
Actions against alleged violators of the antitrust statutes may be initiated by the Justice Department, by the Federal Trade Commission, and by private plaintiffs.
Unlock Deck
Unlock for access to all 88 flashcards in this deck.
Unlock Deck
k this deck
73
In the following figure, the first panel shows a market situation prior to regulation and the second panel shows the effects of regulation.Figure 14.2
In the figure,
D: Demand curve for automobiles
S1: Supply curve of automobiles prior to regulation
S2: Supply curve of automobiles after regulation
FG: Clean up cost per unit
Regulation of enterprises by the government has always been found to make the market more efficient.
In the figure,D: Demand curve for automobiles
S1: Supply curve of automobiles prior to regulation
S2: Supply curve of automobiles after regulation
FG: Clean up cost per unit
Regulation of enterprises by the government has always been found to make the market more efficient.
Unlock Deck
Unlock for access to all 88 flashcards in this deck.
Unlock Deck
k this deck
74
In the following figure, the first panel shows a market situation prior to regulation and the second panel shows the effects of regulation.Figure 14.2
In the figure,
D: Demand curve for automobiles
S1: Supply curve of automobiles prior to regulation
S2: Supply curve of automobiles after regulation
FG: Clean up cost per unit
Sherman Antitrust Act bans price discrimination that substantially lessens competition or injures particular competitors.
In the figure,D: Demand curve for automobiles
S1: Supply curve of automobiles prior to regulation
S2: Supply curve of automobiles after regulation
FG: Clean up cost per unit
Sherman Antitrust Act bans price discrimination that substantially lessens competition or injures particular competitors.
Unlock Deck
Unlock for access to all 88 flashcards in this deck.
Unlock Deck
k this deck
75
In the following figure, the first panel shows a market situation prior to regulation and the second panel shows the effects of regulation.Figure 14.2
In the figure,
D: Demand curve for automobiles
S1: Supply curve of automobiles prior to regulation
S2: Supply curve of automobiles after regulation
FG: Clean up cost per unit
Antitrust policies are a set of measures which are taken to liberate the economy from unnecessary governmental controls.
In the figure,D: Demand curve for automobiles
S1: Supply curve of automobiles prior to regulation
S2: Supply curve of automobiles after regulation
FG: Clean up cost per unit
Antitrust policies are a set of measures which are taken to liberate the economy from unnecessary governmental controls.
Unlock Deck
Unlock for access to all 88 flashcards in this deck.
Unlock Deck
k this deck
76
In the following figure, the first panel shows a market situation prior to regulation and the second panel shows the effects of regulation.Figure 14.2
In the figure,
D: Demand curve for automobiles
S1: Supply curve of automobiles prior to regulation
S2: Supply curve of automobiles after regulation
FG: Clean up cost per unit
Being a monopoly or attempting to monopolize act as sufficient evidence that lead to a guilty verdict under the rule of reason.
In the figure,D: Demand curve for automobiles
S1: Supply curve of automobiles prior to regulation
S2: Supply curve of automobiles after regulation
FG: Clean up cost per unit
Being a monopoly or attempting to monopolize act as sufficient evidence that lead to a guilty verdict under the rule of reason.
Unlock Deck
Unlock for access to all 88 flashcards in this deck.
Unlock Deck
k this deck
77
In the following figure, the first panel shows a market situation prior to regulation and the second panel shows the effects of regulation.Figure 14.2
In the figure,
D: Demand curve for automobiles
S1: Supply curve of automobiles prior to regulation
S2: Supply curve of automobiles after regulation
FG: Clean up cost per unit
Antitrust laws in the United States rely more on economic theory and the rule of reason approach, whereas the European Union relies more on the per se approach.
In the figure,D: Demand curve for automobiles
S1: Supply curve of automobiles prior to regulation
S2: Supply curve of automobiles after regulation
FG: Clean up cost per unit
Antitrust laws in the United States rely more on economic theory and the rule of reason approach, whereas the European Union relies more on the per se approach.
Unlock Deck
Unlock for access to all 88 flashcards in this deck.
Unlock Deck
k this deck
78
In the following figure, the first panel shows a market situation prior to regulation and the second panel shows the effects of regulation.Figure 14.2
In the figure,
D: Demand curve for automobiles
S1: Supply curve of automobiles prior to regulation
S2: Supply curve of automobiles after regulation
FG: Clean up cost per unit
Under the Clinton administration, attempts were made to relax the antitrust enforcement efforts of the Reagan administration.
In the figure,D: Demand curve for automobiles
S1: Supply curve of automobiles prior to regulation
S2: Supply curve of automobiles after regulation
FG: Clean up cost per unit
Under the Clinton administration, attempts were made to relax the antitrust enforcement efforts of the Reagan administration.
Unlock Deck
Unlock for access to all 88 flashcards in this deck.
Unlock Deck
k this deck
79
In the following figure, the first panel shows a market situation prior to regulation and the second panel shows the effects of regulation.Figure 14.2
In the figure,
D: Demand curve for automobiles
S1: Supply curve of automobiles prior to regulation
S2: Supply curve of automobiles after regulation
FG: Clean up cost per unit
When a monopoly is regulated it is required to sell lower output at a lower price.
In the figure,D: Demand curve for automobiles
S1: Supply curve of automobiles prior to regulation
S2: Supply curve of automobiles after regulation
FG: Clean up cost per unit
When a monopoly is regulated it is required to sell lower output at a lower price.
Unlock Deck
Unlock for access to all 88 flashcards in this deck.
Unlock Deck
k this deck
80
In the following figure, the first panel shows a market situation prior to regulation and the second panel shows the effects of regulation.Figure 14.2
In the figure,
D: Demand curve for automobiles
S1: Supply curve of automobiles prior to regulation
S2: Supply curve of automobiles after regulation
FG: Clean up cost per unit
Although the GATT was supported by most of the countries of the world, yet global trade shrank during the close of the last decade. This was due to:
A)growing suspicion among the nations of the world.
B)hyperinflation in the major economies of the world.
C)the recession which began in 2007.
D)political turmoil in the Asian countries.
E)the desire among the major players to dominate the international market.
In the figure,D: Demand curve for automobiles
S1: Supply curve of automobiles prior to regulation
S2: Supply curve of automobiles after regulation
FG: Clean up cost per unit
Although the GATT was supported by most of the countries of the world, yet global trade shrank during the close of the last decade. This was due to:
A)growing suspicion among the nations of the world.
B)hyperinflation in the major economies of the world.
C)the recession which began in 2007.
D)political turmoil in the Asian countries.
E)the desire among the major players to dominate the international market.
Unlock Deck
Unlock for access to all 88 flashcards in this deck.
Unlock Deck
k this deck
Unlock Deck
Unlock for access to all 88 flashcards in this deck.


