Deck 3: Markets and the Price System
Full screen (f)
Question
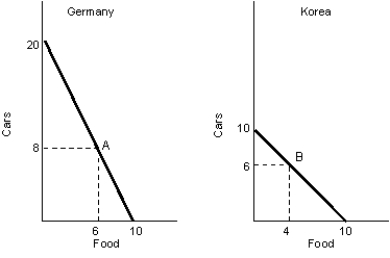
The figure given below represents the PPC in two nations - Germany and Korea, producing only two goods, cars and food.Figure 2.4
Consider a demand curve for peaches. Which of the following movements will be observed if the price of peaches decline at a point in time?
A)The demand curve will rotate inward at the given price level.
B)The will be a movement up along the demand curve.
C)The demand curve will rotate outward at the given price level.
D)There will be a downward movement along the demand curve.
E)The demand curve will become steeper.
Question
The figure given below represents the PPC in two nations - Germany and Korea, producing only two goods, cars and food.Figure 2.4
The term barter refers to exchanges made:
A)only with the use of money.
B)without the use of money.
C)outside the U.S. economy.
D)only in underdeveloped countries.
E)within countries in a monetary union.
The term barter refers to exchanges made:
A)only with the use of money.
B)without the use of money.
C)outside the U.S. economy.
D)only in underdeveloped countries.
E)within countries in a monetary union.
Question
The figure given below represents the PPC in two nations - Germany and Korea, producing only two goods, cars and food.Figure 2.4
The downward slope of the demand curve is attributed to:
A)the inverse relationship between price and quantity demanded.
B)the direct relationship between income and quantity demanded.
C)the direct relationship between price and quantity demanded.
D)the inverse relationship between income and quantity demanded.
E)the direct relationship between consumer preferences and quantity demanded.
Question
The figure given below represents the PPC in two nations - Germany and Korea, producing only two goods, cars and food.Figure 2.4
The exchange of goods and services directly without money is called:
A)creative destruction.
B)barter.
C)arbitration.
D)currency trade.
E)illegal trade.
The exchange of goods and services directly without money is called:
A)creative destruction.
B)barter.
C)arbitration.
D)currency trade.
E)illegal trade.
Question
The figure given below represents the PPC in two nations - Germany and Korea, producing only two goods, cars and food.Figure 2.4
_______ ensure that resources are allocated to where they are most highly valued.
A)Communist governments
B)Consumers
C)Suppliers
D)Non-governmental organizations
E)Markets
_______ ensure that resources are allocated to where they are most highly valued.
A)Communist governments
B)Consumers
C)Suppliers
D)Non-governmental organizations
E)Markets
Question
The figure given below represents the PPC in two nations - Germany and Korea, producing only two goods, cars and food.Figure 2.4
Which of the following statements is not true about a market system?
A)The market system provides an incentive to consumers to acquire purchasing ability.
B)The market system magnifies the problem of scarcity of goods and services.
C)The market system provides an incentive for allocating resources.
D)The market system provides an incentive to improve the quality of goods produced.
E)The market system provides everything everyone wants to consume.
Question
The figure given below represents the PPC in two nations - Germany and Korea, producing only two goods, cars and food.Figure 2.4
Which of the following statements correctly defines the law of demand?
A)The lower the price of a commodity, the lower the quantity demanded of that commodity.
B)As the price of a commodity increases, the quantity demanded of that commodity also increases.
C)The lower the price of a commodity, the greater the quantity demanded of that commodity.
D)The lower the price of a commodity, the greater the quantity supplied of that commodity.
E)The quantity demanded of a particular good decreases with an increase in the price of a substitute good.
Question
The figure given below represents the PPC in two nations - Germany and Korea, producing only two goods, cars and food.Figure 2.4
The market demand curve is derived by:
A)studying an individual's demand for a product over a year.
B)comparing the monthly consumption of a group of people.
C)surveying a set of consumers and ascertaining their preferences.
D)adding up the quantities that consumers in a market are willing and able to purchase at each price.
E)calculating the average price a random sample of consumers are willing to pay for a product.
Question
The figure given below represents the PPC in two nations - Germany and Korea, producing only two goods, cars and food.Figure 2.4
Money exchanges are more efficient than barter because:
A)money exchanges do not require a double coincidence of wants.
B)the government guarantees the value of money.
C)money usually has an intrinsic value.
D)money is backed by a physical commodity.
E)opportunity costs are higher with barter trades.
Question
The figure given below represents the PPC in two nations - Germany and Korea, producing only two goods, cars and food.Figure 2.4
The demand curve of a commodity slopes downward because of:
A)the insatiable nature of human wants.
B)the presence of double coincidence of wants.
C)the law of demand.
D)the scarcity of goods and services in an economy.
E)the law of diminishing marginal utility.
The demand curve of a commodity slopes downward because of:
A)the insatiable nature of human wants.
B)the presence of double coincidence of wants.
C)the law of demand.
D)the scarcity of goods and services in an economy.
E)the law of diminishing marginal utility.
Question
The figure given below represents the PPC in two nations - Germany and Korea, producing only two goods, cars and food.Figure 2.4
Barter can best be defined as:
A)the direct exchange of one good for money.
B)the direct exchange of money for a good.
C)the direct exchange of goods and services without the use of money.
D)the direct exchange of labor services for wages.
E)the payment of interest on a savings account.
Barter can best be defined as:
A)the direct exchange of one good for money.
B)the direct exchange of money for a good.
C)the direct exchange of goods and services without the use of money.
D)the direct exchange of labor services for wages.
E)the payment of interest on a savings account.
Question
The figure given below represents the PPC in two nations - Germany and Korea, producing only two goods, cars and food.Figure 2.4
According to the law of demand, if the price of movie rentals decreases, ceteris paribus,:
A)the demand for movie rentals would increase.
B)the quantity demanded of movie rentals would decrease.
C)the quantity demanded of movie rentals would increase.
D)the demand for movie rentals would decrease.
E)the quantity demanded of movie rentals would not change.
Question
The figure given below represents the PPC in two nations - Germany and Korea, producing only two goods, cars and food.Figure 2.4
Which of the following determines the quantity demanded of a commodity?
A)The income levels of consumers
B)The price of the commodity
C)The prices of related commodities
D)The number of buyers
E)Consumers' expectations
Which of the following determines the quantity demanded of a commodity?
A)The income levels of consumers
B)The price of the commodity
C)The prices of related commodities
D)The number of buyers
E)Consumers' expectations
Question
The figure given below represents the PPC in two nations - Germany and Korea, producing only two goods, cars and food.Figure 2.4
Other things remaining the same, an individual demand schedule shows the various quantities of a good:
A)that a person wants and is able to purchase at alternative prices.
B)that are demanded with a change in the quantity demanded of a substitute good.
C)that a person is able to purchase at alternative income levels.
D)that are demanded at various levels of utility.
E)that are demanded by the market at various prices.
Question
The figure given below represents the PPC in two nations - Germany and Korea, producing only two goods, cars and food.Figure 2.4
Margaret can use her quarterly savings to buy a teakwood study table for her room or spend it on a small Christmas party with her family. The _____ cost of her enjoyment at the Christmas party would then equal the forgone utility of the study table.
A)transaction
B)exchange
C)opportunity
D)direct
E)sunk
Question
The figure given below represents the PPC in two nations - Germany and Korea, producing only two goods, cars and food.Figure 2.4
Most markets involve the use of money for transactions because:
A)goods and services can be exchanged more easily with money than without it.
B)goods and services cannot be exchanged without money.
C)using money requires a double coincidence of wants.
D)the transaction costs of using money are very high.
E)the value of money remains same across countries over time.
Question
The figure given below represents the PPC in two nations - Germany and Korea, producing only two goods, cars and food.Figure 2.4
Identify the correct statement.
A)Demand is the total quantity of a product that people are willing, even if unable, to purchase at a given price.
B)Demand for a product is the same as the quantity demanded of a product.
C)Demand represents the different quantities of a good or service that provides consumers the same amount of utility.
D)Demand is the quantity of a product that people are willing and able to purchase at different prices.
E)Demand is the quantity of a product that producers are willing to produce at a particular price.
Question
The figure given below represents the PPC in two nations - Germany and Korea, producing only two goods, cars and food.Figure 2.4
The amount of a product that people are willing and able to purchase at a specific price is referred to as the:
A)demand.
B)quantity demanded.
C)law of demand.
D)consumption function.
E)purchasing power.
The amount of a product that people are willing and able to purchase at a specific price is referred to as the:
A)demand.
B)quantity demanded.
C)law of demand.
D)consumption function.
E)purchasing power.
Question
The figure given below represents the PPC in two nations - Germany and Korea, producing only two goods, cars and food.Figure 2.4
Given that resources can be allocated by the government, the market, a random process, or on a first-come first-serve basis, which of the following statements is true?
A)The market system is not entirely fair but it creates incentives to increase supplies and improve standards of living.
B)The random process of allocation allows individuals to acquire purchasing power and enhances the value of the resources that they own.
C)Since the government system does not distinguish between those who have income and those that do not, government allocation of resources is the most efficient.
D)There will be no shortages under the first-come first-serve basis of allocation.
E)A random process of allocation is fair in the sense that everyone gains and there are no losers.
Question
The figure given below represents the PPC in two nations - Germany and Korea, producing only two goods, cars and food.Figure 2.4
Barter requires a double coincidence of wants. This means that:
A)at least two traders must demand a commodity.
B)any two traders involved in a transaction must have money.
C)each trader must demand at least two commodities.
D)either of the two traders involved in a transaction must have money.
E)when two traders are involved in a transaction each trader must want what the other has to offer.
Question
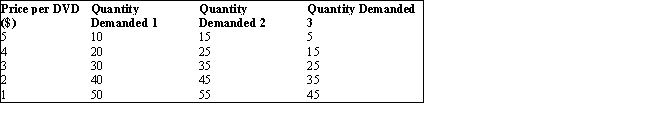
The table given below reports the quantity demanded of a good by individuals 1, 2, and 3 at different prices.Table 3.1
Ceteris paribus, a change in the quantity supplied along the supply curve of Braun coffee makers is:
A)directly related to the price of a Morphy Richards coffee maker.
B)directly related to the price of milk and cream.
C)directly related to the prices of inputs used in the production of Braun coffee makers.
D)directly related to changes in the technology used in producing coffee makers.
E)directly related to the price of a Braun coffee maker.
Question
The table given below reports the quantity demanded of a good by individuals 1, 2, and 3 at different prices.Table 3.1
Refer to Table 3.1. If Quantity Demanded 1, Quantity Demanded 2, and Quantity Demanded 3 are market demand schedules, then the change from Quantity Demanded 1 to Quantity Demanded 3 may have been due to:
A)an increase in price.
B)an increase in the number of sellers.
C)a decrease in price.
D)a decrease in the number of buyers.
E)an increase in the price of a substitute good.
Question
The table given below reports the quantity demanded of a good by individuals 1, 2, and 3 at different prices.Table 3.1
Which of the following will have no impact on the demand for ice cream in the short run?
A)A change in population size
B)A change in the price of ice cream
C)A change in seasons
D)A change in consumer preferences
E)A change in consumer incomes
Which of the following will have no impact on the demand for ice cream in the short run?
A)A change in population size
B)A change in the price of ice cream
C)A change in seasons
D)A change in consumer preferences
E)A change in consumer incomes
Question
The table given below reports the quantity demanded of a good by individuals 1, 2, and 3 at different prices.Table 3.1
Other things remaining unchanged, which of the following is a determinant of the quantity supplied of a good?
A)The cost of inputs used in production
B)The price of the product
C)The income levels of consumers
D)The price expectations of producers
E)The preferences of consumers
Other things remaining unchanged, which of the following is a determinant of the quantity supplied of a good?
A)The cost of inputs used in production
B)The price of the product
C)The income levels of consumers
D)The price expectations of producers
E)The preferences of consumers
Question
The table given below reports the quantity demanded of a good by individuals 1, 2, and 3 at different prices.Table 3.1
If the price of hot dogs were to decrease, which of the following changes would we expect to occur in the hot dog bun market?
A)The equilibrium price of hot dog buns would decrease and the quantity of hot dog buns sold would increase.
B)The equilibrium price of hot dog buns would increase and the quantity of hot dog buns sold would decrease.
C)The equilibrium price of hot dog buns would increase and the quantity of hot dog buns sold would increase.
D)The equilibrium price of hot dog buns would decrease and the quantity of hot dog buns sold would decrease.
E)The equilibrium price of hot dog buns would stay the same and the quantity of hot dog buns sold would increase.
Question
The table given below reports the quantity demanded of a good by individuals 1, 2, and 3 at different prices.Table 3.1
Refer to Table 3.1. Calculate the market demand at prices $5, $4, $3, $2, and $1 respectively.
A)Market demand is 30, 40, 50, 60, and 70
B)Market demand is 30, 60, 90, 120, and 150
C)Market demand is 30, 50, 70, 90, and 1,100
D)Market demand is 10, 30, 40, 50, and 70
E)Market demand is 10, 20, 30, 40, and 50
Question
The table given below reports the quantity demanded of a good by individuals 1, 2, and 3 at different prices.Table 3.1
Which of the following will cause an inward shift in the demand for steaks at a restaurant?
A)A report by the American Medical Association states that the consumption of steak reduces the risk of cardiovascular disease
B)A 50 percent reduction in the price of steaks
C)A double-digit increase in the price of chicken
D)A recession leading to a significant fall in the income levels of consumers
E)The expectation that the price of steaks will double within two months
Question
The table given below reports the quantity demanded of a good by individuals 1, 2, and 3 at different prices.Table 3.1
Last year a firm made 1,000 units of its product available at a price of $5 per unit. This year the firm will still make 1,000 units available, but only if the price is $7 per unit. What is most likely to have happened?
A)Supply has increased
B)Supply has decreased
C)Demand has decreased
D)Quantity demanded has increased
E)Quantity supplied has increased
Question
The table given below reports the quantity demanded of a good by individuals 1, 2, and 3 at different prices.Table 3.1
Which of the following will cause an increase in the quantity demanded of ice cream at an ice cream store?
A)The onset of summer brings about an increase in the temperature.
B)The price of frozen yogurt that is sold at the store is reduced by 5 percent.
C)A new ice cream flavor is introduced at the store.
D)The store introduces a limited period offer of 20 percent off on the price of ice cream.
E)The income of the store's consumers increases.
Question
The table given below reports the quantity demanded of a good by individuals 1, 2, and 3 at different prices.Table 3.1
Other things remaining the same, when a fall in the price of one good is followed by an increase in the demand for another good, both goods are said to be:
A)inferior goods.
B)substitute goods.
C)Giffen goods.
D)public goods.
E)complementary goods.
Other things remaining the same, when a fall in the price of one good is followed by an increase in the demand for another good, both goods are said to be:
A)inferior goods.
B)substitute goods.
C)Giffen goods.
D)public goods.
E)complementary goods.
Question
The table given below reports the quantity demanded of a good by individuals 1, 2, and 3 at different prices.Table 3.1
Assume that a hurricane in Brazil destroys half of the coffee crop. Considering that Brazil is a major coffee producing country, consumers expect the price of coffee to increase in the near future. How does this reflect on the demand for coffee?
A)There is a movement upward along the demand curve for coffee.
B)The demand curve for coffee shifts inward.
C)The demand curve for coffee shifts outward.
D)There is a movement downward along the demand curve for coffee.
E)The demand for coffee declines.
Question
The table given below reports the quantity demanded of a good by individuals 1, 2, and 3 at different prices.Table 3.1
Which of the following would lead to a rightward shift in the demand curve for golf balls?
A)An increase in the price of golf clubs
B)A decrease in the popularity of golf
C)An increase in the number of golfers
D)A decrease in the price of golf balls
E)An increase in the golf club membership fee
Which of the following would lead to a rightward shift in the demand curve for golf balls?
A)An increase in the price of golf clubs
B)A decrease in the popularity of golf
C)An increase in the number of golfers
D)A decrease in the price of golf balls
E)An increase in the golf club membership fee
Question
The table given below reports the quantity demanded of a good by individuals 1, 2, and 3 at different prices.Table 3.1
If an increase in the price of good X causes the demand curve for product Y to shift to the right, then X and Y are most likely to be which of the following?
A)Shoes and laces
B)Tennis balls and tennis rackets
C)Turkey and chicken
D)Knives and forks
E)DVD players and DVDs
If an increase in the price of good X causes the demand curve for product Y to shift to the right, then X and Y are most likely to be which of the following?
A)Shoes and laces
B)Tennis balls and tennis rackets
C)Turkey and chicken
D)Knives and forks
E)DVD players and DVDs
Question
The table given below reports the quantity demanded of a good by individuals 1, 2, and 3 at different prices.Table 3.1
The change in the quantity demanded of any good is always caused by:
A)a change in consumers' preferences for that good.
B)a change in the general income levels of the consumers who buy that good.
C)an increase or decrease in the population.
D)a change in the price of that good.
E)a change in the price of substitute goods.
Question
The table given below reports the quantity demanded of a good by individuals 1, 2, and 3 at different prices.Table 3.1
Every Friday night Elizabeth either goes bowling or goes to the movies. Because the price of bowling went up, Elizabeth now sees more movies. Elizabeth's behavior would be best described as a change in which determinant of demand?
A)Price of complementary goods
B)Expectations
C)Income
D)Number of buyers
E)Price of substitute goods
Question
The table given below reports the quantity demanded of a good by individuals 1, 2, and 3 at different prices.Table 3.1
Refer to Table 3.1. If Quantity Demanded 1, Quantity Demanded 2, and Quantity Demanded 3 are market demand schedules, then the change from Quantity Demanded 1 to Quantity Demanded 2 may have been due to:
A)an increase in price.
B)a decrease in the number of sellers.
C)an increase in the number of buyers.
D)a decrease in price.
E)an increase in the price of a complementary good.
Question
The table given below reports the quantity demanded of a good by individuals 1, 2, and 3 at different prices.Table 3.1
Which of the following is true of the law of supply?
A)The law of supply is the sole determinant of market prices.
B)The law of supply states that as the price of a good rises, the quantity supplied rises.
C)The law of supply holds good only in the long-run.
D)The law of supply is valid only in a market system of allocation.
E)The law of supply asserts that as the cost of producing a good rises, the quantity supplied rises.
Question
The table given below reports the quantity demanded of a good by individuals 1, 2, and 3 at different prices.Table 3.1
Margarine and butter can both be used as a spread on toast. This means that they are:
A)independent goods.
B)complementary goods.
C)substitute goods.
D)Giffen goods.
E)inferior goods.
Margarine and butter can both be used as a spread on toast. This means that they are:
A)independent goods.
B)complementary goods.
C)substitute goods.
D)Giffen goods.
E)inferior goods.
Question
The table given below reports the quantity demanded of a good by individuals 1, 2, and 3 at different prices.Table 3.1
Other things remaining unchanged, which of the following is most likely to cause an increase in the demand for personal computers?
A)A reduction in the price of personal computers
B)An increase in the supply of personal computers
C)An increase in the cost of computer printing ink
D)An increase in the number of computer manufacturers
E)A requirement by universities that all students buy personal computers
Question
The table given below reports the quantity demanded of a good by individuals 1, 2, and 3 at different prices.Table 3.1
Other things remaining the same, if a large part of the population decided against having soda for health reasons, there would be a(n):
A)increase in the quantity of soda supplied.
B)increase in the quantity supplied of complements like fries and burgers.
C)decrease in the price of soda.
D)rightward shift of the demand curve for soda.
E)decrease in the quantity demanded of substitutes like mineral water.
Question
The figure given below shows the demand and supply curves in the market for coffee. S1 and D1 are the original demand and supply curves.Figure 3.5
A market survey conducted by an electronics manufacturer reported a year on year growth in the sale of television sets, along with an increase in the selling price. Which of the following could be a likely cause for this situation?
A)A decrease in supply
B)An increase in demand
C)A decrease in demand
D)An exception to the law of demand
E)An increase in supply
Question
The table given below reports the quantity demanded and supplied of a commodity in a market at different price levels.Table 3.4
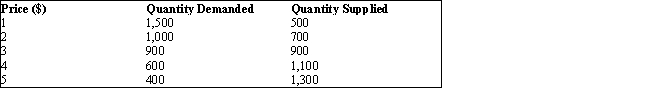
Refer to Table 3.4. In the market represented by this table, at equilibrium:
A)the market price is $5 per unit.
B)there is a surplus of 900 units.
C)there is a shortage of 900 units.
D)900 units are traded at a price of $3 per unit.
E)the market price is $1 per unit and the quantity traded is 500 units.
Question
The figure given below shows the demand and supply curves in the market for coffee. S1 and D1 are the original demand and supply curves.Figure 3.5
Assume that at the current market price of $4 per unit of a good, you are willing and able to buy 20 units. Last year at a price of $4 per unit, you would have purchased 30 units. What is most likely to have happened over the last year?
A)Demand has increased
B)Demand has decreased
C)Supply has increased
D)Supply has decreased
E)Quantity supplied has decreased
Question
The figure given below shows the demand and supply curves in the market for coffee. S1 and D1 are the original demand and supply curves.Figure 3.5
When will a shortage occur in a market?
A)When the actual price is lower than the equilibrium price
B)When quantity supplied is greater than the equilibrium quantity
C)When the quantity that consumers are willing and able to purchase decreases
D)When the quantity available at zero price is insufficient to meet demand
E)When a price floor is set in the market
Question
The table given below reports the quantity of bread loaves demanded and supplied at different per unit prices.Table 3.3
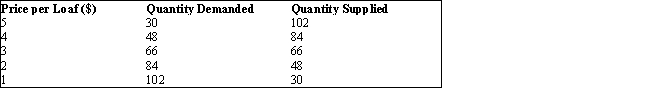
Refer to Table 3.3. Which of the following would occur in the market for bread if the market price exceeded the equilibrium price by $1?
A)The quantity of bread demanded in the market would increase.
B)The bread market would face a surplus of 36 loaves of bread.
C)The supply of bread in the market would increase.
D)The bread market would face a shortage of 72 loaves of bread.
E)The demand for bread in the market would decrease.
Question
The table given below reports the quantity demanded of a good by individuals 1, 2, and 3 at different prices.Table 3.1
A rightward shift of a market supply curve might be caused by:
A)the entry of new firms in the industry.
B)an increase in the wages of labor employed in the industry.
C)an increase in the price of the final product.
D)a decrease in the income of consumers.
E)an increase in the supply of a substitute good.
Question
The table given below reports the quantity demanded of a good by individuals 1, 2, and 3 at different prices.Table 3.1
The relationship between prices and the corresponding quantities supplied is shown in a:
A)supply schedule.
B)demand schedule.
C)price-earnings ratio.
D)production possibilities curve.
E)total output schedule.
The relationship between prices and the corresponding quantities supplied is shown in a:
A)supply schedule.
B)demand schedule.
C)price-earnings ratio.
D)production possibilities curve.
E)total output schedule.
Question
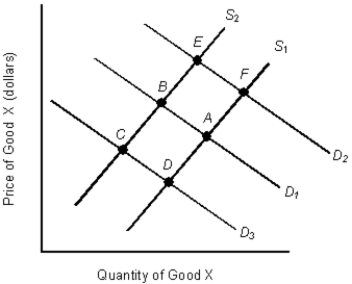
In the figure given below, D1 and S1 are the original demand and supply curves.Figure 3.1
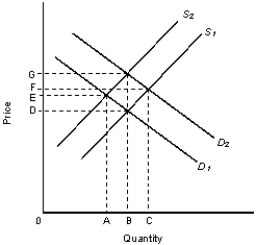
Refer to Figure 3.1. If demand shifts from D1 to D2 and supply shifts from S1 to S2:
A)equilibrium price will rise to F, but equilibrium quantity will remain at B.
B)equilibrium price will move to C and equilibrium quantity to G.
C)demand will decrease and supply will increase.
D)equilibrium price will rise to G, and equilibrium quantity will remain at B.
E)both equilibrium price and equilibrium quantity will decrease.
Question
In the figure given below, D1 and S1 are the initial demand and supply curves for a commodity in the market.Figure 3.3
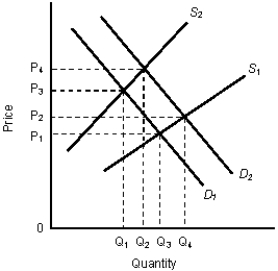
Refer to Figure 3.3. If the change in the demand in this market occurred before the change in supply, then starting from the initial equilibrium:
A)firms would experience a fall in profits and then a gradual increase in profits after the change in supply occurred.
B)there would be an immediate shortage, lasting until the price reaches P2.
C)price would change from P1 to P2 after the change in demand and would change again from P3 to P4 after the change in supply.
D)there would be a surplus until the price reaches P4.
E)there would be a surplus even after price reaches P4.
Question
In the figure given below, D1 and S1 are the original demand and supply curves.Figure 3.1
Refer to Figure 3.1. Given D1, if supply moves from S1 to S2 it implies:
A)quantity supplied has increased.
B)demand will decrease from B to A.
C)a surplus will exist equal to AB.
D)supply has decreased, and equilibrium price and equilibrium quantity will move to G and B respectively.
E)supply has decreased, and equilibrium price and equilibrium quantity will move to E and A respectively.
Question
The below figure shows the demand and supply of DVD rentals in a city. S1 and D1 are the
original supply and demand curves. The demand curve shifts from D1 to D2.Figure 3.4
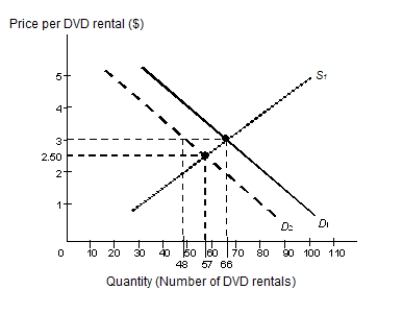
Refer to Figure 3.4 and identify the true statement.
A)The supply of DVD rentals has decreased.
B)The original equilibrium quantity was 57.
C)The new equilibrium price is $3.
D)The demand for DVD rentals has decreased.
E)The new equilibrium quantity is 48.
original supply and demand curves. The demand curve shifts from D1 to D2.Figure 3.4
Refer to Figure 3.4 and identify the true statement.
A)The supply of DVD rentals has decreased.
B)The original equilibrium quantity was 57.
C)The new equilibrium price is $3.
D)The demand for DVD rentals has decreased.
E)The new equilibrium quantity is 48.
Question
The table given below represents the supply schedules of the only three DVD producers in the market for DVDs.Table 3.2
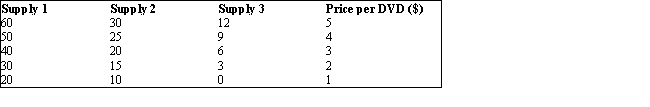
According to Table 3.2, if the supply schedules 1, 2, and 3 are the market supply schedules for DVDs in three different time periods, what could explain the change from the Supply 1 schedule to the Supply 2 schedule?
A)A decrease in the price of DVDs
B)A decrease in the cost of DVD players
C)A change in consumer preferences
D)A change in the average income of consumers
E)An increase in the cost of producing DVDs
Question
The table given below represents the supply schedules of the only three DVD producers in the market for DVDs.Table 3.2
The market supply curve for any product:
A)always depends on the market demand for that product.
B)depends on the general income level of the consumers in the market.
C)is a summation of individual firms' supply curves.
D)equals the total revenue generated through sale of the commodity.
E)is affected by the prices of related products.
Question
The table given below represents the supply schedules of the only three DVD producers in the market for DVDs.Table 3.2
Assume that Ford Motor Company engineers achieve a revolutionary technological breakthrough in the production process of automobiles. Which of the following is expected to take place?
A)A movement up along the existing supply curve for Ford automobiles
B)The supply of Ford automobiles will remain unchanged
C)An inward shift of the supply curve for Ford automobiles
D)A downward movement along an existing supply curve for Ford automobiles
E)An outward shift of the supply curve for Ford automobiles
Question
The figure given below represents the equilibrium in the market for bicycles under different demand and supply situations. The vertical axis in each panel shows the price of bikes.Figure 3.2
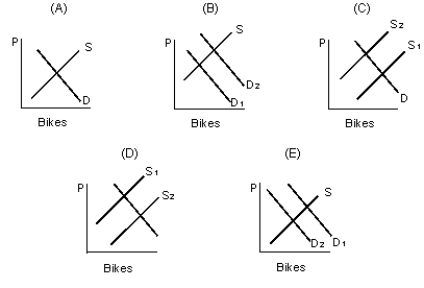
Refer to Figure 3.2. Which of the following panels represents the equilibrium situation in the bicycle market, if there were an increase in the price of metal used in the production of bicycles?
A)Panel A
B)Panel B
C)Panel C
D)Panel D
E)Panel E
Refer to Figure 3.2. Which of the following panels represents the equilibrium situation in the bicycle market, if there were an increase in the price of metal used in the production of bicycles?
A)Panel A
B)Panel B
C)Panel C
D)Panel D
E)Panel E
Question
The table given below reports the quantity demanded and supplied of a commodity in a market at different price levels.Table 3.4
The output level that occurs in any market that is in equilibrium:
A)is the quantity where the supply curve intersects the y-axis.
B)is the quantity where the demand curve intersects the x-axis.
C)is the quantity at an output level where buyers will pay more than suppliers require.
D)is an output level where buyers will not pay as much as suppliers require.
E)is the quantity where the demand and supply curves intersect each other.
Question
The table given below reports the quantity of bread loaves demanded and supplied at different per unit prices.Table 3.3
According to Table 3.3, equilibrium in the market for bread occurs at the price of:
A)$2 per unit
B)$3 per unit
C)$4 per unit
D)$4.5 per unit
E)$1.5 per unit
According to Table 3.3, equilibrium in the market for bread occurs at the price of:
A)$2 per unit
B)$3 per unit
C)$4 per unit
D)$4.5 per unit
E)$1.5 per unit
Question
In the figure given below, D1 and S1 are the initial demand and supply curves for a commodity in the market.Figure 3.3
If both supply and demand for a good increase, which of the following will definitely happen?
A)Equilibrium price will remain the same
B)Equilibrium price will increase
C)Equilibrium price will decrease
D)Equilibrium quantity will increase
E)Equilibrium quantity will decrease
If both supply and demand for a good increase, which of the following will definitely happen?
A)Equilibrium price will remain the same
B)Equilibrium price will increase
C)Equilibrium price will decrease
D)Equilibrium quantity will increase
E)Equilibrium quantity will decrease
Question
The figure given below shows the demand and supply curves in the market for coffee. S1 and D1 are the original demand and supply curves.Figure 3.5
Based on Figure 3.5, which of the following conditions would most likely move the point of equilibrium from A to B?
A)An increase in the income of a coffee buyer.
B)A decrease in the price of coffee.
C)A drought in Colombia, a major coffee producer, that affects the coffee harvest.
D)A decrease in the price of non-dairy creamers that are consumed along with coffee.
E)An increase in the price of tea, assumed to be a substitute for coffee.
Question
The table given below reports the quantity demanded and supplied of a commodity in a market at different price levels.Table 3.4
Consider the market described by Table 3.4. Identify the correct statement.
A)The law of demand is violated
B)The law of supply is violated
C)There is no equilibrium
D)At $5 per unit, people will purchase 400 units
E)At $2 per unit, people will purchase 900 units
Consider the market described by Table 3.4. Identify the correct statement.
A)The law of demand is violated
B)The law of supply is violated
C)There is no equilibrium
D)At $5 per unit, people will purchase 400 units
E)At $2 per unit, people will purchase 900 units
Question
The below figure shows the demand and supply curves in the market for gasoline. The price and quantity at the point of intersection of the demand and supply curves is $30 and 300 gallons respectively.Figure 3.6
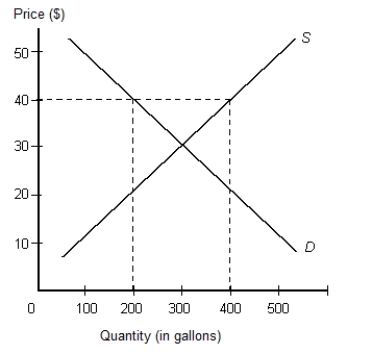
The removal of a price ceiling in a market results in:
A)an increase in the market price.
B)a shortage in the market.
C)over-production of the commodity and a surplus.
D)a fall in the market price.
E)abnormal profits for producers.
The removal of a price ceiling in a market results in:
A)an increase in the market price.
B)a shortage in the market.
C)over-production of the commodity and a surplus.
D)a fall in the market price.
E)abnormal profits for producers.
Question
The table given below reports the quantity demanded and supplied of a commodity at different prices in a market.Table 3.5

In a market where the price is restricted by price floors or price ceilings,
A)all sellers will be able to sell everything they produce.
B)surpluses and shortages will exist.
C)all buyers will get what they want.
D)disequilibrium will automatically correct itself.
E)surpluses and shortages will put pressure on the price to move to its equilibrium.
Question
The table given below reports the quantity demanded and supplied of a commodity at different prices in a market.Table 3.5
Refer to Table 3.5. If government imposes a price floor of $2:
A)the price floor will not have an effect.
B)the price will fall to $1 because producers will be forced to incur losses.
C)demand will increase.
D)a surplus will result equal to 20 units.
E)a shortage will result equal to 20 units.
Refer to Table 3.5. If government imposes a price floor of $2:
A)the price floor will not have an effect.
B)the price will fall to $1 because producers will be forced to incur losses.
C)demand will increase.
D)a surplus will result equal to 20 units.
E)a shortage will result equal to 20 units.
Question
Question
The below figure shows the demand and supply curves in the market for gasoline. The price and quantity at the point of intersection of the demand and supply curves is $30 and 300 gallons respectively.Figure 3.6
In the market for eggs, a removal of the price ceiling on eggs results in:
A)an increase in the demand for eggs.
B)farmers supplying more eggs to the market.
C)consumers demanding a larger quantity of eggs.
D)farmers supplying less eggs to the market.
E)consumers demanding a smaller quantity of eggs.
Question
Question
The table given below reports the quantity demanded and supplied of a commodity at different prices in a market.Table 3.5
Which of the following is true of a price floor?
A)A price floor allows supply and demand to function effectively.
B)A price floor is set such that the price is not allowed to increase above a certain level.
C)A price floor is beneficial to buyers in a market.
D)A price floor usually creates a shortage of a good in a market.
E)A price floor is set such that the price is not allowed to decrease below a certain level.
Question
The table given below reports the quantity demanded and supplied of a commodity at different prices in a market.Table 3.5
Refer to Table 3.5. If government imposes a price ceiling of $2:
A)the price will be above equilibrium.
B)the price will fall to $1 because producers will be forced to incur losses.
C)demand will increase.
D)a surplus will result equal to 20 units.
E)a shortage will result equal to 20 units.
Refer to Table 3.5. If government imposes a price ceiling of $2:
A)the price will be above equilibrium.
B)the price will fall to $1 because producers will be forced to incur losses.
C)demand will increase.
D)a surplus will result equal to 20 units.
E)a shortage will result equal to 20 units.
Question
The below figure shows the demand and supply curves in the market for gasoline. The price and quantity at the point of intersection of the demand and supply curves is $30 and 300 gallons respectively.Figure 3.6
Assume that the market for gasoline in Figure 3.6 is in equilibrium. What is the most likely consequence of a government-imposed price ceiling at $10 per unit?
A)The profit made by gasoline producers will increase.
B)The demand for gasoline will decrease.
C)The quantity of gasoline supplied to the market will decrease.
D)There will be a surplus of gasoline in the market.
E)The demand curve for gasoline will shift to the right.
Question
Question
The figure given below shows the demand and supply curves in the market for coffee. S1 and D1 are the original demand and supply curves.Figure 3.5
When a freely functioning market is in disequilibrium:
A)the government must set a price ceiling.
B)the government must set a price floor.
C)the price and quantities demanded and/or supplied change until equilibrium is established.
D)it will continue to remain in disequilibrium.
E)it will reach equilibrium at a very high/low price.
Question
The below figure shows the demand and supply curves in the market for gasoline. The price and quantity at the point of intersection of the demand and supply curves is $30 and 300 gallons respectively.Figure 3.6
In general, the purpose of markets is to facilitate the exchange of goods and services between buyers and sellers.
In general, the purpose of markets is to facilitate the exchange of goods and services between buyers and sellers.
Question
Question
The below figure shows the demand and supply curves in the market for gasoline. The price and quantity at the point of intersection of the demand and supply curves is $30 and 300 gallons respectively.Figure 3.6
Without money, no transaction can occur.
Without money, no transaction can occur.
Question
The table given below reports the quantity demanded and supplied of a commodity at different prices in a market.Table 3.5
Refer to Table 3.5. If government imposes a price ceiling of $4:
A)the price ceiling will not have an effect.
B)the price will fall to $1 because producers will be forced to incur losses.
C)demand will increase.
D)a surplus will result equal to 20 units.
E)a shortage will result equal to 20 units.
Refer to Table 3.5. If government imposes a price ceiling of $4:
A)the price ceiling will not have an effect.
B)the price will fall to $1 because producers will be forced to incur losses.
C)demand will increase.
D)a surplus will result equal to 20 units.
E)a shortage will result equal to 20 units.
Question
Question
Question
The table given below reports the quantity demanded and supplied of a commodity at different prices in a market.Table 3.5
Which of the following is not an example of a price ceiling?
A)The Chinese government sets the price of housing in China below equilibrium.
B)The government of the former Soviet Union sets the price on food below those prevailing in the free market.
C)In the 1970s, the Nixon administration imposed wage and price controls, thereby keeping wages and prices from rising.
D)In the late 1970s, the U.S. government required gasoline to be sold at a price per gallon that was below what would have prevailed in a free market.
E)The U.S. government requires that sugar be sold at a price that exceeds the world price of sugar.
Question
Question

Unlock Deck
Sign up to unlock the cards in this deck!
Unlock Deck
Unlock Deck
1/96
Play
Full screen (f)
Deck 3: Markets and the Price System
1
The figure given below represents the PPC in two nations - Germany and Korea, producing only two goods, cars and food.Figure 2.4
Consider a demand curve for peaches. Which of the following movements will be observed if the price of peaches decline at a point in time?
A)The demand curve will rotate inward at the given price level.
B)The will be a movement up along the demand curve.
C)The demand curve will rotate outward at the given price level.
D)There will be a downward movement along the demand curve.
E)The demand curve will become steeper.
There will be a downward movement along the demand curve.
2
The figure given below represents the PPC in two nations - Germany and Korea, producing only two goods, cars and food.Figure 2.4
The term barter refers to exchanges made:
A)only with the use of money.
B)without the use of money.
C)outside the U.S. economy.
D)only in underdeveloped countries.
E)within countries in a monetary union.
The term barter refers to exchanges made:
A)only with the use of money.
B)without the use of money.
C)outside the U.S. economy.
D)only in underdeveloped countries.
E)within countries in a monetary union.
without the use of money.
3
The figure given below represents the PPC in two nations - Germany and Korea, producing only two goods, cars and food.Figure 2.4
The downward slope of the demand curve is attributed to:
A)the inverse relationship between price and quantity demanded.
B)the direct relationship between income and quantity demanded.
C)the direct relationship between price and quantity demanded.
D)the inverse relationship between income and quantity demanded.
E)the direct relationship between consumer preferences and quantity demanded.
the inverse relationship between price and quantity demanded.
4
The figure given below represents the PPC in two nations - Germany and Korea, producing only two goods, cars and food.Figure 2.4
The exchange of goods and services directly without money is called:
A)creative destruction.
B)barter.
C)arbitration.
D)currency trade.
E)illegal trade.
The exchange of goods and services directly without money is called:
A)creative destruction.
B)barter.
C)arbitration.
D)currency trade.
E)illegal trade.
Unlock Deck
Unlock for access to all 96 flashcards in this deck.
Unlock Deck
k this deck
5
The figure given below represents the PPC in two nations - Germany and Korea, producing only two goods, cars and food.Figure 2.4
_______ ensure that resources are allocated to where they are most highly valued.
A)Communist governments
B)Consumers
C)Suppliers
D)Non-governmental organizations
E)Markets
_______ ensure that resources are allocated to where they are most highly valued.
A)Communist governments
B)Consumers
C)Suppliers
D)Non-governmental organizations
E)Markets
Unlock Deck
Unlock for access to all 96 flashcards in this deck.
Unlock Deck
k this deck
6
The figure given below represents the PPC in two nations - Germany and Korea, producing only two goods, cars and food.Figure 2.4
Which of the following statements is not true about a market system?
A)The market system provides an incentive to consumers to acquire purchasing ability.
B)The market system magnifies the problem of scarcity of goods and services.
C)The market system provides an incentive for allocating resources.
D)The market system provides an incentive to improve the quality of goods produced.
E)The market system provides everything everyone wants to consume.
Unlock Deck
Unlock for access to all 96 flashcards in this deck.
Unlock Deck
k this deck
7
The figure given below represents the PPC in two nations - Germany and Korea, producing only two goods, cars and food.Figure 2.4
Which of the following statements correctly defines the law of demand?
A)The lower the price of a commodity, the lower the quantity demanded of that commodity.
B)As the price of a commodity increases, the quantity demanded of that commodity also increases.
C)The lower the price of a commodity, the greater the quantity demanded of that commodity.
D)The lower the price of a commodity, the greater the quantity supplied of that commodity.
E)The quantity demanded of a particular good decreases with an increase in the price of a substitute good.
Unlock Deck
Unlock for access to all 96 flashcards in this deck.
Unlock Deck
k this deck
8
The figure given below represents the PPC in two nations - Germany and Korea, producing only two goods, cars and food.Figure 2.4
The market demand curve is derived by:
A)studying an individual's demand for a product over a year.
B)comparing the monthly consumption of a group of people.
C)surveying a set of consumers and ascertaining their preferences.
D)adding up the quantities that consumers in a market are willing and able to purchase at each price.
E)calculating the average price a random sample of consumers are willing to pay for a product.
Unlock Deck
Unlock for access to all 96 flashcards in this deck.
Unlock Deck
k this deck
9
The figure given below represents the PPC in two nations - Germany and Korea, producing only two goods, cars and food.Figure 2.4
Money exchanges are more efficient than barter because:
A)money exchanges do not require a double coincidence of wants.
B)the government guarantees the value of money.
C)money usually has an intrinsic value.
D)money is backed by a physical commodity.
E)opportunity costs are higher with barter trades.
Unlock Deck
Unlock for access to all 96 flashcards in this deck.
Unlock Deck
k this deck
10
The figure given below represents the PPC in two nations - Germany and Korea, producing only two goods, cars and food.Figure 2.4
The demand curve of a commodity slopes downward because of:
A)the insatiable nature of human wants.
B)the presence of double coincidence of wants.
C)the law of demand.
D)the scarcity of goods and services in an economy.
E)the law of diminishing marginal utility.
The demand curve of a commodity slopes downward because of:
A)the insatiable nature of human wants.
B)the presence of double coincidence of wants.
C)the law of demand.
D)the scarcity of goods and services in an economy.
E)the law of diminishing marginal utility.
Unlock Deck
Unlock for access to all 96 flashcards in this deck.
Unlock Deck
k this deck
11
The figure given below represents the PPC in two nations - Germany and Korea, producing only two goods, cars and food.Figure 2.4
Barter can best be defined as:
A)the direct exchange of one good for money.
B)the direct exchange of money for a good.
C)the direct exchange of goods and services without the use of money.
D)the direct exchange of labor services for wages.
E)the payment of interest on a savings account.
Barter can best be defined as:
A)the direct exchange of one good for money.
B)the direct exchange of money for a good.
C)the direct exchange of goods and services without the use of money.
D)the direct exchange of labor services for wages.
E)the payment of interest on a savings account.
Unlock Deck
Unlock for access to all 96 flashcards in this deck.
Unlock Deck
k this deck
12
The figure given below represents the PPC in two nations - Germany and Korea, producing only two goods, cars and food.Figure 2.4
According to the law of demand, if the price of movie rentals decreases, ceteris paribus,:
A)the demand for movie rentals would increase.
B)the quantity demanded of movie rentals would decrease.
C)the quantity demanded of movie rentals would increase.
D)the demand for movie rentals would decrease.
E)the quantity demanded of movie rentals would not change.
Unlock Deck
Unlock for access to all 96 flashcards in this deck.
Unlock Deck
k this deck
13
The figure given below represents the PPC in two nations - Germany and Korea, producing only two goods, cars and food.Figure 2.4
Which of the following determines the quantity demanded of a commodity?
A)The income levels of consumers
B)The price of the commodity
C)The prices of related commodities
D)The number of buyers
E)Consumers' expectations
Which of the following determines the quantity demanded of a commodity?
A)The income levels of consumers
B)The price of the commodity
C)The prices of related commodities
D)The number of buyers
E)Consumers' expectations
Unlock Deck
Unlock for access to all 96 flashcards in this deck.
Unlock Deck
k this deck
14
The figure given below represents the PPC in two nations - Germany and Korea, producing only two goods, cars and food.Figure 2.4
Other things remaining the same, an individual demand schedule shows the various quantities of a good:
A)that a person wants and is able to purchase at alternative prices.
B)that are demanded with a change in the quantity demanded of a substitute good.
C)that a person is able to purchase at alternative income levels.
D)that are demanded at various levels of utility.
E)that are demanded by the market at various prices.
Unlock Deck
Unlock for access to all 96 flashcards in this deck.
Unlock Deck
k this deck
15
The figure given below represents the PPC in two nations - Germany and Korea, producing only two goods, cars and food.Figure 2.4
Margaret can use her quarterly savings to buy a teakwood study table for her room or spend it on a small Christmas party with her family. The _____ cost of her enjoyment at the Christmas party would then equal the forgone utility of the study table.
A)transaction
B)exchange
C)opportunity
D)direct
E)sunk
Unlock Deck
Unlock for access to all 96 flashcards in this deck.
Unlock Deck
k this deck
16
The figure given below represents the PPC in two nations - Germany and Korea, producing only two goods, cars and food.Figure 2.4
Most markets involve the use of money for transactions because:
A)goods and services can be exchanged more easily with money than without it.
B)goods and services cannot be exchanged without money.
C)using money requires a double coincidence of wants.
D)the transaction costs of using money are very high.
E)the value of money remains same across countries over time.
Unlock Deck
Unlock for access to all 96 flashcards in this deck.
Unlock Deck
k this deck
17
The figure given below represents the PPC in two nations - Germany and Korea, producing only two goods, cars and food.Figure 2.4
Identify the correct statement.
A)Demand is the total quantity of a product that people are willing, even if unable, to purchase at a given price.
B)Demand for a product is the same as the quantity demanded of a product.
C)Demand represents the different quantities of a good or service that provides consumers the same amount of utility.
D)Demand is the quantity of a product that people are willing and able to purchase at different prices.
E)Demand is the quantity of a product that producers are willing to produce at a particular price.
Unlock Deck
Unlock for access to all 96 flashcards in this deck.
Unlock Deck
k this deck
18
The figure given below represents the PPC in two nations - Germany and Korea, producing only two goods, cars and food.Figure 2.4
The amount of a product that people are willing and able to purchase at a specific price is referred to as the:
A)demand.
B)quantity demanded.
C)law of demand.
D)consumption function.
E)purchasing power.
The amount of a product that people are willing and able to purchase at a specific price is referred to as the:
A)demand.
B)quantity demanded.
C)law of demand.
D)consumption function.
E)purchasing power.
Unlock Deck
Unlock for access to all 96 flashcards in this deck.
Unlock Deck
k this deck
19
The figure given below represents the PPC in two nations - Germany and Korea, producing only two goods, cars and food.Figure 2.4
Given that resources can be allocated by the government, the market, a random process, or on a first-come first-serve basis, which of the following statements is true?
A)The market system is not entirely fair but it creates incentives to increase supplies and improve standards of living.
B)The random process of allocation allows individuals to acquire purchasing power and enhances the value of the resources that they own.
C)Since the government system does not distinguish between those who have income and those that do not, government allocation of resources is the most efficient.
D)There will be no shortages under the first-come first-serve basis of allocation.
E)A random process of allocation is fair in the sense that everyone gains and there are no losers.
Unlock Deck
Unlock for access to all 96 flashcards in this deck.
Unlock Deck
k this deck
20
The figure given below represents the PPC in two nations - Germany and Korea, producing only two goods, cars and food.Figure 2.4
Barter requires a double coincidence of wants. This means that:
A)at least two traders must demand a commodity.
B)any two traders involved in a transaction must have money.
C)each trader must demand at least two commodities.
D)either of the two traders involved in a transaction must have money.
E)when two traders are involved in a transaction each trader must want what the other has to offer.
Unlock Deck
Unlock for access to all 96 flashcards in this deck.
Unlock Deck
k this deck
21
The table given below reports the quantity demanded of a good by individuals 1, 2, and 3 at different prices.Table 3.1
Ceteris paribus, a change in the quantity supplied along the supply curve of Braun coffee makers is:
A)directly related to the price of a Morphy Richards coffee maker.
B)directly related to the price of milk and cream.
C)directly related to the prices of inputs used in the production of Braun coffee makers.
D)directly related to changes in the technology used in producing coffee makers.
E)directly related to the price of a Braun coffee maker.
Unlock Deck
Unlock for access to all 96 flashcards in this deck.
Unlock Deck
k this deck
22
The table given below reports the quantity demanded of a good by individuals 1, 2, and 3 at different prices.Table 3.1
Refer to Table 3.1. If Quantity Demanded 1, Quantity Demanded 2, and Quantity Demanded 3 are market demand schedules, then the change from Quantity Demanded 1 to Quantity Demanded 3 may have been due to:
A)an increase in price.
B)an increase in the number of sellers.
C)a decrease in price.
D)a decrease in the number of buyers.
E)an increase in the price of a substitute good.
Unlock Deck
Unlock for access to all 96 flashcards in this deck.
Unlock Deck
k this deck
23
The table given below reports the quantity demanded of a good by individuals 1, 2, and 3 at different prices.Table 3.1
Which of the following will have no impact on the demand for ice cream in the short run?
A)A change in population size
B)A change in the price of ice cream
C)A change in seasons
D)A change in consumer preferences
E)A change in consumer incomes
Which of the following will have no impact on the demand for ice cream in the short run?
A)A change in population size
B)A change in the price of ice cream
C)A change in seasons
D)A change in consumer preferences
E)A change in consumer incomes
Unlock Deck
Unlock for access to all 96 flashcards in this deck.
Unlock Deck
k this deck
24
The table given below reports the quantity demanded of a good by individuals 1, 2, and 3 at different prices.Table 3.1
Other things remaining unchanged, which of the following is a determinant of the quantity supplied of a good?
A)The cost of inputs used in production
B)The price of the product
C)The income levels of consumers
D)The price expectations of producers
E)The preferences of consumers
Other things remaining unchanged, which of the following is a determinant of the quantity supplied of a good?
A)The cost of inputs used in production
B)The price of the product
C)The income levels of consumers
D)The price expectations of producers
E)The preferences of consumers
Unlock Deck
Unlock for access to all 96 flashcards in this deck.
Unlock Deck
k this deck
25
The table given below reports the quantity demanded of a good by individuals 1, 2, and 3 at different prices.Table 3.1
If the price of hot dogs were to decrease, which of the following changes would we expect to occur in the hot dog bun market?
A)The equilibrium price of hot dog buns would decrease and the quantity of hot dog buns sold would increase.
B)The equilibrium price of hot dog buns would increase and the quantity of hot dog buns sold would decrease.
C)The equilibrium price of hot dog buns would increase and the quantity of hot dog buns sold would increase.
D)The equilibrium price of hot dog buns would decrease and the quantity of hot dog buns sold would decrease.
E)The equilibrium price of hot dog buns would stay the same and the quantity of hot dog buns sold would increase.
Unlock Deck
Unlock for access to all 96 flashcards in this deck.
Unlock Deck
k this deck
26
The table given below reports the quantity demanded of a good by individuals 1, 2, and 3 at different prices.Table 3.1
Refer to Table 3.1. Calculate the market demand at prices $5, $4, $3, $2, and $1 respectively.
A)Market demand is 30, 40, 50, 60, and 70
B)Market demand is 30, 60, 90, 120, and 150
C)Market demand is 30, 50, 70, 90, and 1,100
D)Market demand is 10, 30, 40, 50, and 70
E)Market demand is 10, 20, 30, 40, and 50
Unlock Deck
Unlock for access to all 96 flashcards in this deck.
Unlock Deck
k this deck
27
The table given below reports the quantity demanded of a good by individuals 1, 2, and 3 at different prices.Table 3.1
Which of the following will cause an inward shift in the demand for steaks at a restaurant?
A)A report by the American Medical Association states that the consumption of steak reduces the risk of cardiovascular disease
B)A 50 percent reduction in the price of steaks
C)A double-digit increase in the price of chicken
D)A recession leading to a significant fall in the income levels of consumers
E)The expectation that the price of steaks will double within two months
Unlock Deck
Unlock for access to all 96 flashcards in this deck.
Unlock Deck
k this deck
28
The table given below reports the quantity demanded of a good by individuals 1, 2, and 3 at different prices.Table 3.1
Last year a firm made 1,000 units of its product available at a price of $5 per unit. This year the firm will still make 1,000 units available, but only if the price is $7 per unit. What is most likely to have happened?
A)Supply has increased
B)Supply has decreased
C)Demand has decreased
D)Quantity demanded has increased
E)Quantity supplied has increased
Unlock Deck
Unlock for access to all 96 flashcards in this deck.
Unlock Deck
k this deck
29
The table given below reports the quantity demanded of a good by individuals 1, 2, and 3 at different prices.Table 3.1
Which of the following will cause an increase in the quantity demanded of ice cream at an ice cream store?
A)The onset of summer brings about an increase in the temperature.
B)The price of frozen yogurt that is sold at the store is reduced by 5 percent.
C)A new ice cream flavor is introduced at the store.
D)The store introduces a limited period offer of 20 percent off on the price of ice cream.
E)The income of the store's consumers increases.
Unlock Deck
Unlock for access to all 96 flashcards in this deck.
Unlock Deck
k this deck
30
The table given below reports the quantity demanded of a good by individuals 1, 2, and 3 at different prices.Table 3.1
Other things remaining the same, when a fall in the price of one good is followed by an increase in the demand for another good, both goods are said to be:
A)inferior goods.
B)substitute goods.
C)Giffen goods.
D)public goods.
E)complementary goods.
Other things remaining the same, when a fall in the price of one good is followed by an increase in the demand for another good, both goods are said to be:
A)inferior goods.
B)substitute goods.
C)Giffen goods.
D)public goods.
E)complementary goods.
Unlock Deck
Unlock for access to all 96 flashcards in this deck.
Unlock Deck
k this deck
31
The table given below reports the quantity demanded of a good by individuals 1, 2, and 3 at different prices.Table 3.1
Assume that a hurricane in Brazil destroys half of the coffee crop. Considering that Brazil is a major coffee producing country, consumers expect the price of coffee to increase in the near future. How does this reflect on the demand for coffee?
A)There is a movement upward along the demand curve for coffee.
B)The demand curve for coffee shifts inward.
C)The demand curve for coffee shifts outward.
D)There is a movement downward along the demand curve for coffee.
E)The demand for coffee declines.
Unlock Deck
Unlock for access to all 96 flashcards in this deck.
Unlock Deck
k this deck
32
The table given below reports the quantity demanded of a good by individuals 1, 2, and 3 at different prices.Table 3.1
Which of the following would lead to a rightward shift in the demand curve for golf balls?
A)An increase in the price of golf clubs
B)A decrease in the popularity of golf
C)An increase in the number of golfers
D)A decrease in the price of golf balls
E)An increase in the golf club membership fee
Which of the following would lead to a rightward shift in the demand curve for golf balls?
A)An increase in the price of golf clubs
B)A decrease in the popularity of golf
C)An increase in the number of golfers
D)A decrease in the price of golf balls
E)An increase in the golf club membership fee
Unlock Deck
Unlock for access to all 96 flashcards in this deck.
Unlock Deck
k this deck
33
The table given below reports the quantity demanded of a good by individuals 1, 2, and 3 at different prices.Table 3.1
If an increase in the price of good X causes the demand curve for product Y to shift to the right, then X and Y are most likely to be which of the following?
A)Shoes and laces
B)Tennis balls and tennis rackets
C)Turkey and chicken
D)Knives and forks
E)DVD players and DVDs
If an increase in the price of good X causes the demand curve for product Y to shift to the right, then X and Y are most likely to be which of the following?
A)Shoes and laces
B)Tennis balls and tennis rackets
C)Turkey and chicken
D)Knives and forks
E)DVD players and DVDs
Unlock Deck
Unlock for access to all 96 flashcards in this deck.
Unlock Deck
k this deck
34
The table given below reports the quantity demanded of a good by individuals 1, 2, and 3 at different prices.Table 3.1
The change in the quantity demanded of any good is always caused by:
A)a change in consumers' preferences for that good.
B)a change in the general income levels of the consumers who buy that good.
C)an increase or decrease in the population.
D)a change in the price of that good.
E)a change in the price of substitute goods.
Unlock Deck
Unlock for access to all 96 flashcards in this deck.
Unlock Deck
k this deck
35
The table given below reports the quantity demanded of a good by individuals 1, 2, and 3 at different prices.Table 3.1
Every Friday night Elizabeth either goes bowling or goes to the movies. Because the price of bowling went up, Elizabeth now sees more movies. Elizabeth's behavior would be best described as a change in which determinant of demand?
A)Price of complementary goods
B)Expectations
C)Income
D)Number of buyers
E)Price of substitute goods
Unlock Deck
Unlock for access to all 96 flashcards in this deck.
Unlock Deck
k this deck
36
The table given below reports the quantity demanded of a good by individuals 1, 2, and 3 at different prices.Table 3.1
Refer to Table 3.1. If Quantity Demanded 1, Quantity Demanded 2, and Quantity Demanded 3 are market demand schedules, then the change from Quantity Demanded 1 to Quantity Demanded 2 may have been due to:
A)an increase in price.
B)a decrease in the number of sellers.
C)an increase in the number of buyers.
D)a decrease in price.
E)an increase in the price of a complementary good.
Unlock Deck
Unlock for access to all 96 flashcards in this deck.
Unlock Deck
k this deck
37
The table given below reports the quantity demanded of a good by individuals 1, 2, and 3 at different prices.Table 3.1
Which of the following is true of the law of supply?
A)The law of supply is the sole determinant of market prices.
B)The law of supply states that as the price of a good rises, the quantity supplied rises.
C)The law of supply holds good only in the long-run.
D)The law of supply is valid only in a market system of allocation.
E)The law of supply asserts that as the cost of producing a good rises, the quantity supplied rises.
Unlock Deck
Unlock for access to all 96 flashcards in this deck.
Unlock Deck
k this deck
38
The table given below reports the quantity demanded of a good by individuals 1, 2, and 3 at different prices.Table 3.1
Margarine and butter can both be used as a spread on toast. This means that they are:
A)independent goods.
B)complementary goods.
C)substitute goods.
D)Giffen goods.
E)inferior goods.
Margarine and butter can both be used as a spread on toast. This means that they are:
A)independent goods.
B)complementary goods.
C)substitute goods.
D)Giffen goods.
E)inferior goods.
Unlock Deck
Unlock for access to all 96 flashcards in this deck.
Unlock Deck
k this deck
39
The table given below reports the quantity demanded of a good by individuals 1, 2, and 3 at different prices.Table 3.1
Other things remaining unchanged, which of the following is most likely to cause an increase in the demand for personal computers?
A)A reduction in the price of personal computers
B)An increase in the supply of personal computers
C)An increase in the cost of computer printing ink
D)An increase in the number of computer manufacturers
E)A requirement by universities that all students buy personal computers
Unlock Deck
Unlock for access to all 96 flashcards in this deck.
Unlock Deck
k this deck
40
The table given below reports the quantity demanded of a good by individuals 1, 2, and 3 at different prices.Table 3.1
Other things remaining the same, if a large part of the population decided against having soda for health reasons, there would be a(n):
A)increase in the quantity of soda supplied.
B)increase in the quantity supplied of complements like fries and burgers.
C)decrease in the price of soda.
D)rightward shift of the demand curve for soda.
E)decrease in the quantity demanded of substitutes like mineral water.
Unlock Deck
Unlock for access to all 96 flashcards in this deck.
Unlock Deck
k this deck
41
The figure given below shows the demand and supply curves in the market for coffee. S1 and D1 are the original demand and supply curves.Figure 3.5
A market survey conducted by an electronics manufacturer reported a year on year growth in the sale of television sets, along with an increase in the selling price. Which of the following could be a likely cause for this situation?
A)A decrease in supply
B)An increase in demand
C)A decrease in demand
D)An exception to the law of demand
E)An increase in supply
Unlock Deck
Unlock for access to all 96 flashcards in this deck.
Unlock Deck
k this deck
42
The table given below reports the quantity demanded and supplied of a commodity in a market at different price levels.Table 3.4
Refer to Table 3.4. In the market represented by this table, at equilibrium:
A)the market price is $5 per unit.
B)there is a surplus of 900 units.
C)there is a shortage of 900 units.
D)900 units are traded at a price of $3 per unit.
E)the market price is $1 per unit and the quantity traded is 500 units.
Unlock Deck
Unlock for access to all 96 flashcards in this deck.
Unlock Deck
k this deck
43
The figure given below shows the demand and supply curves in the market for coffee. S1 and D1 are the original demand and supply curves.Figure 3.5
Assume that at the current market price of $4 per unit of a good, you are willing and able to buy 20 units. Last year at a price of $4 per unit, you would have purchased 30 units. What is most likely to have happened over the last year?
A)Demand has increased
B)Demand has decreased
C)Supply has increased
D)Supply has decreased
E)Quantity supplied has decreased
Unlock Deck
Unlock for access to all 96 flashcards in this deck.
Unlock Deck
k this deck
44
The figure given below shows the demand and supply curves in the market for coffee. S1 and D1 are the original demand and supply curves.Figure 3.5
When will a shortage occur in a market?
A)When the actual price is lower than the equilibrium price
B)When quantity supplied is greater than the equilibrium quantity
C)When the quantity that consumers are willing and able to purchase decreases
D)When the quantity available at zero price is insufficient to meet demand
E)When a price floor is set in the market
Unlock Deck
Unlock for access to all 96 flashcards in this deck.
Unlock Deck
k this deck
45
The table given below reports the quantity of bread loaves demanded and supplied at different per unit prices.Table 3.3
Refer to Table 3.3. Which of the following would occur in the market for bread if the market price exceeded the equilibrium price by $1?
A)The quantity of bread demanded in the market would increase.
B)The bread market would face a surplus of 36 loaves of bread.
C)The supply of bread in the market would increase.
D)The bread market would face a shortage of 72 loaves of bread.
E)The demand for bread in the market would decrease.
Unlock Deck
Unlock for access to all 96 flashcards in this deck.
Unlock Deck
k this deck
46
The table given below reports the quantity demanded of a good by individuals 1, 2, and 3 at different prices.Table 3.1
A rightward shift of a market supply curve might be caused by:
A)the entry of new firms in the industry.
B)an increase in the wages of labor employed in the industry.
C)an increase in the price of the final product.
D)a decrease in the income of consumers.
E)an increase in the supply of a substitute good.
Unlock Deck
Unlock for access to all 96 flashcards in this deck.
Unlock Deck
k this deck
47
The table given below reports the quantity demanded of a good by individuals 1, 2, and 3 at different prices.Table 3.1
The relationship between prices and the corresponding quantities supplied is shown in a:
A)supply schedule.
B)demand schedule.
C)price-earnings ratio.
D)production possibilities curve.
E)total output schedule.
The relationship between prices and the corresponding quantities supplied is shown in a:
A)supply schedule.
B)demand schedule.
C)price-earnings ratio.
D)production possibilities curve.
E)total output schedule.
Unlock Deck
Unlock for access to all 96 flashcards in this deck.
Unlock Deck
k this deck
48
In the figure given below, D1 and S1 are the original demand and supply curves.Figure 3.1
Refer to Figure 3.1. If demand shifts from D1 to D2 and supply shifts from S1 to S2:
A)equilibrium price will rise to F, but equilibrium quantity will remain at B.
B)equilibrium price will move to C and equilibrium quantity to G.
C)demand will decrease and supply will increase.
D)equilibrium price will rise to G, and equilibrium quantity will remain at B.
E)both equilibrium price and equilibrium quantity will decrease.
Unlock Deck
Unlock for access to all 96 flashcards in this deck.
Unlock Deck
k this deck
49
In the figure given below, D1 and S1 are the initial demand and supply curves for a commodity in the market.Figure 3.3
Refer to Figure 3.3. If the change in the demand in this market occurred before the change in supply, then starting from the initial equilibrium:
A)firms would experience a fall in profits and then a gradual increase in profits after the change in supply occurred.
B)there would be an immediate shortage, lasting until the price reaches P2.
C)price would change from P1 to P2 after the change in demand and would change again from P3 to P4 after the change in supply.
D)there would be a surplus until the price reaches P4.
E)there would be a surplus even after price reaches P4.
Unlock Deck
Unlock for access to all 96 flashcards in this deck.
Unlock Deck
k this deck
50
In the figure given below, D1 and S1 are the original demand and supply curves.Figure 3.1
Refer to Figure 3.1. Given D1, if supply moves from S1 to S2 it implies:
A)quantity supplied has increased.
B)demand will decrease from B to A.
C)a surplus will exist equal to AB.
D)supply has decreased, and equilibrium price and equilibrium quantity will move to G and B respectively.
E)supply has decreased, and equilibrium price and equilibrium quantity will move to E and A respectively.
Unlock Deck
Unlock for access to all 96 flashcards in this deck.
Unlock Deck
k this deck
51
The below figure shows the demand and supply of DVD rentals in a city. S1 and D1 are the
original supply and demand curves. The demand curve shifts from D1 to D2.Figure 3.4
Refer to Figure 3.4 and identify the true statement.
A)The supply of DVD rentals has decreased.
B)The original equilibrium quantity was 57.
C)The new equilibrium price is $3.
D)The demand for DVD rentals has decreased.
E)The new equilibrium quantity is 48.
Unlock Deck
Unlock for access to all 96 flashcards in this deck.
Unlock Deck
k this deck
52
The table given below represents the supply schedules of the only three DVD producers in the market for DVDs.Table 3.2
According to Table 3.2, if the supply schedules 1, 2, and 3 are the market supply schedules for DVDs in three different time periods, what could explain the change from the Supply 1 schedule to the Supply 2 schedule?
A)A decrease in the price of DVDs
B)A decrease in the cost of DVD players
C)A change in consumer preferences
D)A change in the average income of consumers
E)An increase in the cost of producing DVDs
Unlock Deck
Unlock for access to all 96 flashcards in this deck.
Unlock Deck
k this deck
53
The table given below represents the supply schedules of the only three DVD producers in the market for DVDs.Table 3.2
The market supply curve for any product:
A)always depends on the market demand for that product.
B)depends on the general income level of the consumers in the market.
C)is a summation of individual firms' supply curves.
D)equals the total revenue generated through sale of the commodity.
E)is affected by the prices of related products.
Unlock Deck
Unlock for access to all 96 flashcards in this deck.
Unlock Deck
k this deck
54
The table given below represents the supply schedules of the only three DVD producers in the market for DVDs.Table 3.2
Assume that Ford Motor Company engineers achieve a revolutionary technological breakthrough in the production process of automobiles. Which of the following is expected to take place?
A)A movement up along the existing supply curve for Ford automobiles
B)The supply of Ford automobiles will remain unchanged
C)An inward shift of the supply curve for Ford automobiles
D)A downward movement along an existing supply curve for Ford automobiles
E)An outward shift of the supply curve for Ford automobiles
Unlock Deck
Unlock for access to all 96 flashcards in this deck.
Unlock Deck
k this deck
55
The figure given below represents the equilibrium in the market for bicycles under different demand and supply situations. The vertical axis in each panel shows the price of bikes.Figure 3.2
Refer to Figure 3.2. Which of the following panels represents the equilibrium situation in the bicycle market, if there were an increase in the price of metal used in the production of bicycles?
A)Panel A
B)Panel B
C)Panel C
D)Panel D
E)Panel E
Refer to Figure 3.2. Which of the following panels represents the equilibrium situation in the bicycle market, if there were an increase in the price of metal used in the production of bicycles?
A)Panel A
B)Panel B
C)Panel C
D)Panel D
E)Panel E
Unlock Deck
Unlock for access to all 96 flashcards in this deck.
Unlock Deck
k this deck
56
The table given below reports the quantity demanded and supplied of a commodity in a market at different price levels.Table 3.4
The output level that occurs in any market that is in equilibrium:
A)is the quantity where the supply curve intersects the y-axis.
B)is the quantity where the demand curve intersects the x-axis.
C)is the quantity at an output level where buyers will pay more than suppliers require.
D)is an output level where buyers will not pay as much as suppliers require.
E)is the quantity where the demand and supply curves intersect each other.
Unlock Deck
Unlock for access to all 96 flashcards in this deck.
Unlock Deck
k this deck
57
The table given below reports the quantity of bread loaves demanded and supplied at different per unit prices.Table 3.3
According to Table 3.3, equilibrium in the market for bread occurs at the price of:
A)$2 per unit
B)$3 per unit
C)$4 per unit
D)$4.5 per unit
E)$1.5 per unit
According to Table 3.3, equilibrium in the market for bread occurs at the price of:
A)$2 per unit
B)$3 per unit
C)$4 per unit
D)$4.5 per unit
E)$1.5 per unit
Unlock Deck
Unlock for access to all 96 flashcards in this deck.
Unlock Deck
k this deck
58
In the figure given below, D1 and S1 are the initial demand and supply curves for a commodity in the market.Figure 3.3
If both supply and demand for a good increase, which of the following will definitely happen?
A)Equilibrium price will remain the same
B)Equilibrium price will increase
C)Equilibrium price will decrease
D)Equilibrium quantity will increase
E)Equilibrium quantity will decrease
If both supply and demand for a good increase, which of the following will definitely happen?
A)Equilibrium price will remain the same
B)Equilibrium price will increase
C)Equilibrium price will decrease
D)Equilibrium quantity will increase
E)Equilibrium quantity will decrease
Unlock Deck
Unlock for access to all 96 flashcards in this deck.
Unlock Deck
k this deck
59
The figure given below shows the demand and supply curves in the market for coffee. S1 and D1 are the original demand and supply curves.Figure 3.5
Based on Figure 3.5, which of the following conditions would most likely move the point of equilibrium from A to B?
A)An increase in the income of a coffee buyer.
B)A decrease in the price of coffee.
C)A drought in Colombia, a major coffee producer, that affects the coffee harvest.
D)A decrease in the price of non-dairy creamers that are consumed along with coffee.
E)An increase in the price of tea, assumed to be a substitute for coffee.
Unlock Deck
Unlock for access to all 96 flashcards in this deck.
Unlock Deck
k this deck
60
The table given below reports the quantity demanded and supplied of a commodity in a market at different price levels.Table 3.4
Consider the market described by Table 3.4. Identify the correct statement.
A)The law of demand is violated
B)The law of supply is violated
C)There is no equilibrium
D)At $5 per unit, people will purchase 400 units
E)At $2 per unit, people will purchase 900 units
Consider the market described by Table 3.4. Identify the correct statement.
A)The law of demand is violated
B)The law of supply is violated
C)There is no equilibrium
D)At $5 per unit, people will purchase 400 units
E)At $2 per unit, people will purchase 900 units
Unlock Deck
Unlock for access to all 96 flashcards in this deck.
Unlock Deck
k this deck
61
The below figure shows the demand and supply curves in the market for gasoline. The price and quantity at the point of intersection of the demand and supply curves is $30 and 300 gallons respectively.Figure 3.6
The removal of a price ceiling in a market results in:
A)an increase in the market price.
B)a shortage in the market.
C)over-production of the commodity and a surplus.
D)a fall in the market price.
E)abnormal profits for producers.
The removal of a price ceiling in a market results in:
A)an increase in the market price.
B)a shortage in the market.
C)over-production of the commodity and a surplus.
D)a fall in the market price.
E)abnormal profits for producers.
Unlock Deck
Unlock for access to all 96 flashcards in this deck.
Unlock Deck
k this deck
62
The table given below reports the quantity demanded and supplied of a commodity at different prices in a market.Table 3.5
In a market where the price is restricted by price floors or price ceilings,
A)all sellers will be able to sell everything they produce.
B)surpluses and shortages will exist.
C)all buyers will get what they want.
D)disequilibrium will automatically correct itself.
E)surpluses and shortages will put pressure on the price to move to its equilibrium.
Unlock Deck
Unlock for access to all 96 flashcards in this deck.
Unlock Deck
k this deck
63
The table given below reports the quantity demanded and supplied of a commodity at different prices in a market.Table 3.5
Refer to Table 3.5. If government imposes a price floor of $2:
A)the price floor will not have an effect.
B)the price will fall to $1 because producers will be forced to incur losses.
C)demand will increase.
D)a surplus will result equal to 20 units.
E)a shortage will result equal to 20 units.
Refer to Table 3.5. If government imposes a price floor of $2:
A)the price floor will not have an effect.
B)the price will fall to $1 because producers will be forced to incur losses.
C)demand will increase.
D)a surplus will result equal to 20 units.
E)a shortage will result equal to 20 units.
Unlock Deck
Unlock for access to all 96 flashcards in this deck.
Unlock Deck
k this deck
64
The demand schedule is a price list for a fixed basket of consumer goods following a particular format.
Unlock Deck
Unlock for access to all 96 flashcards in this deck.
Unlock Deck
k this deck
65
The below figure shows the demand and supply curves in the market for gasoline. The price and quantity at the point of intersection of the demand and supply curves is $30 and 300 gallons respectively.Figure 3.6
In the market for eggs, a removal of the price ceiling on eggs results in:
A)an increase in the demand for eggs.
B)farmers supplying more eggs to the market.
C)consumers demanding a larger quantity of eggs.
D)farmers supplying less eggs to the market.
E)consumers demanding a smaller quantity of eggs.
Unlock Deck
Unlock for access to all 96 flashcards in this deck.
Unlock Deck
k this deck
66
According to the law of demand, when the price of a BMW or a Gucci purse increases, the quantity demanded of these goods will also increase because consumers consider them prestigious.
Unlock Deck
Unlock for access to all 96 flashcards in this deck.
Unlock Deck
k this deck
67
The table given below reports the quantity demanded and supplied of a commodity at different prices in a market.Table 3.5
Which of the following is true of a price floor?
A)A price floor allows supply and demand to function effectively.
B)A price floor is set such that the price is not allowed to increase above a certain level.
C)A price floor is beneficial to buyers in a market.
D)A price floor usually creates a shortage of a good in a market.
E)A price floor is set such that the price is not allowed to decrease below a certain level.
Unlock Deck
Unlock for access to all 96 flashcards in this deck.
Unlock Deck
k this deck
68
The table given below reports the quantity demanded and supplied of a commodity at different prices in a market.Table 3.5
Refer to Table 3.5. If government imposes a price ceiling of $2:
A)the price will be above equilibrium.
B)the price will fall to $1 because producers will be forced to incur losses.
C)demand will increase.
D)a surplus will result equal to 20 units.
E)a shortage will result equal to 20 units.
Refer to Table 3.5. If government imposes a price ceiling of $2:
A)the price will be above equilibrium.
B)the price will fall to $1 because producers will be forced to incur losses.
C)demand will increase.
D)a surplus will result equal to 20 units.
E)a shortage will result equal to 20 units.
Unlock Deck
Unlock for access to all 96 flashcards in this deck.
Unlock Deck
k this deck
69
The below figure shows the demand and supply curves in the market for gasoline. The price and quantity at the point of intersection of the demand and supply curves is $30 and 300 gallons respectively.Figure 3.6
Assume that the market for gasoline in Figure 3.6 is in equilibrium. What is the most likely consequence of a government-imposed price ceiling at $10 per unit?
A)The profit made by gasoline producers will increase.
B)The demand for gasoline will decrease.
C)The quantity of gasoline supplied to the market will decrease.
D)There will be a surplus of gasoline in the market.
E)The demand curve for gasoline will shift to the right.
Unlock Deck
Unlock for access to all 96 flashcards in this deck.
Unlock Deck
k this deck
70
Inferior goods are low quality goods that people prefer to buy less of.
Unlock Deck
Unlock for access to all 96 flashcards in this deck.
Unlock Deck
k this deck
71
The figure given below shows the demand and supply curves in the market for coffee. S1 and D1 are the original demand and supply curves.Figure 3.5
When a freely functioning market is in disequilibrium:
A)the government must set a price ceiling.
B)the government must set a price floor.
C)the price and quantities demanded and/or supplied change until equilibrium is established.
D)it will continue to remain in disequilibrium.
E)it will reach equilibrium at a very high/low price.
Unlock Deck
Unlock for access to all 96 flashcards in this deck.
Unlock Deck
k this deck
72
The below figure shows the demand and supply curves in the market for gasoline. The price and quantity at the point of intersection of the demand and supply curves is $30 and 300 gallons respectively.Figure 3.6
In general, the purpose of markets is to facilitate the exchange of goods and services between buyers and sellers.
In general, the purpose of markets is to facilitate the exchange of goods and services between buyers and sellers.
Unlock Deck
Unlock for access to all 96 flashcards in this deck.
Unlock Deck
k this deck
73
The demand schedule shows that the price of a good and quantity demanded are directly related to each other.
Unlock Deck
Unlock for access to all 96 flashcards in this deck.
Unlock Deck
k this deck
74
The below figure shows the demand and supply curves in the market for gasoline. The price and quantity at the point of intersection of the demand and supply curves is $30 and 300 gallons respectively.Figure 3.6
Without money, no transaction can occur.
Without money, no transaction can occur.
Unlock Deck
Unlock for access to all 96 flashcards in this deck.
Unlock Deck
k this deck
75
The table given below reports the quantity demanded and supplied of a commodity at different prices in a market.Table 3.5
Refer to Table 3.5. If government imposes a price ceiling of $4:
A)the price ceiling will not have an effect.
B)the price will fall to $1 because producers will be forced to incur losses.
C)demand will increase.
D)a surplus will result equal to 20 units.
E)a shortage will result equal to 20 units.
Refer to Table 3.5. If government imposes a price ceiling of $4:
A)the price ceiling will not have an effect.
B)the price will fall to $1 because producers will be forced to incur losses.
C)demand will increase.
D)a surplus will result equal to 20 units.
E)a shortage will result equal to 20 units.
Unlock Deck
Unlock for access to all 96 flashcards in this deck.
Unlock Deck
k this deck
76
According to the law of demand, if the price of a netbook decreases, ceteris paribus, the demand for netbooks would increase.
Unlock Deck
Unlock for access to all 96 flashcards in this deck.
Unlock Deck
k this deck
77
An example of barter is voluntary work at an old-age home.
Unlock Deck
Unlock for access to all 96 flashcards in this deck.
Unlock Deck
k this deck
78
The table given below reports the quantity demanded and supplied of a commodity at different prices in a market.Table 3.5
Which of the following is not an example of a price ceiling?
A)The Chinese government sets the price of housing in China below equilibrium.
B)The government of the former Soviet Union sets the price on food below those prevailing in the free market.
C)In the 1970s, the Nixon administration imposed wage and price controls, thereby keeping wages and prices from rising.
D)In the late 1970s, the U.S. government required gasoline to be sold at a price per gallon that was below what would have prevailed in a free market.
E)The U.S. government requires that sugar be sold at a price that exceeds the world price of sugar.
Unlock Deck
Unlock for access to all 96 flashcards in this deck.
Unlock Deck
k this deck
79
It is absolutely necessary for at least one trader to have money for barter exchange to take place.
Unlock Deck
Unlock for access to all 96 flashcards in this deck.
Unlock Deck
k this deck
80
The demand for luxurious goods are usually unaffected by an increase in income.
Unlock Deck
Unlock for access to all 96 flashcards in this deck.
Unlock Deck
k this deck
Unlock Deck
Unlock for access to all 96 flashcards in this deck.


