Deck 3: Descriptive Statistics
Full screen (f)
Question
Question
Question
Question
Question
Question
Question
Question
Question
Question
Question
Question
Question
Question
Question
Question
Question
Question
Question
Question
Question
Question
Question
Question
Question
Question
Question
Question
Question
Question
Question
Question
Question
Question
Question
Question
Question
Question
Question
Question
Question
Liz Chapa manages a portfolio of 250 common stocks.Her staff compiled the following performance statistics for two new stocks:  The coefficient of variation for Salas Products,Inc.is ___.
A)300%
B)100%
C)33%
D)5%
E)23%
The coefficient of variation for Salas Products,Inc.is ___.A)300%
B)100%
C)33%
D)5%
E)23%
Question
Question
The following frequency distribution was constructed for the age of accounts receivable: 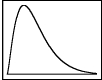 The frequency distribution reveals that the accounts receivable ages are ___.
A)skewed to the left
B)skewed to the right
C)not skewed
D)normally distributed
E)symmetrical
The frequency distribution reveals that the accounts receivable ages are ___.A)skewed to the left
B)skewed to the right
C)not skewed
D)normally distributed
E)symmetrical
Question
The ages of students in a class have been put into the frequency distribution below: 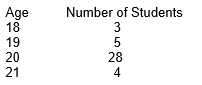
What is the median age of these students?
A)18
B)19
C)19.5
D)20
E)20.5
What is the median age of these students?
A)18
B)19
C)19.5
D)20
E)20.5
Question
The following box-and-whisker plot was constructed for the age of accounts receivable: 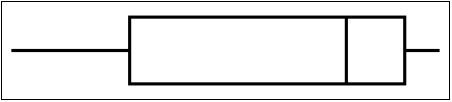 The box-and-whisker plot reveals that the accounts receivable ages are ___.
A)skewed to the left
B)skewed to the right
C)not skewed
D)normally distributed
E)symmetrical
The box-and-whisker plot reveals that the accounts receivable ages are ___.A)skewed to the left
B)skewed to the right
C)not skewed
D)normally distributed
E)symmetrical
Question
Question
Question
The ages of students in a class have been put into the frequency distribution below:
What is the modal age of these students?
A)18
B)19
C)20
D)21
E)23
What is the modal age of these students?
A)18
B)19
C)20
D)21
E)23
Question
An instructor is evaluating the performance of students on a test.He records the number of points that each student missed and created a frequency distribution.This is provided below: 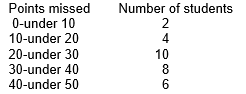
What is the variance for this population?
A)11.43
B)135.17
C)130.67
D)180.67
E)198.07
What is the variance for this population?
A)11.43
B)135.17
C)130.67
D)180.67
E)198.07
Question
Pinky Bauer,Chief Financial Officer of Harrison Haulers,Inc. ,suspects irregularities in the payroll system,and orders an inspection of "each and every payroll voucher issued since January 1,2000." Each payroll voucher was inspected and the following frequency distribution was compiled: 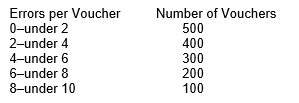
The mean number of errors per voucher is ___.
A)3.67
B)5
C)750
D)300
E)8.7
The mean number of errors per voucher is ___.
A)3.67
B)5
C)750
D)300
E)8.7
Question
An instructor is evaluating the performance of students on a test.He records the number of points that each student missed and created a frequency distribution.This is provided below:
What is the standard deviation for this population?
A)11.43
B)14.14
C)12.63
D)13.17
E)16.90
What is the standard deviation for this population?
A)11.43
B)14.14
C)12.63
D)13.17
E)16.90
Question
Question
David Desreumaux,VP of Human Resources of Maritime Boat Manufacturing (MBM),is reviewing the employee training programs of MBM factories.His staff compiled the following table of provincial statistics on safety training hours:  What can David conclude from these statistics?
A)The New Brunswick distribution is skewed to the left.
B)The New Brunswick distribution is skewed to the right.
C)The Nova Scotia distribution is skewed to the left.
D)The Nova Scotia distribution is skewed to the right.
E)Both distributions are symmetrical.
What can David conclude from these statistics?A)The New Brunswick distribution is skewed to the left.
B)The New Brunswick distribution is skewed to the right.
C)The Nova Scotia distribution is skewed to the left.
D)The Nova Scotia distribution is skewed to the right.
E)Both distributions are symmetrical.
Question
David Desreumaux,VP of Human Resources of Maritime Boat Manufacturing (MBM),is reviewing the employee training programs of MBM factories.His staff compiled the following table of provincial statistics on safety training hours:  What can David conclude from these statistics?
A)The New Brunswick distribution is symmetrical.
B)The Nova Scotia distribution is skewed to the left.
C)The New Brunswick distribution has the greater dispersion.
D)The New Brunswick distribution is skewed to the left.
E)The two distributions are symmetrical.
What can David conclude from these statistics?A)The New Brunswick distribution is symmetrical.
B)The Nova Scotia distribution is skewed to the left.
C)The New Brunswick distribution has the greater dispersion.
D)The New Brunswick distribution is skewed to the left.
E)The two distributions are symmetrical.
Question
Question
The ages of students in a class have been put into the frequency distribution below:
What is the average age of these students?
A)19.50
B)19.83
C)20.00
D)22.00
E)23.00
What is the average age of these students?
A)19.50
B)19.83
C)20.00
D)22.00
E)23.00
Question
The following frequency distribution was constructed for the age of accounts receivable: 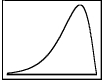 The frequency distribution reveals that the accounts receivable ages are ___.
A)skewed to the left
B)skewed to the right
C)not skewed
D)normally distributed
E)symmetrical
The frequency distribution reveals that the accounts receivable ages are ___.A)skewed to the left
B)skewed to the right
C)not skewed
D)normally distributed
E)symmetrical
Question
The following box-and-whisker plot was constructed for the age of accounts receivable: 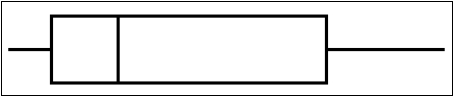 The box-and-whisker plot reveals that the accounts receivable ages are ___.
A)skewed to the left
B)skewed to the right
C)not skewed
D)normally distributed
E)symmetrical
The box-and-whisker plot reveals that the accounts receivable ages are ___.A)skewed to the left
B)skewed to the right
C)not skewed
D)normally distributed
E)symmetrical
Question
An instructor is evaluating the performance of students on a test.He records the number of points that each student missed and created a frequency distribution.This is provided below:
What is the mean number of points missed?
A)20
B)25
C)29
D)30
E)35
What is the mean number of points missed?
A)20
B)25
C)29
D)30
E)35
Question
The ages of students in a class have been put into the frequency distribution below:
What is the standard deviation for this (population)set of data?
A)0.494
B)0.703
C)1.12
D)1.25
E)1.35
What is the standard deviation for this (population)set of data?
A)0.494
B)0.703
C)1.12
D)1.25
E)1.35
Question
Question
Question
Manuel Banales,Marketing Director of Plano Power Plants Inc.'s Electrical Division,is leading a study to assess the relative importance of product features.Two items on a survey questionnaire distributed to 100 of Plano's customers asked them to rate the importance of "ease of maintenance" and "efficiency of operation" on a scale of 1 to 10 (with 1 meaning "not important" and 10 meaning "highly important").His staff assembled the following statistics on these two items:  What can Manuel conclude from these statistics?
A)The Ease of Maintenance distribution is skewed to the right.
B)The Ease of Maintenance distribution is not skewed.
C)The Efficiency of Operation distribution is skewed to the left.
D)The Efficiency of Operation distribution is positively skewed.
E)Both are symmetrically distributed.
What can Manuel conclude from these statistics?A)The Ease of Maintenance distribution is skewed to the right.
B)The Ease of Maintenance distribution is not skewed.
C)The Efficiency of Operation distribution is skewed to the left.
D)The Efficiency of Operation distribution is positively skewed.
E)Both are symmetrically distributed.

Unlock Deck
Sign up to unlock the cards in this deck!
Unlock Deck
Unlock Deck
1/63
Play
Full screen (f)
Deck 3: Descriptive Statistics
1
An appropriate measure of central tendency for ordinal data is the mode.
False
2
The sum of the average of the squared deviations from the arithmetic mean,divided by the sample size minus one is called the sample variance.
True
3
The lowest appropriate level of measurement for the median is ordinal.
True
4
The sample standard deviation is calculated by taking the square root of the population standard deviation.
Unlock Deck
Unlock for access to all 63 flashcards in this deck.
Unlock Deck
k this deck
5
Statistical measures used to yield information about the centre or the middle parts of a group of numbers are called the measures of central tendency.
Unlock Deck
Unlock for access to all 63 flashcards in this deck.
Unlock Deck
k this deck
6
Compute the mean,median,mode,standard deviation,and variance of grouped data.
Unlock Deck
Unlock for access to all 63 flashcards in this deck.
Unlock Deck
k this deck
7
The middle value in an ordered array of numbers is called the mode.
Unlock Deck
Unlock for access to all 63 flashcards in this deck.
Unlock Deck
k this deck
8
Skewness indicates that a data distribution is symmetrical or asymmetrical.
Unlock Deck
Unlock for access to all 63 flashcards in this deck.
Unlock Deck
k this deck
9
Use computer packages to compute various measures of central tendency,variation,and shape on a set of data,as well as to describe the data distribution graphically.
Unlock Deck
Unlock for access to all 63 flashcards in this deck.
Unlock Deck
k this deck
10
If the mean of a distribution is greater than the median,then the distribution is positively skewed.
Unlock Deck
Unlock for access to all 63 flashcards in this deck.
Unlock Deck
k this deck
11
A measure of how peaked the data is,is called Kurtosis.
Unlock Deck
Unlock for access to all 63 flashcards in this deck.
Unlock Deck
k this deck
12
Average deviation is a common measure of the variability of data containing a set of numbers.
Unlock Deck
Unlock for access to all 63 flashcards in this deck.
Unlock Deck
k this deck
13
Apply various measures of central tendency-including the mean,median,and mode-to a set of ungrouped data.
Unlock Deck
Unlock for access to all 63 flashcards in this deck.
Unlock Deck
k this deck
14
The most frequently occurring value in a set of data is called the mode.
Unlock Deck
Unlock for access to all 63 flashcards in this deck.
Unlock Deck
k this deck
15
Skewness and kurtosis of a data set are measures of the shape of the distribution.
Unlock Deck
Unlock for access to all 63 flashcards in this deck.
Unlock Deck
k this deck
16
It is inappropriate to use the mean to analyze data that are not at least interval level in measurement.
Unlock Deck
Unlock for access to all 63 flashcards in this deck.
Unlock Deck
k this deck
17
Apply various measures of variability-including the range,interquartile range,mean absolute deviation,variance,and standard deviation (using the empirical rule and Chebyshev's theorem)-to a set of ungrouped data.
Unlock Deck
Unlock for access to all 63 flashcards in this deck.
Unlock Deck
k this deck
18
The most appropriate measure of central tendency for nominal-level data is the median.
Unlock Deck
Unlock for access to all 63 flashcards in this deck.
Unlock Deck
k this deck
19
The sum of deviations about the arithmetic mean is always equal to zero.
Unlock Deck
Unlock for access to all 63 flashcards in this deck.
Unlock Deck
k this deck
20
Describe a data distribution statistically and graphically using skewness,kurtosis,and box-and-whisker plots.
Unlock Deck
Unlock for access to all 63 flashcards in this deck.
Unlock Deck
k this deck
21
The empirical rule says that approximately what percentage of the values would be within one standard deviation of the mean in a bell shaped set of data?
A)95%
B)68%
C)50%
D)97.7%
E)100%
A)95%
B)68%
C)50%
D)97.7%
E)100%
Unlock Deck
Unlock for access to all 63 flashcards in this deck.
Unlock Deck
k this deck
22
According to Chebyshev's Theorem,how many values in a data set will be within two standard deviations of the mean?
A)at least 75%
B)at least 68%
C)at least 95%
D)at least 89%
E)at least 99%
A)at least 75%
B)at least 68%
C)at least 95%
D)at least 89%
E)at least 99%
Unlock Deck
Unlock for access to all 63 flashcards in this deck.
Unlock Deck
k this deck
23
A statistics student made the following grades on 5 tests: 84,78,88,78,and 72.What is the mean grade?
A)78
B)80
C)72
D)84
E)88
A)78
B)80
C)72
D)84
E)88
Unlock Deck
Unlock for access to all 63 flashcards in this deck.
Unlock Deck
k this deck
24
The empirical rule says that approximately what percentage of the values would be within two standard deviations of the mean in a bell shaped set of data?
A)95%
B)68%
C)50%
D)97.7%
E)100%
A)95%
B)68%
C)50%
D)97.7%
E)100%
Unlock Deck
Unlock for access to all 63 flashcards in this deck.
Unlock Deck
k this deck
25
Jessica Salas,president of Salas Products,is reviewing the warranty policy for her company's new model of automobile batteries.Life tests performed on a sample of 100 batteries indicated: (1)an average life of 75 months, (2)a standard deviation of 5 months,and (3)a bell shaped battery life distribution.Approximately 68% of the batteries will last between ___.
A)70 and 80 months
B)60 and 90 months
C)65 and 85 months
D)55 and 95 months
E)60 and 100 months
A)70 and 80 months
B)60 and 90 months
C)65 and 85 months
D)55 and 95 months
E)60 and 100 months
Unlock Deck
Unlock for access to all 63 flashcards in this deck.
Unlock Deck
k this deck
26
The mean life of a particular brand of light bulb is 1000 hours and the standard deviation is 50 hours.We can conclude that at least 75% of this brand of bulbs will last between ___.
A)900 and 1100 hours
B)950 and 1050 hours
C)850 and 1150 hours
D)800 and 1200 hours
E)1050 and 1250 hours
A)900 and 1100 hours
B)950 and 1050 hours
C)850 and 1150 hours
D)800 and 1200 hours
E)1050 and 1250 hours
Unlock Deck
Unlock for access to all 63 flashcards in this deck.
Unlock Deck
k this deck
27
A commuter travels many kilometres to work each morning.She has timed this trip 5 times during the last month.The time (in minutes)required to make this trip was 34,39,41,35,and 41.The median time (in minutes)required for this trip was ___.
A)39
B)41
C)37.5
D)38
E)35.5
A)39
B)41
C)37.5
D)38
E)35.5
Unlock Deck
Unlock for access to all 63 flashcards in this deck.
Unlock Deck
k this deck
28
A commuter travels many kilometres to work each morning.She has timed this trip 5 times during the last month.The time (in minutes)required to make this trip was 34,39,41,35,and 41.The modal time required for this trip was ___.
A)39
B)41
C)37.5
D)38
E)35
A)39
B)41
C)37.5
D)38
E)35
Unlock Deck
Unlock for access to all 63 flashcards in this deck.
Unlock Deck
k this deck
29
A statistics student made the following grades on 5 tests: 84,78,88,78,and 82.What is the mode?
A)78
B)80
C)88
D)84
E)82
A)78
B)80
C)88
D)84
E)82
Unlock Deck
Unlock for access to all 63 flashcards in this deck.
Unlock Deck
k this deck
30
The number of standard deviations that a value (x)is above or below the mean is the ___.
A)absolute deviation
B)coefficient of variation
C)interquartile range
D)z score
E)correlation coefficient
A)absolute deviation
B)coefficient of variation
C)interquartile range
D)z score
E)correlation coefficient
Unlock Deck
Unlock for access to all 63 flashcards in this deck.
Unlock Deck
k this deck
31
The mean life of a particular brand of light bulb is 1000 hours and the standard deviation is 50 hours.Tests show that the life of the bulb is approximately normally distributed.It can be concluded that approximately 68% of the bulbs will last between ___.
A)900 and 1100 hours
B)950 and 1050 hours
C)850 and 1150 hours
D)800 and 1200 hours
E)1050 and 1250 hours
A)900 and 1100 hours
B)950 and 1050 hours
C)850 and 1150 hours
D)800 and 1200 hours
E)1050 and 1250 hours
Unlock Deck
Unlock for access to all 63 flashcards in this deck.
Unlock Deck
k this deck
32
A box and whisker plot is determined from the mean,the smallest and the largest values,and the lower and upper quartile.
Unlock Deck
Unlock for access to all 63 flashcards in this deck.
Unlock Deck
k this deck
33
A commuter travels many kilometres to work each morning.She has timed this trip 5 times during the last month.The time (in minutes)required to make this trip was 44,39,41,35,and 41.The mean time required for this trip was 40 minutes.What is the variance for this sample data?
A)8.8
B)11
C)0
D)3
E)-2
A)8.8
B)11
C)0
D)3
E)-2
Unlock Deck
Unlock for access to all 63 flashcards in this deck.
Unlock Deck
k this deck
34
A statistics student made the following grades on 5 tests: 84,78,88,72,and 72.What is the median grade?
A)88
B)72
C)78
D)80
E)82
A)88
B)72
C)78
D)80
E)82
Unlock Deck
Unlock for access to all 63 flashcards in this deck.
Unlock Deck
k this deck
35
The mean life of a particular brand of light bulb is 1000 hours and the standard deviation is 50 hours.It can be concluded that at least 89% of this brand of bulbs will last between ___.
A)900 and 1100 hours
B)950 and 1050 hours
C)850 and 1150 hours
D)800 and 1200 hours
E)1050 and 1250 hours
A)900 and 1100 hours
B)950 and 1050 hours
C)850 and 1150 hours
D)800 and 1200 hours
E)1050 and 1250 hours
Unlock Deck
Unlock for access to all 63 flashcards in this deck.
Unlock Deck
k this deck
36
A commuter travels many kilometres to work each morning.She has timed this trip 5 times during the last month.The time (in minutes)required to make this trip was 44,39,41,35,and 41.The mean time required for this trip was 40 minutes.What is the mean absolute deviation for this sample data?
A)0
B)12
C)3
D)2.4
E)1.2
A)0
B)12
C)3
D)2.4
E)1.2
Unlock Deck
Unlock for access to all 63 flashcards in this deck.
Unlock Deck
k this deck
37
If the median of a distribution is greater than mean,then the distribution is skewed to the left.
Unlock Deck
Unlock for access to all 63 flashcards in this deck.
Unlock Deck
k this deck
38
According to Chebyshev's Theorem,how many values in a data set will be within three standard deviations of the mean?
A)at least 75%
B)at least 68%
C)at least 95%
D)at least 89%
E)at least 99%
A)at least 75%
B)at least 68%
C)at least 95%
D)at least 89%
E)at least 99%
Unlock Deck
Unlock for access to all 63 flashcards in this deck.
Unlock Deck
k this deck
39
A commuter travels many kilometres to work each morning.She has timed this trip 5 times during the last month.The time (in minutes)required to make this trip was 34,39,41,35,and 41.The mean time (in minutes)required for this trip was ___.
A)35
B)41
C)37.5
D)38
E)35.5
A)35
B)41
C)37.5
D)38
E)35.5
Unlock Deck
Unlock for access to all 63 flashcards in this deck.
Unlock Deck
k this deck
40
A commuter travels many kilometres to work each morning.She has timed this trip 5 times during the last month.The time (in minutes)required to make this trip was 44,39,41,35,and 41.The mean time required for this trip was 40 minutes.What is the standard deviation for this sample data?
A)3.32
B)2.97
C)1.73
D)11
E)-1.4
A)3.32
B)2.97
C)1.73
D)11
E)-1.4
Unlock Deck
Unlock for access to all 63 flashcards in this deck.
Unlock Deck
k this deck
41
Liz Chapa manages a portfolio of 250 common stocks.Her staff compiled the following performance statistics for two new stocks: The coefficient of variation for Salas Products,Inc.is ___.
A)300%
B)100%
C)33%
D)5%
E)23%
The coefficient of variation for Salas Products,Inc.is ___.A)300%
B)100%
C)33%
D)5%
E)23%
Unlock Deck
Unlock for access to all 63 flashcards in this deck.
Unlock Deck
k this deck
42
Jessica Salas,president of Salas Products,is reviewing the warranty policy for her company's new model of automobile batteries.Life tests performed on a sample of 100 batteries indicated: (1)an average life of 75 months, (2)a standard deviation of 5 months,and (3)a bell shaped battery life distribution.Approximately 95% of the batteries will last between ___.
A)70 and 80 months
B)60 and 90 months
C)65 and 85 months
D)55 and 95 months
E)60 and 100 months
A)70 and 80 months
B)60 and 90 months
C)65 and 85 months
D)55 and 95 months
E)60 and 100 months
Unlock Deck
Unlock for access to all 63 flashcards in this deck.
Unlock Deck
k this deck
43
The following frequency distribution was constructed for the age of accounts receivable: The frequency distribution reveals that the accounts receivable ages are ___.
A)skewed to the left
B)skewed to the right
C)not skewed
D)normally distributed
E)symmetrical
The frequency distribution reveals that the accounts receivable ages are ___.A)skewed to the left
B)skewed to the right
C)not skewed
D)normally distributed
E)symmetrical
Unlock Deck
Unlock for access to all 63 flashcards in this deck.
Unlock Deck
k this deck
44
The ages of students in a class have been put into the frequency distribution below:
What is the median age of these students?
A)18
B)19
C)19.5
D)20
E)20.5
What is the median age of these students?
A)18
B)19
C)19.5
D)20
E)20.5
Unlock Deck
Unlock for access to all 63 flashcards in this deck.
Unlock Deck
k this deck
45
The following box-and-whisker plot was constructed for the age of accounts receivable: The box-and-whisker plot reveals that the accounts receivable ages are ___.
A)skewed to the left
B)skewed to the right
C)not skewed
D)normally distributed
E)symmetrical
The box-and-whisker plot reveals that the accounts receivable ages are ___.A)skewed to the left
B)skewed to the right
C)not skewed
D)normally distributed
E)symmetrical
Unlock Deck
Unlock for access to all 63 flashcards in this deck.
Unlock Deck
k this deck
46
Jessica Salas,president of Salas Products,is reviewing the warranty policy for her company's new model of automobile batteries.Life tests performed on a sample of 100 batteries indicated: (1)an average life of 75 months, (2)a standard deviation of 5 months,and (3)a bell shaped battery life distribution.Approximately 99.7% of the batteries will last between ___.
A)70 and 80 months
B)60 and 90 months
C)65 and 85 months
D)55 and 95 months
E)50 and 100 months
A)70 and 80 months
B)60 and 90 months
C)65 and 85 months
D)55 and 95 months
E)50 and 100 months
Unlock Deck
Unlock for access to all 63 flashcards in this deck.
Unlock Deck
k this deck
47
The average starting salary for graduates at a university is $25,000 with a standard deviation of $2,000.If a histogram of the data shows that it takes on a mound shape,the empirical rule says that approximately 68% of the graduates would have a starting salary between ___.
A)$23,000 and $27,000
B)$21,000 and $29,000
C)$19,000 and $31,000
D)$24,000 and $26,000
E)$26,000 and $28,000
A)$23,000 and $27,000
B)$21,000 and $29,000
C)$19,000 and $31,000
D)$24,000 and $26,000
E)$26,000 and $28,000
Unlock Deck
Unlock for access to all 63 flashcards in this deck.
Unlock Deck
k this deck
48
The ages of students in a class have been put into the frequency distribution below:
What is the modal age of these students?
A)18
B)19
C)20
D)21
E)23
What is the modal age of these students?
A)18
B)19
C)20
D)21
E)23
Unlock Deck
Unlock for access to all 63 flashcards in this deck.
Unlock Deck
k this deck
49
An instructor is evaluating the performance of students on a test.He records the number of points that each student missed and created a frequency distribution.This is provided below:
What is the variance for this population?
A)11.43
B)135.17
C)130.67
D)180.67
E)198.07
What is the variance for this population?
A)11.43
B)135.17
C)130.67
D)180.67
E)198.07
Unlock Deck
Unlock for access to all 63 flashcards in this deck.
Unlock Deck
k this deck
50
Pinky Bauer,Chief Financial Officer of Harrison Haulers,Inc. ,suspects irregularities in the payroll system,and orders an inspection of "each and every payroll voucher issued since January 1,2000." Each payroll voucher was inspected and the following frequency distribution was compiled:
The mean number of errors per voucher is ___.
A)3.67
B)5
C)750
D)300
E)8.7
The mean number of errors per voucher is ___.
A)3.67
B)5
C)750
D)300
E)8.7
Unlock Deck
Unlock for access to all 63 flashcards in this deck.
Unlock Deck
k this deck
51
An instructor is evaluating the performance of students on a test.He records the number of points that each student missed and created a frequency distribution.This is provided below:
What is the standard deviation for this population?
A)11.43
B)14.14
C)12.63
D)13.17
E)16.90
What is the standard deviation for this population?
A)11.43
B)14.14
C)12.63
D)13.17
E)16.90
Unlock Deck
Unlock for access to all 63 flashcards in this deck.
Unlock Deck
k this deck
52
Jessica Salas,president of Salas Products,is reviewing the warranty policy for her company's new model of automobile batteries.Life tests performed on a sample of 100 batteries indicated: (1)an average life of 75 months, (2)a standard deviation of 5 months,and (3)a bell shaped battery life distribution.What percentage of the batteries will fail within the first 65 months of use?
A)0.5%
B)1%
C)2.5%
D)5%
E)7.5%
A)0.5%
B)1%
C)2.5%
D)5%
E)7.5%
Unlock Deck
Unlock for access to all 63 flashcards in this deck.
Unlock Deck
k this deck
53
David Desreumaux,VP of Human Resources of Maritime Boat Manufacturing (MBM),is reviewing the employee training programs of MBM factories.His staff compiled the following table of provincial statistics on safety training hours: What can David conclude from these statistics?
A)The New Brunswick distribution is skewed to the left.
B)The New Brunswick distribution is skewed to the right.
C)The Nova Scotia distribution is skewed to the left.
D)The Nova Scotia distribution is skewed to the right.
E)Both distributions are symmetrical.
What can David conclude from these statistics?A)The New Brunswick distribution is skewed to the left.
B)The New Brunswick distribution is skewed to the right.
C)The Nova Scotia distribution is skewed to the left.
D)The Nova Scotia distribution is skewed to the right.
E)Both distributions are symmetrical.
Unlock Deck
Unlock for access to all 63 flashcards in this deck.
Unlock Deck
k this deck
54
David Desreumaux,VP of Human Resources of Maritime Boat Manufacturing (MBM),is reviewing the employee training programs of MBM factories.His staff compiled the following table of provincial statistics on safety training hours: What can David conclude from these statistics?
A)The New Brunswick distribution is symmetrical.
B)The Nova Scotia distribution is skewed to the left.
C)The New Brunswick distribution has the greater dispersion.
D)The New Brunswick distribution is skewed to the left.
E)The two distributions are symmetrical.
What can David conclude from these statistics?A)The New Brunswick distribution is symmetrical.
B)The Nova Scotia distribution is skewed to the left.
C)The New Brunswick distribution has the greater dispersion.
D)The New Brunswick distribution is skewed to the left.
E)The two distributions are symmetrical.
Unlock Deck
Unlock for access to all 63 flashcards in this deck.
Unlock Deck
k this deck
55
The average starting salary for graduates at a university is $25,000 with a standard deviation of $2,000.If a histogram of the data shows that it takes on a mound shape,the empirical rule says that approximately 95% of the graduates would have a starting salary between ___.
A)$23,000 and $27,000
B)$21,000 and $29,000
C)$19,000 and $31,000
D)$24,000 and $26,000
E)$26,000 and $28,000
A)$23,000 and $27,000
B)$21,000 and $29,000
C)$19,000 and $31,000
D)$24,000 and $26,000
E)$26,000 and $28,000
Unlock Deck
Unlock for access to all 63 flashcards in this deck.
Unlock Deck
k this deck
56
The ages of students in a class have been put into the frequency distribution below:
What is the average age of these students?
A)19.50
B)19.83
C)20.00
D)22.00
E)23.00
What is the average age of these students?
A)19.50
B)19.83
C)20.00
D)22.00
E)23.00
Unlock Deck
Unlock for access to all 63 flashcards in this deck.
Unlock Deck
k this deck
57
The following frequency distribution was constructed for the age of accounts receivable: The frequency distribution reveals that the accounts receivable ages are ___.
A)skewed to the left
B)skewed to the right
C)not skewed
D)normally distributed
E)symmetrical
The frequency distribution reveals that the accounts receivable ages are ___.A)skewed to the left
B)skewed to the right
C)not skewed
D)normally distributed
E)symmetrical
Unlock Deck
Unlock for access to all 63 flashcards in this deck.
Unlock Deck
k this deck
58
The following box-and-whisker plot was constructed for the age of accounts receivable: The box-and-whisker plot reveals that the accounts receivable ages are ___.
A)skewed to the left
B)skewed to the right
C)not skewed
D)normally distributed
E)symmetrical
The box-and-whisker plot reveals that the accounts receivable ages are ___.A)skewed to the left
B)skewed to the right
C)not skewed
D)normally distributed
E)symmetrical
Unlock Deck
Unlock for access to all 63 flashcards in this deck.
Unlock Deck
k this deck
59
An instructor is evaluating the performance of students on a test.He records the number of points that each student missed and created a frequency distribution.This is provided below:
What is the mean number of points missed?
A)20
B)25
C)29
D)30
E)35
What is the mean number of points missed?
A)20
B)25
C)29
D)30
E)35
Unlock Deck
Unlock for access to all 63 flashcards in this deck.
Unlock Deck
k this deck
60
The ages of students in a class have been put into the frequency distribution below:
What is the standard deviation for this (population)set of data?
A)0.494
B)0.703
C)1.12
D)1.25
E)1.35
What is the standard deviation for this (population)set of data?
A)0.494
B)0.703
C)1.12
D)1.25
E)1.35
Unlock Deck
Unlock for access to all 63 flashcards in this deck.
Unlock Deck
k this deck
61
In its Industry Norms and Key Business Ratios,Dun & Bradstreet reported that Q1,Q2,and Q3 for 2,037 gasoline service stations' sales to inventory ratios were 20.8,33.4,and 53.8,respectively.From this we can conclude that ___.
A)68% of these service stations had sales to inventory ratios of 20.8 or less
B)50% of these service stations had sales to inventory ratios of 33.4 or less
C)50% of these service stations had sales to inventory ratios of 53.8 or more
D)95% of these service stations had sales to inventory ratios of 20.8 or more
E)99% of these service stations had sales to inventory ratios of 20.8 or more
Unlock Deck
Unlock for access to all 63 flashcards in this deck.
Unlock Deck
k this deck
62
David Desreumaux,VP of Human Resources of Maritime Boat Manufacturing (MBM),is reviewing the employee training programs of MBM factories.His staff reports several statistics for safety training hours.The mean is 20 hours,the standard deviation is 5 hours,the median is 15 hours,and mode is 10 hours.The Pearsonian coefficient of skewness for safety training hours is ___.
A)6
B)1
C)3
D)4
E)0
A)6
B)1
C)3
D)4
E)0
Unlock Deck
Unlock for access to all 63 flashcards in this deck.
Unlock Deck
k this deck
63
Manuel Banales,Marketing Director of Plano Power Plants Inc.'s Electrical Division,is leading a study to assess the relative importance of product features.Two items on a survey questionnaire distributed to 100 of Plano's customers asked them to rate the importance of "ease of maintenance" and "efficiency of operation" on a scale of 1 to 10 (with 1 meaning "not important" and 10 meaning "highly important").His staff assembled the following statistics on these two items: What can Manuel conclude from these statistics?
A)The Ease of Maintenance distribution is skewed to the right.
B)The Ease of Maintenance distribution is not skewed.
C)The Efficiency of Operation distribution is skewed to the left.
D)The Efficiency of Operation distribution is positively skewed.
E)Both are symmetrically distributed.
What can Manuel conclude from these statistics?A)The Ease of Maintenance distribution is skewed to the right.
B)The Ease of Maintenance distribution is not skewed.
C)The Efficiency of Operation distribution is skewed to the left.
D)The Efficiency of Operation distribution is positively skewed.
E)Both are symmetrically distributed.
Unlock Deck
Unlock for access to all 63 flashcards in this deck.
Unlock Deck
k this deck
Unlock Deck
Unlock for access to all 63 flashcards in this deck.


