Deck 3: Descriptive Statistics
Full screen (f)
Question
Question
Question
Question
Question
Question
Question
Question
Question
Question
Question
Question
Question
Question
Question
Question
Question
Question
Question
Question
Question
Question
Question
Question
Question
Question
A statistics student made the following grades on 7 tests: 76,82,92,95,79,86,and 92. What is the median grade? 
B) 76
C) 82
D) 94
E) 95
B) 76
C) 82
D) 94
E) 95
Question
Question
Question
Question
Question
Question
Question
Question
Question
Question
Question
Question
Question
Question
Question
An instructor is evaluating the performance of students on a test. He records the number of points that each student missed and created a frequency distribution. This is provided below:  What is the standard deviation for this population?
A) 11.43
B) 14.14
C) 12.63
D) 13.17
E) 16.90
What is the standard deviation for this population?A) 11.43
B) 14.14
C) 12.63
D) 13.17
E) 16.90
Question
Pinky Bauer,Chief Financial Officer of Harrison Haulers,Inc.,suspects irregularities in the payroll system,and orders an inspection of "each and every payroll voucher issued since January 1,1993." Each payroll voucher was inspected and the following frequency distribution was compiled.  The median number of errors per voucher is __________.
A) 3.67
B) 5
C) 3.25
D) 400
E) 3
The median number of errors per voucher is __________.A) 3.67
B) 5
C) 3.25
D) 400
E) 3
Question
The following box and whisker plot was constructed for the age of accounts receivable. 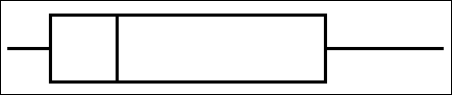 The box and whisker plot reveals that the accounts receivable ages are _______.
A) skewed to the left
B) skewed to the right
C) not skewed
D) normally distributed
E) symmetrical
The box and whisker plot reveals that the accounts receivable ages are _______.A) skewed to the left
B) skewed to the right
C) not skewed
D) normally distributed
E) symmetrical
Question
The ages of students in a class have been put into the frequency distribution below.  What is the average age of these students?
A) 19.50
B) 19.83
C) 20.00
D) 22.00
E) 23.00
What is the average age of these students?A) 19.50
B) 19.83
C) 20.00
D) 22.00
E) 23.00
Question
An instructor is evaluating the performance of students on a test. He records the number of points that each student missed and created a frequency distribution. This is provided below:  What is the mean number of points missed?
A) 20
B) 25
C) 29
D) 30
E) 35
What is the mean number of points missed?A) 20
B) 25
C) 29
D) 30
E) 35
Question
Liz Chapa manages a portfolio of 250 common stocks. Her staff compiled the following performance statistics for two new stocks.  The coefficient of variation for Salas Products,Inc.is __________.
A) 300%
B) 100%
C) 33%
D) 5%
E) 23%
The coefficient of variation for Salas Products,Inc.is __________.A) 300%
B) 100%
C) 33%
D) 5%
E) 23%
Question
Question
Question
The following box and whisker plot was constructed for the age of accounts receivable. 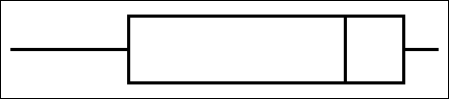 The box and whisker plot reveals that the accounts receivable ages are _______.
A) skewed to the left
B) skewed to the right
C) not skewed
D) normally distributed
E) symmetrical
The box and whisker plot reveals that the accounts receivable ages are _______.A) skewed to the left
B) skewed to the right
C) not skewed
D) normally distributed
E) symmetrical
Question
Question
Question
Question
The ages of students in a class have been put into the frequency distribution below.  What is the standard deviation for this (population)set of data?
A) 0.494
B) 0.703
C) 1.12
D) 1.25
E) 1.35
What is the standard deviation for this (population)set of data?A) 0.494
B) 0.703
C) 1.12
D) 1.25
E) 1.35
Question
The ages of students in a class have been put into the frequency distribution below.  What is the median age of these students?
A) 18
B) 19
C) 19.5
D) 20
E) 20.5
What is the median age of these students?A) 18
B) 19
C) 19.5
D) 20
E) 20.5
Question
Pinky Bauer,Chief Financial Officer of Harrison Haulers,Inc.,suspects irregularities in the payroll system,and orders an inspection of "each and every payroll voucher issued since January 1,1993." Each payroll voucher was inspected and the following frequency distribution was compiled.  The mean number of errors per voucher is __________.
A) 3.67
B) 5
C) 750
D) 300
E) 8.7
The mean number of errors per voucher is __________.A) 3.67
B) 5
C) 750
D) 300
E) 8.7
Question
An instructor is evaluating the performance of students on a test. He records the number of points that each student missed and created a frequency distribution. This is provided below:  What is the variance for this population?
A) 11.43
B) 135.17
C) 130.67
D) 180.67
E) 198.07
What is the variance for this population?A) 11.43
B) 135.17
C) 130.67
D) 180.67
E) 198.07
Question
The ages of students in a class have been put into the frequency distribution below.  What is the mode age of these students?
A) 18
B) 19
C) 20
D) 21
E) 23
What is the mode age of these students?A) 18
B) 19
C) 20
D) 21
E) 23
Question
Question
Question
Question
Question
Shaun Connor,Human Resources Manager forAmerican Oil Terminals (AOT),is reviewing the operator training hours at AOT nationally. His staff compiled the following table of national statistics on operators training hours.  What can Shaun conclude from these statistics?
A) The East Coast distribution is skewed to the left.
B) The East Coast distribution is skewed to the right.
C) The West Coast distribution is skewed to the left.
D) The West Coast distribution is skewed to the right.
E) Both distributions are symmetrical.
What can Shaun conclude from these statistics?A) The East Coast distribution is skewed to the left.
B) The East Coast distribution is skewed to the right.
C) The West Coast distribution is skewed to the left.
D) The West Coast distribution is skewed to the right.
E) Both distributions are symmetrical.
Question
The ages of the machines in one of the production lines in your company are exhibited in the frequency distribution table below.  Two additional machines have been added to the production line,and the median age of the machines didn't change.
What is the minimum number of new (0-year-old)machines that you need to purchase to change the median age of the machines?
A) 1
B) 2
C) 3
D) 4
E) 5
Two additional machines have been added to the production line,and the median age of the machines didn't change.What is the minimum number of new (0-year-old)machines that you need to purchase to change the median age of the machines?
A) 1
B) 2
C) 3
D) 4
E) 5
Question
Question
Question
A sample of 117 records of the selling price in dollars of homes from Feb 15 to Apr 30,2013 was taken from the files maintained by the Albuquerque Board of Realtors.The following are summary statistics for the selling prices.  From this we can conclude that,
A) There are no outliers
B) More homes were sold for greater than $121750 than for less than $77650
C) 68% of the selling price of homes is from $77650 to $121750
D) 25% of the selling price of homes is at least $121750
E) The distribution of selling price of homes is negatively skewed.
From this we can conclude that,A) There are no outliers
B) More homes were sold for greater than $121750 than for less than $77650
C) 68% of the selling price of homes is from $77650 to $121750
D) 25% of the selling price of homes is at least $121750
E) The distribution of selling price of homes is negatively skewed.
Question
Karen Merlott,VP for Strategic Planning at a recruitment firm,recently conducts a survey to determine customer satisfaction with job placement.She distributed the survey to 45 of the most recently placed executives. Two items on a survey questionnaire them to rate the importance of "initial interview process" and "satisfaction of final job placement" on a scale of 1 to 10 (with 1 meaning "not important" and 10 meaning "highly important"). Her staff assembled the following statistics on these two items.  What can Karen conclude from these statistics?
A) The Initial Interview Process distribution is positively skewed.
B) The Initial Interview Process distribution is not skewed.
C) The Satisfaction of Final Job Placement distribution is negatively skewed.
D) The Satisfaction of Final Job Placement distribution is positively skewed.
E) Both are symmetrically distributed.
What can Karen conclude from these statistics?A) The Initial Interview Process distribution is positively skewed.
B) The Initial Interview Process distribution is not skewed.
C) The Satisfaction of Final Job Placement distribution is negatively skewed.
D) The Satisfaction of Final Job Placement distribution is positively skewed.
E) Both are symmetrically distributed.
Question
Question
The following frequency distribution was constructed for the wait times to check out at the grocery store. 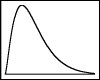 The frequency distribution reveals that the wait times to check out at the grocery store are _______.
A) skewed to the left
B) skewed to the right
C) not skewed
D) normally distributed
E) symmetrical
The frequency distribution reveals that the wait times to check out at the grocery store are _______.A) skewed to the left
B) skewed to the right
C) not skewed
D) normally distributed
E) symmetrical
Question
Question
David Desreumaux,VP of Human Resources of American First Banks (AFB),is reviewing the employee training programs of AFB banks. His staff compiled the following table of regional statistics on teller training hours.  What can David conclude from these statistics?
A) The Southeast distribution is symmetrical.
B) The Southwest distribution is skewed to the left.
C) The Southeast distribution has the greater dispersion.
D) The Southeast distribution is skewed to the left.
E) The two distributions are symmetrical.
What can David conclude from these statistics?A) The Southeast distribution is symmetrical.
B) The Southwest distribution is skewed to the left.
C) The Southeast distribution has the greater dispersion.
D) The Southeast distribution is skewed to the left.
E) The two distributions are symmetrical.
Question
Question
The frequency distribution table below shows the number of machines that produced a given number of defective products during the last semester.What is the median number of defective products? 
A) 4
B) 4.25
C) 4.33
D) 4.5
E) 4.67
A) 4
B) 4.25
C) 4.33
D) 4.5
E) 4.67
Question
Question
The following frequency distribution was constructed for the wait times in the emergency room. 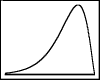 The frequency distribution reveals that the wait times in the emergency room are _______.
A) skewed to the left
B) skewed to the right
C) not skewed
D) normally distributed
E) symmetrical
The frequency distribution reveals that the wait times in the emergency room are _______.A) skewed to the left
B) skewed to the right
C) not skewed
D) normally distributed
E) symmetrical
Question
The ages of the machines in one of the production lines in your company are exhibited in the frequency distribution table below.  What is the minimum number of 6-year-old machines that you need to retire to change the median age of the machines?
A) 1
B) 2
C) 3
D) 4
E) 5
What is the minimum number of 6-year-old machines that you need to retire to change the median age of the machines?A) 1
B) 2
C) 3
D) 4
E) 5
Question
The ages of the machines in one of the production lines in your company are exhibited in the frequency distribution table below.  What is the median age of these machines?
A) 2
B) 3
C) 3.5
D) 4
E) 4.5
What is the median age of these machines?A) 2
B) 3
C) 3.5
D) 4
E) 4.5
Question
Question
Question

Unlock Deck
Sign up to unlock the cards in this deck!
Unlock Deck
Unlock Deck
1/81
Play
Full screen (f)
Deck 3: Descriptive Statistics
1
A nonzero value of the skewness indicates asymmetry of the distribution of the data.
True
2
If the mean of a distribution is greater than the median,then the distribution is positively skewed.
True
3
An appropriate measure of central tendency for ordinal data is the mode.
False
4
The median for ungrouped raw data is more complicated to compute then the median for grouped data.
Unlock Deck
Unlock for access to all 81 flashcards in this deck.
Unlock Deck
k this deck
5
Computations of the variance and standard deviation using grouped data are potentially only approximation of the actual variance and standard deviation.
Unlock Deck
Unlock for access to all 81 flashcards in this deck.
Unlock Deck
k this deck
6
The most frequently occurring value in a set of data is called the mode.
Unlock Deck
Unlock for access to all 81 flashcards in this deck.
Unlock Deck
k this deck
7
The most appropriate measure of central tendency for nominal-level data is the median.
Unlock Deck
Unlock for access to all 81 flashcards in this deck.
Unlock Deck
k this deck
8
Average deviation is a common measure of the variability of data containing a set of numbers.
Unlock Deck
Unlock for access to all 81 flashcards in this deck.
Unlock Deck
k this deck
9
The sum of deviations about the arithmetic mean is always equal to zero.
Unlock Deck
Unlock for access to all 81 flashcards in this deck.
Unlock Deck
k this deck
10
The average of the squared deviations about the arithmetic mean is called the variance.
Unlock Deck
Unlock for access to all 81 flashcards in this deck.
Unlock Deck
k this deck
11
For grouped data,the midpoint of each class interval is used to represent all the values in a class interval.
Unlock Deck
Unlock for access to all 81 flashcards in this deck.
Unlock Deck
k this deck
12
The coefficient of variation is unitless.
Unlock Deck
Unlock for access to all 81 flashcards in this deck.
Unlock Deck
k this deck
13
Statistical measures used to yield information about the center or the middle parts of a group of numbers are called the measures of central tendency.
Unlock Deck
Unlock for access to all 81 flashcards in this deck.
Unlock Deck
k this deck
14
Kurtosis is a measure of the association between two numerical variables.
Unlock Deck
Unlock for access to all 81 flashcards in this deck.
Unlock Deck
k this deck
15
The sample standard deviation is calculated by taking the square root of the population standard deviation.
Unlock Deck
Unlock for access to all 81 flashcards in this deck.
Unlock Deck
k this deck
16
For grouped data,the mode is the class midpoint of the modal class where the model class is the class interval with the greatest frequency.
Unlock Deck
Unlock for access to all 81 flashcards in this deck.
Unlock Deck
k this deck
17
Skewness and kurtosis of a data set are measures of the shape of the distribution.
Unlock Deck
Unlock for access to all 81 flashcards in this deck.
Unlock Deck
k this deck
18
The middle value in an ordered array of numbers is called the mode.
Unlock Deck
Unlock for access to all 81 flashcards in this deck.
Unlock Deck
k this deck
19
The lowest appropriate level of measurement for the median is ordinal.
Unlock Deck
Unlock for access to all 81 flashcards in this deck.
Unlock Deck
k this deck
20
It is inappropriate to use the mean to analyze data that are not at least interval level in measurement.
Unlock Deck
Unlock for access to all 81 flashcards in this deck.
Unlock Deck
k this deck
21
A box and whisker plot is determined from the mean,the smallest and the largest values,and the lower and upper quartile.
Unlock Deck
Unlock for access to all 81 flashcards in this deck.
Unlock Deck
k this deck
22
According to Chebyshev's Theorem how many values in a data set will be within 3 standard deviations of the mean?
A) At least 75%
B) At least 68%
C) At least 95%
D) At least 89%
E) At least 99%
A) At least 75%
B) At least 68%
C) At least 95%
D) At least 89%
E) At least 99%
Unlock Deck
Unlock for access to all 81 flashcards in this deck.
Unlock Deck
k this deck
23
A sample was taken of the salaries of four employees from a large company.The following are their salaries (in thousands of dollars)for this year: 33,36,41,and 47.The variance of their salaries is approximately
A) 28.19
B) 75.59
C) 37.58
D) 6.13
E) 5.31
A) 28.19
B) 75.59
C) 37.58
D) 6.13
E) 5.31
Unlock Deck
Unlock for access to all 81 flashcards in this deck.
Unlock Deck
k this deck
24
A commuter travels many miles to work each morning. She has timed this trip 5 times during the last month. The time (in minutes)required to make this trip was 34,39,41,35,and 41. The mean time (in minutes)required for this trip was _______.
A) 35
B) 41
C) 37.5
D) 38
E) 35.5
A) 35
B) 41
C) 37.5
D) 38
E) 35.5
Unlock Deck
Unlock for access to all 81 flashcards in this deck.
Unlock Deck
k this deck
25
The number of standard deviations that a value (x)is above or below the mean is the _________________.
A) absolute deviation
B) coefficient of variation
C) interquartile range
D) z score
E) correlation coefficient
A) absolute deviation
B) coefficient of variation
C) interquartile range
D) z score
E) correlation coefficient
Unlock Deck
Unlock for access to all 81 flashcards in this deck.
Unlock Deck
k this deck
26
A statistics student made the following grades on 7 tests: 76,82,92,95,79,86,and 92. What is the median grade?
B) 76
C) 82
D) 94
E) 95
B) 76
C) 82
D) 94
E) 95
Unlock Deck
Unlock for access to all 81 flashcards in this deck.
Unlock Deck
k this deck
27
A commuter travels many miles to work each morning. She has timed this trip 5 times during the last month. The time (in minutes)required to make this trip was 38,33,36,47,and 41. What is the variance for this sample data?
A) 28.5
B) 11
C) 22.8
D) 5.34
E) 4.77
A) 28.5
B) 11
C) 22.8
D) 5.34
E) 4.77
Unlock Deck
Unlock for access to all 81 flashcards in this deck.
Unlock Deck
k this deck
28
A statistics student made the following grades on 7 tests: 76,82,92,95,79,86,and 92. What is the mode?
A) 79
B) 82
C) 86
D) 92
E) 76
A) 79
B) 82
C) 86
D) 92
E) 76
Unlock Deck
Unlock for access to all 81 flashcards in this deck.
Unlock Deck
k this deck
29
The empirical rule says that approximately what percentage of the values would be within 2 standard deviations of the mean in a bell shaped set of data?
A) 95%
B) 68%
C) 50%
D) 97.7%
E) 100%
A) 95%
B) 68%
C) 50%
D) 97.7%
E) 100%
Unlock Deck
Unlock for access to all 81 flashcards in this deck.
Unlock Deck
k this deck
30
The empirical rule says that approximately what percentage of the values would be within 1 standard deviation of the mean in a bell shaped set of data?
A) 95%
B) 68%
C) 50%
D) 97.7%
E) 100%
A) 95%
B) 68%
C) 50%
D) 97.7%
E) 100%
Unlock Deck
Unlock for access to all 81 flashcards in this deck.
Unlock Deck
k this deck
31
A sample was taken of the salaries of four employees from a large company.The following are their salaries (in thousands of dollars)for this year: 33,36,41,and 47.The median of their salaries is approximately
A) 38.5
B) 34.5
C) 34
D) 44.5
E) 38
A) 38.5
B) 34.5
C) 34
D) 44.5
E) 38
Unlock Deck
Unlock for access to all 81 flashcards in this deck.
Unlock Deck
k this deck
32
The mean life of a particular brand of light bulb is 1200 hours and the standard deviation is 50 hours.We can conclude that at least 75% of this brand of bulbs will last between _______.
A) 1100 and 1300 hours
B) 1150 and 1250 hours
C) 1050 and 1350 hours
D) 1000 and 1400 hours
E) 950 and 1450 hours
A) 1100 and 1300 hours
B) 1150 and 1250 hours
C) 1050 and 1350 hours
D) 1000 and 1400 hours
E) 950 and 1450 hours
Unlock Deck
Unlock for access to all 81 flashcards in this deck.
Unlock Deck
k this deck
33
A commuter travels many miles to work each morning. She has timed this trip 5 times during the last month. The time (in minutes)required to make this trip was 34,39,41,35,and 41. The mode time required for this trip was _______.
A) 39
B) 41
C) 37.5
D) 38
E) 35
A) 39
B) 41
C) 37.5
D) 38
E) 35
Unlock Deck
Unlock for access to all 81 flashcards in this deck.
Unlock Deck
k this deck
34
An outlier of a data set is determined from the lower and upper quartile
Unlock Deck
Unlock for access to all 81 flashcards in this deck.
Unlock Deck
k this deck
35
A commuter travels many miles to work each morning. She has timed this trip 5 times during the last month. The time (in minutes)required to make this trip was 38,33,36,47,and 41. What is the standard deviation for this sample data?
A) 28.5
B) 11
C) 22.8
D) 5.34
E) 4.77
A) 28.5
B) 11
C) 22.8
D) 5.34
E) 4.77
Unlock Deck
Unlock for access to all 81 flashcards in this deck.
Unlock Deck
k this deck
36
A commuter travels many miles to work each morning. She has timed this trip 5 times during the last month. The time (in minutes)required to make this trip was 44,39,41,35,and 41. What is the mean absolute deviation for this sample data?
A) 0
B) 12
C) 3
D) 2.4
E) 1.2
A) 0
B) 12
C) 3
D) 2.4
E) 1.2
Unlock Deck
Unlock for access to all 81 flashcards in this deck.
Unlock Deck
k this deck
37
A commuter travels many miles to work each morning. She has timed this trip 5 times during the last month. The time (in minutes)required to make this trip was 34,39,41,35,and 41. The median time (in minutes)required for this trip was _______.
A) 39
B) 41
C) 37.5
D) 38
E) 35.5
A) 39
B) 41
C) 37.5
D) 38
E) 35.5
Unlock Deck
Unlock for access to all 81 flashcards in this deck.
Unlock Deck
k this deck
38
If the median of a distribution is greater than mean,then the distribution is skewed to the left.
Unlock Deck
Unlock for access to all 81 flashcards in this deck.
Unlock Deck
k this deck
39
A statistics student made the following grades on 7 tests: 76,82,92,95,79,86,and 92. What is the mean grade?
A) 78
B) 80
C) 86
D) 84
E) 88
A) 78
B) 80
C) 86
D) 84
E) 88
Unlock Deck
Unlock for access to all 81 flashcards in this deck.
Unlock Deck
k this deck
40
According to Chebyshev's Theorem,approximately how many values in a large data set will be within 2 standard deviations of the mean?
A) At least 75%
B) At least 68%
C) At least 95%
D) At least 89%
E) At least 99%
A) At least 75%
B) At least 68%
C) At least 95%
D) At least 89%
E) At least 99%
Unlock Deck
Unlock for access to all 81 flashcards in this deck.
Unlock Deck
k this deck
41
An instructor is evaluating the performance of students on a test. He records the number of points that each student missed and created a frequency distribution. This is provided below: What is the standard deviation for this population?
A) 11.43
B) 14.14
C) 12.63
D) 13.17
E) 16.90
What is the standard deviation for this population?A) 11.43
B) 14.14
C) 12.63
D) 13.17
E) 16.90
Unlock Deck
Unlock for access to all 81 flashcards in this deck.
Unlock Deck
k this deck
42
Pinky Bauer,Chief Financial Officer of Harrison Haulers,Inc.,suspects irregularities in the payroll system,and orders an inspection of "each and every payroll voucher issued since January 1,1993." Each payroll voucher was inspected and the following frequency distribution was compiled. The median number of errors per voucher is __________.
A) 3.67
B) 5
C) 3.25
D) 400
E) 3
The median number of errors per voucher is __________.A) 3.67
B) 5
C) 3.25
D) 400
E) 3
Unlock Deck
Unlock for access to all 81 flashcards in this deck.
Unlock Deck
k this deck
43
The following box and whisker plot was constructed for the age of accounts receivable. The box and whisker plot reveals that the accounts receivable ages are _______.
A) skewed to the left
B) skewed to the right
C) not skewed
D) normally distributed
E) symmetrical
The box and whisker plot reveals that the accounts receivable ages are _______.A) skewed to the left
B) skewed to the right
C) not skewed
D) normally distributed
E) symmetrical
Unlock Deck
Unlock for access to all 81 flashcards in this deck.
Unlock Deck
k this deck
44
The ages of students in a class have been put into the frequency distribution below. What is the average age of these students?
A) 19.50
B) 19.83
C) 20.00
D) 22.00
E) 23.00
What is the average age of these students?A) 19.50
B) 19.83
C) 20.00
D) 22.00
E) 23.00
Unlock Deck
Unlock for access to all 81 flashcards in this deck.
Unlock Deck
k this deck
45
An instructor is evaluating the performance of students on a test. He records the number of points that each student missed and created a frequency distribution. This is provided below: What is the mean number of points missed?
A) 20
B) 25
C) 29
D) 30
E) 35
What is the mean number of points missed?A) 20
B) 25
C) 29
D) 30
E) 35
Unlock Deck
Unlock for access to all 81 flashcards in this deck.
Unlock Deck
k this deck
46
Liz Chapa manages a portfolio of 250 common stocks. Her staff compiled the following performance statistics for two new stocks. The coefficient of variation for Salas Products,Inc.is __________.
A) 300%
B) 100%
C) 33%
D) 5%
E) 23%
The coefficient of variation for Salas Products,Inc.is __________.A) 300%
B) 100%
C) 33%
D) 5%
E) 23%
Unlock Deck
Unlock for access to all 81 flashcards in this deck.
Unlock Deck
k this deck
47
The average starting salary for graduates at a university is $33,000 with a standard deviation of $2,000. If a histogram of the data shows that it takes on a mound shape,the empirical rule says that approximately 68% of the graduates would have a starting salary between _______.
A) 29,000 and 37,000
B) 27,000 and 39,000
C) 25,000 and 41,000
D) 29,000 and 37,000
E) 21,000 and 29,000
A) 29,000 and 37,000
B) 27,000 and 39,000
C) 25,000 and 41,000
D) 29,000 and 37,000
E) 21,000 and 29,000
Unlock Deck
Unlock for access to all 81 flashcards in this deck.
Unlock Deck
k this deck
48
Jessica Salas,president of Salas Products,is reviewing the warranty policy for her company's new model of automobile batteries. Life tests performed on a sample of 100 batteries indicated: (1)an average life of 75 months,(2)a standard deviation of 5 months,and (3)a bell shaped battery life distribution.Approximately 99.7% of the batteries will last between ________________.
A) 70 and 80 months
B) 60 and 90 months
C) 65 and 85 months
D) 55 and 95 months
E) 50 and 100 months
A) 70 and 80 months
B) 60 and 90 months
C) 65 and 85 months
D) 55 and 95 months
E) 50 and 100 months
Unlock Deck
Unlock for access to all 81 flashcards in this deck.
Unlock Deck
k this deck
49
The following box and whisker plot was constructed for the age of accounts receivable. The box and whisker plot reveals that the accounts receivable ages are _______.
A) skewed to the left
B) skewed to the right
C) not skewed
D) normally distributed
E) symmetrical
The box and whisker plot reveals that the accounts receivable ages are _______.A) skewed to the left
B) skewed to the right
C) not skewed
D) normally distributed
E) symmetrical
Unlock Deck
Unlock for access to all 81 flashcards in this deck.
Unlock Deck
k this deck
50
The mean life of a particular brand of light bulb is 1200 hours and the standard deviation is 50 hours. It can be concluded that at least 89% of this brand of bulbs will last between _______.
A) 1100 and 1300 hours
B) 1150 and 1250 hours
C) 1050 and 1350 hours
D) 1000 and 1400 hours
E) 950 and 1450 hours
A) 1100 and 1300 hours
B) 1150 and 1250 hours
C) 1050 and 1350 hours
D) 1000 and 1400 hours
E) 950 and 1450 hours
Unlock Deck
Unlock for access to all 81 flashcards in this deck.
Unlock Deck
k this deck
51
The average starting salary for graduates at a university is $33,000 with a standard deviation of $2,000. If a histogram of the data shows that it takes on a mound shape,the empirical rule says that approximately 95% of the graduates would have a starting salary between _______.
A) 29,000 and 37,000
B) 27,000 and 39,000
C) 25,000 and 41,000
D) 29,000 and 37,000
E) 21,000 and 29,000
A) 29,000 and 37,000
B) 27,000 and 39,000
C) 25,000 and 41,000
D) 29,000 and 37,000
E) 21,000 and 29,000
Unlock Deck
Unlock for access to all 81 flashcards in this deck.
Unlock Deck
k this deck
52
Jessica Salas,president of Salas Products,is reviewing the warranty policy for her company's new model of automobile batteries. Life tests performed on a sample of 100 batteries indicated: (1)an average life of 75 months,(2)a standard deviation of 5 months,and (3)a bell shaped battery life distribution.Approximately 68% of the batteries will last between ________________.
A) 70 and 80 months
B) 60 and 90 months
C) 65 and 85 months
D) 55 and 95 months
E) 60 and 100 months
A) 70 and 80 months
B) 60 and 90 months
C) 65 and 85 months
D) 55 and 95 months
E) 60 and 100 months
Unlock Deck
Unlock for access to all 81 flashcards in this deck.
Unlock Deck
k this deck
53
The ages of students in a class have been put into the frequency distribution below. What is the standard deviation for this (population)set of data?
A) 0.494
B) 0.703
C) 1.12
D) 1.25
E) 1.35
What is the standard deviation for this (population)set of data?A) 0.494
B) 0.703
C) 1.12
D) 1.25
E) 1.35
Unlock Deck
Unlock for access to all 81 flashcards in this deck.
Unlock Deck
k this deck
54
The ages of students in a class have been put into the frequency distribution below. What is the median age of these students?
A) 18
B) 19
C) 19.5
D) 20
E) 20.5
What is the median age of these students?A) 18
B) 19
C) 19.5
D) 20
E) 20.5
Unlock Deck
Unlock for access to all 81 flashcards in this deck.
Unlock Deck
k this deck
55
Pinky Bauer,Chief Financial Officer of Harrison Haulers,Inc.,suspects irregularities in the payroll system,and orders an inspection of "each and every payroll voucher issued since January 1,1993." Each payroll voucher was inspected and the following frequency distribution was compiled. The mean number of errors per voucher is __________.
A) 3.67
B) 5
C) 750
D) 300
E) 8.7
The mean number of errors per voucher is __________.A) 3.67
B) 5
C) 750
D) 300
E) 8.7
Unlock Deck
Unlock for access to all 81 flashcards in this deck.
Unlock Deck
k this deck
56
An instructor is evaluating the performance of students on a test. He records the number of points that each student missed and created a frequency distribution. This is provided below: What is the variance for this population?
A) 11.43
B) 135.17
C) 130.67
D) 180.67
E) 198.07
What is the variance for this population?A) 11.43
B) 135.17
C) 130.67
D) 180.67
E) 198.07
Unlock Deck
Unlock for access to all 81 flashcards in this deck.
Unlock Deck
k this deck
57
The ages of students in a class have been put into the frequency distribution below. What is the mode age of these students?
A) 18
B) 19
C) 20
D) 21
E) 23
What is the mode age of these students?A) 18
B) 19
C) 20
D) 21
E) 23
Unlock Deck
Unlock for access to all 81 flashcards in this deck.
Unlock Deck
k this deck
58
Jessica Salas,president of Salas Products,is reviewing the warranty policy for her company's new model of automobile batteries. Life tests performed on a sample of 100 batteries indicated: (1)an average life of 75 months,(2)a standard deviation of 5 months,and (3)a bell shaped battery life distribution.Approximately 95% of the batteries will last between ________________.
A) 70 and 80 months
B) 60 and 90 months
C) 65 and 85 months
D) 55 and 95 months
E) 60 and 100 months
A) 70 and 80 months
B) 60 and 90 months
C) 65 and 85 months
D) 55 and 95 months
E) 60 and 100 months
Unlock Deck
Unlock for access to all 81 flashcards in this deck.
Unlock Deck
k this deck
59
The mean life of a particular brand of light bulb is 1200 hours and the standard deviation is 75 hours. Tests show that the life of the bulb is approximately normally distributed. It can be concluded that approximately 68% of the bulbs will last between _______.
A) 900 and 1100 hours
B) 950 and 1050 hours
C) 975 and 1475 hours
D) 1050 and 1350 hours
E) 1125 and 1275 hours
A) 900 and 1100 hours
B) 950 and 1050 hours
C) 975 and 1475 hours
D) 1050 and 1350 hours
E) 1125 and 1275 hours
Unlock Deck
Unlock for access to all 81 flashcards in this deck.
Unlock Deck
k this deck
60
Jessica Salas,president of Salas Products,is reviewing the warranty policy for her company's new model of automobile batteries. Life tests performed on a sample of 100 batteries indicated: (1)an average life of 75 months,(2)a standard deviation of 5 months,and (3)a bell shaped battery life distribution.What percentage of the batteries will fail within the first 65 months of use?
A) 0.5%
B) 1%
C) 2.5%
D) 5%
E) 7.5%
A) 0.5%
B) 1%
C) 2.5%
D) 5%
E) 7.5%
Unlock Deck
Unlock for access to all 81 flashcards in this deck.
Unlock Deck
k this deck
61
A statistics student made the following grades on the first 6 tests: 76,82,92,95,92,86.The total number of tests for the semester is 7.If the median score for the whole semester was 92,what could not have been the score of the last test?
A) 77
B) 92
C) 93
D) 94
E) 96
A) 77
B) 92
C) 93
D) 94
E) 96
Unlock Deck
Unlock for access to all 81 flashcards in this deck.
Unlock Deck
k this deck
62
Shaun Connor,Human Resources Manager forAmerican Oil Terminals (AOT),is reviewing the operator training hours at AOT nationally. His staff compiled the following table of national statistics on operators training hours. What can Shaun conclude from these statistics?
A) The East Coast distribution is skewed to the left.
B) The East Coast distribution is skewed to the right.
C) The West Coast distribution is skewed to the left.
D) The West Coast distribution is skewed to the right.
E) Both distributions are symmetrical.
What can Shaun conclude from these statistics?A) The East Coast distribution is skewed to the left.
B) The East Coast distribution is skewed to the right.
C) The West Coast distribution is skewed to the left.
D) The West Coast distribution is skewed to the right.
E) Both distributions are symmetrical.
Unlock Deck
Unlock for access to all 81 flashcards in this deck.
Unlock Deck
k this deck
63
The ages of the machines in one of the production lines in your company are exhibited in the frequency distribution table below. Two additional machines have been added to the production line,and the median age of the machines didn't change.
What is the minimum number of new (0-year-old)machines that you need to purchase to change the median age of the machines?
A) 1
B) 2
C) 3
D) 4
E) 5
Two additional machines have been added to the production line,and the median age of the machines didn't change.What is the minimum number of new (0-year-old)machines that you need to purchase to change the median age of the machines?
A) 1
B) 2
C) 3
D) 4
E) 5
Unlock Deck
Unlock for access to all 81 flashcards in this deck.
Unlock Deck
k this deck
64
David Desreumaux,VP of Human Resources of American First Banks (AFB),is reviewing the employee training programs of AFB banks. His staff reports several statistics for teller training hours. The mean is 20 hours,the standard deviation is 5 hours,the median is 15 hours,and mode is 10 hours.The Pearsonian coefficient of skewness-or Pearson's second skewness coefficient,defined as (3 × (μ - median)/σ)-for teller training hours is __________.
A) 6
B) 1
C) 3
D) 4
E) 0
A) 6
B) 1
C) 3
D) 4
E) 0
Unlock Deck
Unlock for access to all 81 flashcards in this deck.
Unlock Deck
k this deck
65
An electrical component for one of the main products your company produces is specified to have an electrical impedance of 2.15 ohms.However,the manufacturing process is not perfect and there is some variation on the actual impedance of these components.A recent statistical study indicated that in fact,the impedances are normally distributed with a mean impedance of 2.15 ohms and a standard deviation of 0.05 ohms.When the impedance exceeds 2.25 ohms,the product malfunctions so that component must be rejected and replaced by one whose impedance is within the acceptable limit.If you need 1350 usable components,how many components should you order?
A) 1608
B) 1422
C) 1421
D) 1385
E) 1384
A) 1608
B) 1422
C) 1421
D) 1385
E) 1384
Unlock Deck
Unlock for access to all 81 flashcards in this deck.
Unlock Deck
k this deck
66
A sample of 117 records of the selling price in dollars of homes from Feb 15 to Apr 30,2013 was taken from the files maintained by the Albuquerque Board of Realtors.The following are summary statistics for the selling prices. From this we can conclude that,
A) There are no outliers
B) More homes were sold for greater than $121750 than for less than $77650
C) 68% of the selling price of homes is from $77650 to $121750
D) 25% of the selling price of homes is at least $121750
E) The distribution of selling price of homes is negatively skewed.
From this we can conclude that,A) There are no outliers
B) More homes were sold for greater than $121750 than for less than $77650
C) 68% of the selling price of homes is from $77650 to $121750
D) 25% of the selling price of homes is at least $121750
E) The distribution of selling price of homes is negatively skewed.
Unlock Deck
Unlock for access to all 81 flashcards in this deck.
Unlock Deck
k this deck
67
Karen Merlott,VP for Strategic Planning at a recruitment firm,recently conducts a survey to determine customer satisfaction with job placement.She distributed the survey to 45 of the most recently placed executives. Two items on a survey questionnaire them to rate the importance of "initial interview process" and "satisfaction of final job placement" on a scale of 1 to 10 (with 1 meaning "not important" and 10 meaning "highly important"). Her staff assembled the following statistics on these two items. What can Karen conclude from these statistics?
A) The Initial Interview Process distribution is positively skewed.
B) The Initial Interview Process distribution is not skewed.
C) The Satisfaction of Final Job Placement distribution is negatively skewed.
D) The Satisfaction of Final Job Placement distribution is positively skewed.
E) Both are symmetrically distributed.
What can Karen conclude from these statistics?A) The Initial Interview Process distribution is positively skewed.
B) The Initial Interview Process distribution is not skewed.
C) The Satisfaction of Final Job Placement distribution is negatively skewed.
D) The Satisfaction of Final Job Placement distribution is positively skewed.
E) Both are symmetrically distributed.
Unlock Deck
Unlock for access to all 81 flashcards in this deck.
Unlock Deck
k this deck
68
Your company is testing a new auto engine in a race car.The race car is going in a 2-mile track.If the first lap was exactly at 2 minutes,so that the average speed for the first lap was 1.00 mile per minute,what would be the time required for the second lap so that the overall average speed will be 2 miles per minute?
A) It's not possible to end up with an overall average speed of 4 miles per minute.
B) 1.0 minute
C) 0.8 minutes
D) 0.6 minutes
E) 0.4 minutes
A) It's not possible to end up with an overall average speed of 4 miles per minute.
B) 1.0 minute
C) 0.8 minutes
D) 0.6 minutes
E) 0.4 minutes
Unlock Deck
Unlock for access to all 81 flashcards in this deck.
Unlock Deck
k this deck
69
The following frequency distribution was constructed for the wait times to check out at the grocery store. The frequency distribution reveals that the wait times to check out at the grocery store are _______.
A) skewed to the left
B) skewed to the right
C) not skewed
D) normally distributed
E) symmetrical
The frequency distribution reveals that the wait times to check out at the grocery store are _______.A) skewed to the left
B) skewed to the right
C) not skewed
D) normally distributed
E) symmetrical
Unlock Deck
Unlock for access to all 81 flashcards in this deck.
Unlock Deck
k this deck
70
The mean life of a specialized essential electronic component in one of your company's main products is 80 months,and its standard deviation is 6 months.It is known that the life for this component is not normally distributed.We can conclude that at least 96% of these components will last between _______.
A) 74 and 86 months
B) 68 and 92 months
C) 66 and 94 months
D) 64 and 96 months
E) 50 and 110 months
A) 74 and 86 months
B) 68 and 92 months
C) 66 and 94 months
D) 64 and 96 months
E) 50 and 110 months
Unlock Deck
Unlock for access to all 81 flashcards in this deck.
Unlock Deck
k this deck
71
David Desreumaux,VP of Human Resources of American First Banks (AFB),is reviewing the employee training programs of AFB banks. His staff compiled the following table of regional statistics on teller training hours. What can David conclude from these statistics?
A) The Southeast distribution is symmetrical.
B) The Southwest distribution is skewed to the left.
C) The Southeast distribution has the greater dispersion.
D) The Southeast distribution is skewed to the left.
E) The two distributions are symmetrical.
What can David conclude from these statistics?A) The Southeast distribution is symmetrical.
B) The Southwest distribution is skewed to the left.
C) The Southeast distribution has the greater dispersion.
D) The Southeast distribution is skewed to the left.
E) The two distributions are symmetrical.
Unlock Deck
Unlock for access to all 81 flashcards in this deck.
Unlock Deck
k this deck
72
A statistics student has a mean score of 92 in the first 3 tests.Suppose there are a total of 4 tests and all of them have equal weight.You can also assume that there is no extra credit in the last test.What is the best possible final average this student can get?
A) 96
B) 95
C) 94
D) 93
E) there is not enough information to find out
A) 96
B) 95
C) 94
D) 93
E) there is not enough information to find out
Unlock Deck
Unlock for access to all 81 flashcards in this deck.
Unlock Deck
k this deck
73
The frequency distribution table below shows the number of machines that produced a given number of defective products during the last semester.What is the median number of defective products?
A) 4
B) 4.25
C) 4.33
D) 4.5
E) 4.67
A) 4
B) 4.25
C) 4.33
D) 4.5
E) 4.67
Unlock Deck
Unlock for access to all 81 flashcards in this deck.
Unlock Deck
k this deck
74
A statistics student made the following grades on the first 6 tests: 76,82,92,95,79,86.The total number of tests for the semester is 7.What could be her median score for the whole semester?
A) It's not possible to answer without knowing the score on the last test.
B) 76
C) 82
D) 92
E) 95
A) It's not possible to answer without knowing the score on the last test.
B) 76
C) 82
D) 92
E) 95
Unlock Deck
Unlock for access to all 81 flashcards in this deck.
Unlock Deck
k this deck
75
The following frequency distribution was constructed for the wait times in the emergency room. The frequency distribution reveals that the wait times in the emergency room are _______.
A) skewed to the left
B) skewed to the right
C) not skewed
D) normally distributed
E) symmetrical
The frequency distribution reveals that the wait times in the emergency room are _______.A) skewed to the left
B) skewed to the right
C) not skewed
D) normally distributed
E) symmetrical
Unlock Deck
Unlock for access to all 81 flashcards in this deck.
Unlock Deck
k this deck
76
The ages of the machines in one of the production lines in your company are exhibited in the frequency distribution table below. What is the minimum number of 6-year-old machines that you need to retire to change the median age of the machines?
A) 1
B) 2
C) 3
D) 4
E) 5
What is the minimum number of 6-year-old machines that you need to retire to change the median age of the machines?A) 1
B) 2
C) 3
D) 4
E) 5
Unlock Deck
Unlock for access to all 81 flashcards in this deck.
Unlock Deck
k this deck
77
The ages of the machines in one of the production lines in your company are exhibited in the frequency distribution table below. What is the median age of these machines?
A) 2
B) 3
C) 3.5
D) 4
E) 4.5
What is the median age of these machines?A) 2
B) 3
C) 3.5
D) 4
E) 4.5
Unlock Deck
Unlock for access to all 81 flashcards in this deck.
Unlock Deck
k this deck
78
You have computed the z score for a value.Then you realize that the actual standard deviation of the population is 25% larger than the one you used for computing the z value.Your corrected z value will be _______.
A) 25% smaller than the original value
B) 25% larger than the original value
C) 75% smaller than the original value
D) 20% larger than the original value
E) 20% smaller than the original value
A) 25% smaller than the original value
B) 25% larger than the original value
C) 75% smaller than the original value
D) 20% larger than the original value
E) 20% smaller than the original value
Unlock Deck
Unlock for access to all 81 flashcards in this deck.
Unlock Deck
k this deck
79
The mean life of a particular brand of light bulb is 1200 hours.If you know that at about 95% of this brand of bulbs will last between 1100 and 1300 hours,then what is the standard deviation of the light bulbs' life?
A) 25
B) 50
C) 75
D) 100
E) 200
A) 25
B) 50
C) 75
D) 100
E) 200
Unlock Deck
Unlock for access to all 81 flashcards in this deck.
Unlock Deck
k this deck
80
In its Industry Norms and Key Business Ratios,Dun & Bradstreet reported that Q1,Q2,and Q3 for 2,037 gasoline service stations' sales to inventory ratios were 20.8,33.4,and 53.8,respectively. From this we can conclude that ____________.
A) 68% of these service stations had sales to inventory ratios of 20.8 or less
B) 50% of these service stations had sales to inventory ratios of 33.4 or less
C) 50% of these service stations had sales to inventory ratios of 53.8 or more
D) 95% of these service stations had sales to inventory ratios of 33.4 or more
E) 99% of these service stations had sales to inventory ratios of 53.8 or more
Unlock Deck
Unlock for access to all 81 flashcards in this deck.
Unlock Deck
k this deck
Unlock Deck
Unlock for access to all 81 flashcards in this deck.


