Deck 2: Production Possibilities and Economic Systems
Full screen (f)
Question
Figure 2-1 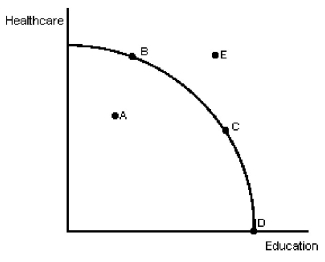
In Figure 2-1,the combination of outputs shown at point E could be obtained if
A)resources were used more efficiently.
B)resources were shifted from education to health care.
C)resources were shifted from health care to education.
D)there was an increase in society's resources.
In Figure 2-1,the combination of outputs shown at point E could be obtained if
A)resources were used more efficiently.
B)resources were shifted from education to health care.
C)resources were shifted from health care to education.
D)there was an increase in society's resources.
Question
Question
Question
Question
Figure 2-1
In Figure 2-1,the opportunity cost of moving from point B to point C
A)is the increase in output in the education sector.
B)is the loss in production in the health care sector.
C)is zero.
D)is the loss in production in the education sector.
In Figure 2-1,the opportunity cost of moving from point B to point C
A)is the increase in output in the education sector.
B)is the loss in production in the health care sector.
C)is zero.
D)is the loss in production in the education sector.
Question
Figure 2-1
In Figure 2-1,at point D,resource use is
A)less efficient than at point C.
B)more efficient than t point B.
C)less efficient than at point B.
D)more efficient than at point A.
In Figure 2-1,at point D,resource use is
A)less efficient than at point C.
B)more efficient than t point B.
C)less efficient than at point B.
D)more efficient than at point A.
Question
Figure 2-1
In Figure 2-1,could point A ever be preferred to point C?
A)No,because resource use at A is inefficient and at C it is efficient.
B)Yes,because resource use at A is efficient.
C)No,because any point like C that is on the PPC is always better than any point inside it.
D)Yes,if people valued the additional health care at A more than the additional Education at C.
Question
Question
Figure 2-2 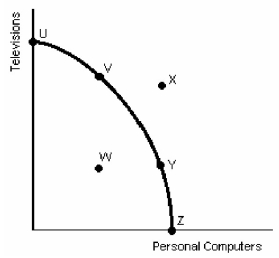
In Figure 2-2,points U,V,Y,and Z show
A)a constant trade-off between televisions and computers.
B)that society prefers more televisions than computers.
C)an inefficient allocation of society's scarce resources.
D)possible combinations of televisions and personal computers.
In Figure 2-2,points U,V,Y,and Z show
A)a constant trade-off between televisions and computers.
B)that society prefers more televisions than computers.
C)an inefficient allocation of society's scarce resources.
D)possible combinations of televisions and personal computers.
Question
Figure 2-2
In Figure 2-2,the PPC has the bowed shape because
A)some resources are better at producing one product than another.
B)all resources are equally good at producing both products.
C)all resources are perfectly adaptable.
D)some resources are equally good at producing both products.
In Figure 2-2,the PPC has the bowed shape because
A)some resources are better at producing one product than another.
B)all resources are equally good at producing both products.
C)all resources are perfectly adaptable.
D)some resources are equally good at producing both products.
Question
Figure 2-2
Given the production possibilities schedule in Table 2-1,a combination of 23 televisions and 6 computers
A)is attainable but involves the unemployment of some of society's resources.
B)cannot be produced by society given its current level of resources and production technology.
C)clearly illustrates the trade-off between televisions and computers.
D)can be produced only if society is willing to have some of its resources used inefficiently.
Question
Figure 2-1
In Figure 2-1,this society's best use of scarce resources
A)occurs at point B.
B)occurs at point A.
C)occurs at point D.
D)depends on people's wants.
In Figure 2-1,this society's best use of scarce resources
A)occurs at point B.
B)occurs at point A.
C)occurs at point D.
D)depends on people's wants.
Question
Figure 2-1
In Figure 2-1,point D shows
A)the use of all resources to produce Health Care.
B)using some resources to produce Education and some to produce Health Care.
C)the use of all resources to produce Education.
D)some unemployed resources.
In Figure 2-1,point D shows
A)the use of all resources to produce Health Care.
B)using some resources to produce Education and some to produce Health Care.
C)the use of all resources to produce Education.
D)some unemployed resources.
Question
Figure 2-2
Given the production possibilities schedule in Table 2-1,a combination of nine televisions and four personal computers
A)is attainable but involves an inefficient use of society's resources.
B)is not attainable because society does not have enough resources to produce this combination.
C)would be attainable only if a new production technology was introduced.
D)is not attainable because it is not listed in the schedule.
Question
Figure 2-1
In Figure 2-1,point A is undesirable because
A)it represents an inefficient use of resources.
B)the opportunity costs of health care are too high.
C)too much health care is being produced.
D)point E is a more realistic option in this economy.
In Figure 2-1,point A is undesirable because
A)it represents an inefficient use of resources.
B)the opportunity costs of health care are too high.
C)too much health care is being produced.
D)point E is a more realistic option in this economy.
Question
Question
Figure 2-2
Which of the following statements about movement along the PPC in Figure 2-2 is FALSE?
A)Society cannot have more of both goods at the same time.
B)An additional computer can be produced only if fewer televisions are produced.
C)The trade-off between computers and televisions is not constant.
D)There are no opportunity costs involved in choosing one point on the curve over all other points.
Question
Figure 2-2
The combination of personal computers and televisions shown in Figure 2-2 by point W
A)is beyond the capacity of society to produce.
B)is attainable but involves the inefficient use of some of society's resources.
C)is more desirable than point X because producing at W does not put a strain on society's resources.
D)is an efficient use of society's resources because it is below the production possibilities curve.
Question
Figure 2-2
In Figure 2-2,the combination of personal computers and televisions shown by point X
A)suggests that the law of increasing relative costs does not hold.
B)can be attained only if some of society's resources are unemployed.
C)is not attainable at the point in the period for which the graph is drawn.
D)results only because society allocates its resources inefficiently.
Question
Question
Figure 2-3
Tonnes
of
Soybeans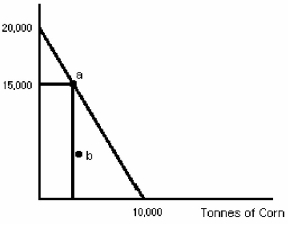
The production possibilities curve shown in Figure 2-3 shows that the opportunity cost of each tonne of soybeans is
A)1 tonne of corn.
B)1/2 tonne of corn.
C)2/3 tonnes of corn.
D)2 tonnes of corn.
Tonnes
of
Soybeans
The production possibilities curve shown in Figure 2-3 shows that the opportunity cost of each tonne of soybeans is
A)1 tonne of corn.
B)1/2 tonne of corn.
C)2/3 tonnes of corn.
D)2 tonnes of corn.
Question
Question
Question
Figure 2-2
In Table 2-1,if the economy moves from point F to point E,________ televisions are gained at a cost of ________ given up.
In Table 2-1,if the economy moves from point F to point E,________ televisions are gained at a cost of ________ given up.
Question
Question
Figure 2-3
Tonnes
of
Soybeans
Given the PPC in Figure 2-3,if farmers are producing 7,000 tonnes of soybeans at point b,they
A)must be using more land than was used in constructing the production possibilities curve.
B)are productively inefficient and resource use therefore is allocatively inefficient.
C)are productively inefficient but overall resource use is allocatively efficient.
D)are using land to produce a crop other than soybeans or corn.
Question
Figure 2-2
In Table 2-1,if the economy moves from point F to point D,________ televisions are gained at a cost of ________ computers given up.
In Table 2-1,if the economy moves from point F to point D,________ televisions are gained at a cost of ________ computers given up.
Question
Figure 2-2
In Table 2-1,the opportunity cost of each additional computer in terms of televisions given up
A)falls as more computers are produced.
B)increases as more computers are produced.
C)is meaningless because the cost of computers cannot be expressed in terms of televisions.
D)remains constant.
In Table 2-1,the opportunity cost of each additional computer in terms of televisions given up
A)falls as more computers are produced.
B)increases as more computers are produced.
C)is meaningless because the cost of computers cannot be expressed in terms of televisions.
D)remains constant.
Question
Figure 2-3
Tonnes
of
Soybeans
Given Figure 2-3 as the PPC for a particular farmer,if the farm is producing 7,000 tonnes of soybeans at point b,we know that
A)the farmer must be using only 75 hectares of his land.
B)the farmer must have leased an additional 25 hectares of land.
C)the farmer must be producing 5000 tonnes of corn.
D)if the farmer were using his resources efficiently,he could be producing 6500 tonnes of corn.
Question
Figure 2-3
Tonnes
of
Soybeans
A farmer has 100 hectares of land on which he can grow either soybeans or corn.A hectare of land yields 200 tonnes of soybeans or 100 tonnes of corn.Figure 2-3 shows the farmer's
A)trade-off curve.
B)opportunity cost curve.
C)substitution options curve.
D)production possibilities curve.
Question
Question
Question
Question
Question
Figure 2-2
In Table 2-1,the opportunity cost of each additional television in terms of computers given up
A)falls as more computers are produced.
B)increases as more computers are produced.
C)is meaningless because the cost of computers cannot be expressed in terms of televisions.
D)remains constant.
In Table 2-1,the opportunity cost of each additional television in terms of computers given up
A)falls as more computers are produced.
B)increases as more computers are produced.
C)is meaningless because the cost of computers cannot be expressed in terms of televisions.
D)remains constant.
Question
Figure 2-3
Tonnes
of
Soybeans
In Figure 2-3,how many units of corn are produced at point "a"?
A)2,500
B)3,000
C)2,000
D)Can't tell without more information.
Tonnes
of
Soybeans
In Figure 2-3,how many units of corn are produced at point "a"?
A)2,500
B)3,000
C)2,000
D)Can't tell without more information.
Question
Figure 2-3
Tonnes
of
Soybeans
The PPC shown in Figure 2-3 shows that the opportunity cost of a tonne of corn is
A)1/2 tonne of soybeans..
B)1 tonne of soybeans.
C)1 1/2 tonnes of soybeans.
D)2 tonnes of soybeans.
Tonnes
of
Soybeans
The PPC shown in Figure 2-3 shows that the opportunity cost of a tonne of corn is
A)1/2 tonne of soybeans..
B)1 tonne of soybeans.
C)1 1/2 tonnes of soybeans.
D)2 tonnes of soybeans.
Question
Question
Figure 2-2
In Table 2-1,if the economy moves from point D to point E,the opportunity cost of the extra personal computer in terms of televisions given up is ________.
In Table 2-1,if the economy moves from point D to point E,the opportunity cost of the extra personal computer in terms of televisions given up is ________.
Question
Question
Question
Question
Figure 2-4 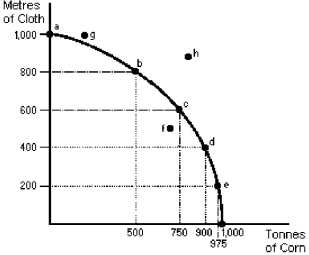
Between points c and b in Figure 2-4,the opportunity cost of 200 metres of cloth is ________.
Between points c and b in Figure 2-4,the opportunity cost of 200 metres of cloth is ________.
Question
Figure 2-4
In Figure 2-4,the bowed-out shape of the production possibilities curve indicates that
A)resources are being used efficiently.
B)resources are being used inefficiently.
C)production is efficient but the economy is experiencing allocative inefficiency.
D)some resources are relatively better at producing corn and others are better at producing cloth.
Question
Question
Question
Question
Question
Question
Question
Question
Figure 2-4
In Figure 2-4,which of the following would NOT be a means by which society might move to point h?
A)an improvement in technology.
B)an increase in quantity of capital.
C)an increase in quantity of labour.
D)more efficient use of current resources.
In Figure 2-4,which of the following would NOT be a means by which society might move to point h?
A)an improvement in technology.
B)an increase in quantity of capital.
C)an increase in quantity of labour.
D)more efficient use of current resources.
Question
Figure 2-4
Between points b and c in Figure 2-4,the (average)opportunity cost of another metre of cloth is ________.
Between points b and c in Figure 2-4,the (average)opportunity cost of another metre of cloth is ________.
Question
Figure 2-4
In Figure 2-4,which of the following points indicates a productively inefficient use of resources?
A)f
B)g
C)a
D)h
In Figure 2-4,which of the following points indicates a productively inefficient use of resources?
A)f
B)g
C)a
D)h
Question
Figure 2-4
In Figure 2-4,between points b and c the opportunity cost of 250 tonnes of corn is
A)250 metres of cloth.
B)400 metres of cloth.
C)600 metres of cloth.
D)200 metres of cloth.
In Figure 2-4,between points b and c the opportunity cost of 250 tonnes of corn is
A)250 metres of cloth.
B)400 metres of cloth.
C)600 metres of cloth.
D)200 metres of cloth.
Question
Question
Figure 2-4
Between c and b in Figure 2-4,the opportunity cost of another tonne of corn is (on average)
A)1 metre of cloth.
B)100/125 metres of cloth.
C)100/250 metres of cloth.
D)1)25 metres of cloth.
Between c and b in Figure 2-4,the opportunity cost of another tonne of corn is (on average)
A)1 metre of cloth.
B)100/125 metres of cloth.
C)100/250 metres of cloth.
D)1)25 metres of cloth.
Question
Question
Figure 2-4
The shape of the production possibilities curve in Figure 2-4 indicates that
A)production of both corn and cloth is characterized by constant costs.
B)production of corn is characterized by constant costs and the production of cloth by increasing costs.
C)production of both corn and cloth is characterized by increasing costs.
D)production of corn is characterized by increasing costs while the production of cloth is characterized by decreasing costs.
Question
Question
Question
Question
Question
Question
Question
Question
Question
Question
Question
Question
Question
Question
Question
Question
Question
Question
Question
Question
Question

Unlock Deck
Sign up to unlock the cards in this deck!
Unlock Deck
Unlock Deck
1/137
Play
Full screen (f)
Deck 2: Production Possibilities and Economic Systems
1
Figure 2-1
In Figure 2-1,the combination of outputs shown at point E could be obtained if
A)resources were used more efficiently.
B)resources were shifted from education to health care.
C)resources were shifted from health care to education.
D)there was an increase in society's resources.
In Figure 2-1,the combination of outputs shown at point E could be obtained if
A)resources were used more efficiently.
B)resources were shifted from education to health care.
C)resources were shifted from health care to education.
D)there was an increase in society's resources.
there was an increase in society's resources.
2
Technology is defined in economics as
A)output beyond the production possibilities boundary.
B)the utilization of the most advanced machinery.
C)society's pool of applied knowledge concerning how goods and services can be produced.
D)the most advanced computer hardware and software.
A)output beyond the production possibilities boundary.
B)the utilization of the most advanced machinery.
C)society's pool of applied knowledge concerning how goods and services can be produced.
D)the most advanced computer hardware and software.
society's pool of applied knowledge concerning how goods and services can be produced.
3
In the language of economics,"technology" is defined as ________.
society's pool of applied knowledge concerning the production of goods and services.
4
Which of the following is NOT an assumption used in deriving a production possibility curve?
A)The labour force is growing.
B)Resources are fully employed.
C)Technology is constant.
D)The quality of inputs is constant.
A)The labour force is growing.
B)Resources are fully employed.
C)Technology is constant.
D)The quality of inputs is constant.
Unlock Deck
Unlock for access to all 137 flashcards in this deck.
Unlock Deck
k this deck
5
Figure 2-1
In Figure 2-1,the opportunity cost of moving from point B to point C
A)is the increase in output in the education sector.
B)is the loss in production in the health care sector.
C)is zero.
D)is the loss in production in the education sector.
In Figure 2-1,the opportunity cost of moving from point B to point C
A)is the increase in output in the education sector.
B)is the loss in production in the health care sector.
C)is zero.
D)is the loss in production in the education sector.
Unlock Deck
Unlock for access to all 137 flashcards in this deck.
Unlock Deck
k this deck
6
Figure 2-1
In Figure 2-1,at point D,resource use is
A)less efficient than at point C.
B)more efficient than t point B.
C)less efficient than at point B.
D)more efficient than at point A.
In Figure 2-1,at point D,resource use is
A)less efficient than at point C.
B)more efficient than t point B.
C)less efficient than at point B.
D)more efficient than at point A.
Unlock Deck
Unlock for access to all 137 flashcards in this deck.
Unlock Deck
k this deck
7
Figure 2-1
In Figure 2-1,could point A ever be preferred to point C?
A)No,because resource use at A is inefficient and at C it is efficient.
B)Yes,because resource use at A is efficient.
C)No,because any point like C that is on the PPC is always better than any point inside it.
D)Yes,if people valued the additional health care at A more than the additional Education at C.
Unlock Deck
Unlock for access to all 137 flashcards in this deck.
Unlock Deck
k this deck
8
A production possibilities curve represents
A)combinations of goods and services among which consumers are indifferent.
B)the maximum combination of goods and services that can be produced with fixed resources and technology,given efficient use of the resources.
C)the maximum amount of labour and capital available to society.
D)the maximum rate of growth of capital and labour in a country.
Unlock Deck
Unlock for access to all 137 flashcards in this deck.
Unlock Deck
k this deck
9
Figure 2-2
In Figure 2-2,points U,V,Y,and Z show
A)a constant trade-off between televisions and computers.
B)that society prefers more televisions than computers.
C)an inefficient allocation of society's scarce resources.
D)possible combinations of televisions and personal computers.
In Figure 2-2,points U,V,Y,and Z show
A)a constant trade-off between televisions and computers.
B)that society prefers more televisions than computers.
C)an inefficient allocation of society's scarce resources.
D)possible combinations of televisions and personal computers.
Unlock Deck
Unlock for access to all 137 flashcards in this deck.
Unlock Deck
k this deck
10
Figure 2-2
In Figure 2-2,the PPC has the bowed shape because
A)some resources are better at producing one product than another.
B)all resources are equally good at producing both products.
C)all resources are perfectly adaptable.
D)some resources are equally good at producing both products.
In Figure 2-2,the PPC has the bowed shape because
A)some resources are better at producing one product than another.
B)all resources are equally good at producing both products.
C)all resources are perfectly adaptable.
D)some resources are equally good at producing both products.
Unlock Deck
Unlock for access to all 137 flashcards in this deck.
Unlock Deck
k this deck
11
Figure 2-2
Given the production possibilities schedule in Table 2-1,a combination of 23 televisions and 6 computers
A)is attainable but involves the unemployment of some of society's resources.
B)cannot be produced by society given its current level of resources and production technology.
C)clearly illustrates the trade-off between televisions and computers.
D)can be produced only if society is willing to have some of its resources used inefficiently.
Unlock Deck
Unlock for access to all 137 flashcards in this deck.
Unlock Deck
k this deck
12
Figure 2-1
In Figure 2-1,this society's best use of scarce resources
A)occurs at point B.
B)occurs at point A.
C)occurs at point D.
D)depends on people's wants.
In Figure 2-1,this society's best use of scarce resources
A)occurs at point B.
B)occurs at point A.
C)occurs at point D.
D)depends on people's wants.
Unlock Deck
Unlock for access to all 137 flashcards in this deck.
Unlock Deck
k this deck
13
Figure 2-1
In Figure 2-1,point D shows
A)the use of all resources to produce Health Care.
B)using some resources to produce Education and some to produce Health Care.
C)the use of all resources to produce Education.
D)some unemployed resources.
In Figure 2-1,point D shows
A)the use of all resources to produce Health Care.
B)using some resources to produce Education and some to produce Health Care.
C)the use of all resources to produce Education.
D)some unemployed resources.
Unlock Deck
Unlock for access to all 137 flashcards in this deck.
Unlock Deck
k this deck
14
Figure 2-2
Given the production possibilities schedule in Table 2-1,a combination of nine televisions and four personal computers
A)is attainable but involves an inefficient use of society's resources.
B)is not attainable because society does not have enough resources to produce this combination.
C)would be attainable only if a new production technology was introduced.
D)is not attainable because it is not listed in the schedule.
Unlock Deck
Unlock for access to all 137 flashcards in this deck.
Unlock Deck
k this deck
15
Figure 2-1
In Figure 2-1,point A is undesirable because
A)it represents an inefficient use of resources.
B)the opportunity costs of health care are too high.
C)too much health care is being produced.
D)point E is a more realistic option in this economy.
In Figure 2-1,point A is undesirable because
A)it represents an inefficient use of resources.
B)the opportunity costs of health care are too high.
C)too much health care is being produced.
D)point E is a more realistic option in this economy.
Unlock Deck
Unlock for access to all 137 flashcards in this deck.
Unlock Deck
k this deck
16
One assumption underlying the production possibilities curve is that
A)the quantity of the resources available for the production of economic goods is fixed over a given time period.
B)some of the factors of production are not being used.
C)at least one of the factors of production is a free good.
D)there is at least one factor of production that is employed inefficiently.
Unlock Deck
Unlock for access to all 137 flashcards in this deck.
Unlock Deck
k this deck
17
Figure 2-2
Which of the following statements about movement along the PPC in Figure 2-2 is FALSE?
A)Society cannot have more of both goods at the same time.
B)An additional computer can be produced only if fewer televisions are produced.
C)The trade-off between computers and televisions is not constant.
D)There are no opportunity costs involved in choosing one point on the curve over all other points.
Unlock Deck
Unlock for access to all 137 flashcards in this deck.
Unlock Deck
k this deck
18
Figure 2-2
The combination of personal computers and televisions shown in Figure 2-2 by point W
A)is beyond the capacity of society to produce.
B)is attainable but involves the inefficient use of some of society's resources.
C)is more desirable than point X because producing at W does not put a strain on society's resources.
D)is an efficient use of society's resources because it is below the production possibilities curve.
Unlock Deck
Unlock for access to all 137 flashcards in this deck.
Unlock Deck
k this deck
19
Figure 2-2
In Figure 2-2,the combination of personal computers and televisions shown by point X
A)suggests that the law of increasing relative costs does not hold.
B)can be attained only if some of society's resources are unemployed.
C)is not attainable at the point in the period for which the graph is drawn.
D)results only because society allocates its resources inefficiently.
Unlock Deck
Unlock for access to all 137 flashcards in this deck.
Unlock Deck
k this deck
20
A society currently operating on its production possibilities curve is
A)technologically inefficient.
B)consuming too much output.
C)fully utilizing its productive resources.
D)under-utilizing its resources.
A)technologically inefficient.
B)consuming too much output.
C)fully utilizing its productive resources.
D)under-utilizing its resources.
Unlock Deck
Unlock for access to all 137 flashcards in this deck.
Unlock Deck
k this deck
21
Figure 2-3
Tonnes
of
Soybeans
The production possibilities curve shown in Figure 2-3 shows that the opportunity cost of each tonne of soybeans is
A)1 tonne of corn.
B)1/2 tonne of corn.
C)2/3 tonnes of corn.
D)2 tonnes of corn.
Tonnes
of
Soybeans
The production possibilities curve shown in Figure 2-3 shows that the opportunity cost of each tonne of soybeans is
A)1 tonne of corn.
B)1/2 tonne of corn.
C)2/3 tonnes of corn.
D)2 tonnes of corn.
Unlock Deck
Unlock for access to all 137 flashcards in this deck.
Unlock Deck
k this deck
22
A movement along the production possibilities curve would suggest that
A)society has chosen to produce a different set of outputs.
B)productivity has declined because workers are demanding more leisure.
C)the labour force has grown.
D)productivity has increased.
A)society has chosen to produce a different set of outputs.
B)productivity has declined because workers are demanding more leisure.
C)the labour force has grown.
D)productivity has increased.
Unlock Deck
Unlock for access to all 137 flashcards in this deck.
Unlock Deck
k this deck
23
The prime minister of Canada promises to produce more defence goods without causing any decreases in the production of other goods.Such a promise could be valid
A)if Canada is currently producing inside its production possibilities curve.
B)if Canada is producing to the right of its production possibilities curve.
C)if Canada is producing at a point on its production possibilities curve.
D)under no possible circumstances;the production possibilities curve would have to shift to the right.
Unlock Deck
Unlock for access to all 137 flashcards in this deck.
Unlock Deck
k this deck
24
Figure 2-2
In Table 2-1,if the economy moves from point F to point E,________ televisions are gained at a cost of ________ given up.
In Table 2-1,if the economy moves from point F to point E,________ televisions are gained at a cost of ________ given up.
Unlock Deck
Unlock for access to all 137 flashcards in this deck.
Unlock Deck
k this deck
25
Which of the following would cause an economy to produce at a point inside its PPC?
A)population growth
B)the efficient allocation of all factors of production
C)unemployment or inefficient use of available resources
D)capital accumulation
A)population growth
B)the efficient allocation of all factors of production
C)unemployment or inefficient use of available resources
D)capital accumulation
Unlock Deck
Unlock for access to all 137 flashcards in this deck.
Unlock Deck
k this deck
26
Figure 2-3
Tonnes
of
Soybeans
Given the PPC in Figure 2-3,if farmers are producing 7,000 tonnes of soybeans at point b,they
A)must be using more land than was used in constructing the production possibilities curve.
B)are productively inefficient and resource use therefore is allocatively inefficient.
C)are productively inefficient but overall resource use is allocatively efficient.
D)are using land to produce a crop other than soybeans or corn.
Unlock Deck
Unlock for access to all 137 flashcards in this deck.
Unlock Deck
k this deck
27
Figure 2-2
In Table 2-1,if the economy moves from point F to point D,________ televisions are gained at a cost of ________ computers given up.
In Table 2-1,if the economy moves from point F to point D,________ televisions are gained at a cost of ________ computers given up.
Unlock Deck
Unlock for access to all 137 flashcards in this deck.
Unlock Deck
k this deck
28
Figure 2-2
In Table 2-1,the opportunity cost of each additional computer in terms of televisions given up
A)falls as more computers are produced.
B)increases as more computers are produced.
C)is meaningless because the cost of computers cannot be expressed in terms of televisions.
D)remains constant.
In Table 2-1,the opportunity cost of each additional computer in terms of televisions given up
A)falls as more computers are produced.
B)increases as more computers are produced.
C)is meaningless because the cost of computers cannot be expressed in terms of televisions.
D)remains constant.
Unlock Deck
Unlock for access to all 137 flashcards in this deck.
Unlock Deck
k this deck
29
Figure 2-3
Tonnes
of
Soybeans
Given Figure 2-3 as the PPC for a particular farmer,if the farm is producing 7,000 tonnes of soybeans at point b,we know that
A)the farmer must be using only 75 hectares of his land.
B)the farmer must have leased an additional 25 hectares of land.
C)the farmer must be producing 5000 tonnes of corn.
D)if the farmer were using his resources efficiently,he could be producing 6500 tonnes of corn.
Unlock Deck
Unlock for access to all 137 flashcards in this deck.
Unlock Deck
k this deck
30
Figure 2-3
Tonnes
of
Soybeans
A farmer has 100 hectares of land on which he can grow either soybeans or corn.A hectare of land yields 200 tonnes of soybeans or 100 tonnes of corn.Figure 2-3 shows the farmer's
A)trade-off curve.
B)opportunity cost curve.
C)substitution options curve.
D)production possibilities curve.
Unlock Deck
Unlock for access to all 137 flashcards in this deck.
Unlock Deck
k this deck
31
A society on its production possibilities curve is
A)technologically inefficient but allocatively efficient.
B)consuming too much output.
C)fully utilizing its productive resources but may or may not be allocatively inefficient.
D)under-utilizing its resources.
A)technologically inefficient but allocatively efficient.
B)consuming too much output.
C)fully utilizing its productive resources but may or may not be allocatively inefficient.
D)under-utilizing its resources.
Unlock Deck
Unlock for access to all 137 flashcards in this deck.
Unlock Deck
k this deck
32
Production is efficient if
A)it generates a point beyond the production possibility curve.
B)the maximum output possible given available resources and current technology.
C)technological change occurs.
D)the maximum amounts of the most important goods are produced.
A)it generates a point beyond the production possibility curve.
B)the maximum output possible given available resources and current technology.
C)technological change occurs.
D)the maximum amounts of the most important goods are produced.
Unlock Deck
Unlock for access to all 137 flashcards in this deck.
Unlock Deck
k this deck
33
If an economy is operating at a point located inside the production possibilities curve,then
A)society's resources are being inefficiently utilized.
B)the curve will move to the left.
C)the curve will move to the right.
D)society's resources are being used to produce too many consumer goods.
A)society's resources are being inefficiently utilized.
B)the curve will move to the left.
C)the curve will move to the right.
D)society's resources are being used to produce too many consumer goods.
Unlock Deck
Unlock for access to all 137 flashcards in this deck.
Unlock Deck
k this deck
34
A point outside a society's PPC is
A)technologically inefficient.
B)unattainable given the resources of the society and current technology..
C)undesirable given the implied underemployment of resources.
D)desirable since it satisfies the desires of the population.
A)technologically inefficient.
B)unattainable given the resources of the society and current technology..
C)undesirable given the implied underemployment of resources.
D)desirable since it satisfies the desires of the population.
Unlock Deck
Unlock for access to all 137 flashcards in this deck.
Unlock Deck
k this deck
35
Figure 2-2
In Table 2-1,the opportunity cost of each additional television in terms of computers given up
A)falls as more computers are produced.
B)increases as more computers are produced.
C)is meaningless because the cost of computers cannot be expressed in terms of televisions.
D)remains constant.
In Table 2-1,the opportunity cost of each additional television in terms of computers given up
A)falls as more computers are produced.
B)increases as more computers are produced.
C)is meaningless because the cost of computers cannot be expressed in terms of televisions.
D)remains constant.
Unlock Deck
Unlock for access to all 137 flashcards in this deck.
Unlock Deck
k this deck
36
Figure 2-3
Tonnes
of
Soybeans
In Figure 2-3,how many units of corn are produced at point "a"?
A)2,500
B)3,000
C)2,000
D)Can't tell without more information.
Tonnes
of
Soybeans
In Figure 2-3,how many units of corn are produced at point "a"?
A)2,500
B)3,000
C)2,000
D)Can't tell without more information.
Unlock Deck
Unlock for access to all 137 flashcards in this deck.
Unlock Deck
k this deck
37
Figure 2-3
Tonnes
of
Soybeans
The PPC shown in Figure 2-3 shows that the opportunity cost of a tonne of corn is
A)1/2 tonne of soybeans..
B)1 tonne of soybeans.
C)1 1/2 tonnes of soybeans.
D)2 tonnes of soybeans.
Tonnes
of
Soybeans
The PPC shown in Figure 2-3 shows that the opportunity cost of a tonne of corn is
A)1/2 tonne of soybeans..
B)1 tonne of soybeans.
C)1 1/2 tonnes of soybeans.
D)2 tonnes of soybeans.
Unlock Deck
Unlock for access to all 137 flashcards in this deck.
Unlock Deck
k this deck
38
A point located inside a society's production possibilities curve represents
A)an unattainable combination of outputs.
B)an under-utilization of productive resources.
C)a technically superior output combination.
D)an output combination which satisfies the needs of the population.
A)an unattainable combination of outputs.
B)an under-utilization of productive resources.
C)a technically superior output combination.
D)an output combination which satisfies the needs of the population.
Unlock Deck
Unlock for access to all 137 flashcards in this deck.
Unlock Deck
k this deck
39
Figure 2-2
In Table 2-1,if the economy moves from point D to point E,the opportunity cost of the extra personal computer in terms of televisions given up is ________.
In Table 2-1,if the economy moves from point D to point E,the opportunity cost of the extra personal computer in terms of televisions given up is ________.
Unlock Deck
Unlock for access to all 137 flashcards in this deck.
Unlock Deck
k this deck
40
A point outside a production possibilities curve shows
A)that resources are not being used efficiently.
B)that resources are being used very efficiently.
C)that opportunity costs are constant.
D)an output combination attainable only if society gets more resources or technological change occurs.
A)that resources are not being used efficiently.
B)that resources are being used very efficiently.
C)that opportunity costs are constant.
D)an output combination attainable only if society gets more resources or technological change occurs.
Unlock Deck
Unlock for access to all 137 flashcards in this deck.
Unlock Deck
k this deck
41
The fact that a country's production possibilities curve bows outward tells us that
A)opportunity costs are fixed as the production of a good increases.
B)opportunity costs decrease as the production of a good increases.
C)resources are of uniform quality.
D)opportunity costs increase as the production of a good increases.
A)opportunity costs are fixed as the production of a good increases.
B)opportunity costs decrease as the production of a good increases.
C)resources are of uniform quality.
D)opportunity costs increase as the production of a good increases.
Unlock Deck
Unlock for access to all 137 flashcards in this deck.
Unlock Deck
k this deck
42
A straight-line PPC would indicate that there is
A)no opportunity cost between the two goods.
B)an increasing opportunity cost between the two goods.
C)a constant opportunity cost between the two goods.
D)a decreasing opportunity cost between the two goods.
A)no opportunity cost between the two goods.
B)an increasing opportunity cost between the two goods.
C)a constant opportunity cost between the two goods.
D)a decreasing opportunity cost between the two goods.
Unlock Deck
Unlock for access to all 137 flashcards in this deck.
Unlock Deck
k this deck
43
Figure 2-4
Between points c and b in Figure 2-4,the opportunity cost of 200 metres of cloth is ________.
Between points c and b in Figure 2-4,the opportunity cost of 200 metres of cloth is ________.
Unlock Deck
Unlock for access to all 137 flashcards in this deck.
Unlock Deck
k this deck
44
Figure 2-4
In Figure 2-4,the bowed-out shape of the production possibilities curve indicates that
A)resources are being used efficiently.
B)resources are being used inefficiently.
C)production is efficient but the economy is experiencing allocative inefficiency.
D)some resources are relatively better at producing corn and others are better at producing cloth.
Unlock Deck
Unlock for access to all 137 flashcards in this deck.
Unlock Deck
k this deck
45
The law of increasing relative cost states that
A)producing additional units of one good results in increasing amounts of lost output of the other.
B)producing additional units of one good results in proportionately smaller reductions in output of the other.
C)the economy will be producing on its production possibilities curve.
D)the production possibilities curve will be a straight line.
Unlock Deck
Unlock for access to all 137 flashcards in this deck.
Unlock Deck
k this deck
46
Increasing opportunity cost implies that
A)producing additional units of one good results in increasing amounts of lost output of the other.
B)producing additional units of one good results in proportionately smaller reductions in the other.
C)the society will be producing on its production possibilities curve.
D)the production possibilities curve will be a straight line.
Unlock Deck
Unlock for access to all 137 flashcards in this deck.
Unlock Deck
k this deck
47
A production possibilities curve bowed outward is consistent with
A)highly specialized resources.
B)a technologically inefficient society.
C)constant opportunity cost.
D)the under-utilization of productive resources.
A)highly specialized resources.
B)a technologically inefficient society.
C)constant opportunity cost.
D)the under-utilization of productive resources.
Unlock Deck
Unlock for access to all 137 flashcards in this deck.
Unlock Deck
k this deck
48
Allocative efficiency is achieved when
A)a point beyond the production possibilities curve is reached.
B)technological change occurs.
C)the economy is producing on its production possibilities curve.
D)the maximum amounts of the most desired goods and services are being produced.
A)a point beyond the production possibilities curve is reached.
B)technological change occurs.
C)the economy is producing on its production possibilities curve.
D)the maximum amounts of the most desired goods and services are being produced.
Unlock Deck
Unlock for access to all 137 flashcards in this deck.
Unlock Deck
k this deck
49
Consider the following production possibilities table for drill presses and corn.The table shows the maximum combination of drills and corn that can be produced when all resources are fully employed.
Drill Presses 10 20 30 40 50
Corn 150 140 120 90 50
Based on the information in the table,
A)the opportunity cost of producing 40 drill presses instead of 30 drills is 30 corn.
B)there is a constant trade-off between corn and drill presses.
C)the production possibilities curve for drill presses and corn will be a straight line.
D)the opportunity cost of producing 30 drill presses instead of 20 drills is 120 corn.
Unlock Deck
Unlock for access to all 137 flashcards in this deck.
Unlock Deck
k this deck
50
A straight-line production possibilities curve would indicate that
A)resources are better suited for producing one output than another.
B)the opportunity cost of producing more of a good is decreasing.
C)the opportunity cost of producing a good is constant.
D)resources are fixed.
A)resources are better suited for producing one output than another.
B)the opportunity cost of producing more of a good is decreasing.
C)the opportunity cost of producing a good is constant.
D)resources are fixed.
Unlock Deck
Unlock for access to all 137 flashcards in this deck.
Unlock Deck
k this deck
51
A production possibilities curve that is bowed outward occurs when
A)successive additions of one good require greater and greater reductions in the other.
B)resources are not scarce.
C)opportunity costs are constant.
D)the society is operating on the production possibilities curve.
A)successive additions of one good require greater and greater reductions in the other.
B)resources are not scarce.
C)opportunity costs are constant.
D)the society is operating on the production possibilities curve.
Unlock Deck
Unlock for access to all 137 flashcards in this deck.
Unlock Deck
k this deck
52
Figure 2-4
In Figure 2-4,which of the following would NOT be a means by which society might move to point h?
A)an improvement in technology.
B)an increase in quantity of capital.
C)an increase in quantity of labour.
D)more efficient use of current resources.
In Figure 2-4,which of the following would NOT be a means by which society might move to point h?
A)an improvement in technology.
B)an increase in quantity of capital.
C)an increase in quantity of labour.
D)more efficient use of current resources.
Unlock Deck
Unlock for access to all 137 flashcards in this deck.
Unlock Deck
k this deck
53
Figure 2-4
Between points b and c in Figure 2-4,the (average)opportunity cost of another metre of cloth is ________.
Between points b and c in Figure 2-4,the (average)opportunity cost of another metre of cloth is ________.
Unlock Deck
Unlock for access to all 137 flashcards in this deck.
Unlock Deck
k this deck
54
Figure 2-4
In Figure 2-4,which of the following points indicates a productively inefficient use of resources?
A)f
B)g
C)a
D)h
In Figure 2-4,which of the following points indicates a productively inefficient use of resources?
A)f
B)g
C)a
D)h
Unlock Deck
Unlock for access to all 137 flashcards in this deck.
Unlock Deck
k this deck
55
Figure 2-4
In Figure 2-4,between points b and c the opportunity cost of 250 tonnes of corn is
A)250 metres of cloth.
B)400 metres of cloth.
C)600 metres of cloth.
D)200 metres of cloth.
In Figure 2-4,between points b and c the opportunity cost of 250 tonnes of corn is
A)250 metres of cloth.
B)400 metres of cloth.
C)600 metres of cloth.
D)200 metres of cloth.
Unlock Deck
Unlock for access to all 137 flashcards in this deck.
Unlock Deck
k this deck
56
If a production possibilities curve for books and magazines is a straight line,then the
A)opportunity cost of increasing book production stays constant regardless of the quantity produced.
B)opportunity cost of increasing book production continues to decline as total production increases.
C)opportunity cost of increasing book production is independent of the shape of the curve.
D)opportunity cost of increasing book production continues to increase as total production increases.
Unlock Deck
Unlock for access to all 137 flashcards in this deck.
Unlock Deck
k this deck
57
Figure 2-4
Between c and b in Figure 2-4,the opportunity cost of another tonne of corn is (on average)
A)1 metre of cloth.
B)100/125 metres of cloth.
C)100/250 metres of cloth.
D)1)25 metres of cloth.
Between c and b in Figure 2-4,the opportunity cost of another tonne of corn is (on average)
A)1 metre of cloth.
B)100/125 metres of cloth.
C)100/250 metres of cloth.
D)1)25 metres of cloth.
Unlock Deck
Unlock for access to all 137 flashcards in this deck.
Unlock Deck
k this deck
58
If opportunity costs remained constant,then
A)the production possibilities curve would bow outward.
B)the production possibilities curve would be a straight line.
C)the production possibilities curve would not exist.
D)factors of production must not be fully employed.
A)the production possibilities curve would bow outward.
B)the production possibilities curve would be a straight line.
C)the production possibilities curve would not exist.
D)factors of production must not be fully employed.
Unlock Deck
Unlock for access to all 137 flashcards in this deck.
Unlock Deck
k this deck
59
Figure 2-4
The shape of the production possibilities curve in Figure 2-4 indicates that
A)production of both corn and cloth is characterized by constant costs.
B)production of corn is characterized by constant costs and the production of cloth by increasing costs.
C)production of both corn and cloth is characterized by increasing costs.
D)production of corn is characterized by increasing costs while the production of cloth is characterized by decreasing costs.
Unlock Deck
Unlock for access to all 137 flashcards in this deck.
Unlock Deck
k this deck
60
Productive efficiency is correctly defined as
A)producing outside the production possibilities boundary.
B)providing for the immediate needs of the greatest proportion of the population.
C)minimizing opportunity cost.
D)producing the maximum output possible with given technology and resources.
A)producing outside the production possibilities boundary.
B)providing for the immediate needs of the greatest proportion of the population.
C)minimizing opportunity cost.
D)producing the maximum output possible with given technology and resources.
Unlock Deck
Unlock for access to all 137 flashcards in this deck.
Unlock Deck
k this deck
61
Capital goods
A)are a special type of consumption good.
B)enhance the enjoyment consumers obtain from other goods and services.
C)are goods used in the production of other goods including consumer goods and services.
D)lead to inward shifts of a production possibilities curve.
A)are a special type of consumption good.
B)enhance the enjoyment consumers obtain from other goods and services.
C)are goods used in the production of other goods including consumer goods and services.
D)lead to inward shifts of a production possibilities curve.
Unlock Deck
Unlock for access to all 137 flashcards in this deck.
Unlock Deck
k this deck
62
When a society forgoes current consumption to invest in the production of capital goods,
A)the less the society can consume in future.
B)the less capital the society can produce in the future.
C)the more the society can consume in the future.
D)the easier it will be for the society to consume less in the future because people will become accustomed to less.
A)the less the society can consume in future.
B)the less capital the society can produce in the future.
C)the more the society can consume in the future.
D)the easier it will be for the society to consume less in the future because people will become accustomed to less.
Unlock Deck
Unlock for access to all 137 flashcards in this deck.
Unlock Deck
k this deck
63
Economic growth can be pictured in a production possibilities curve diagram by
A)an inward shift of the production possibilities curve.
B)an outward shift of the production possibilities curve.
C)an increasingly bowed out production possibilities curve.
D)a production possibilities curve that is less bowed out.
A)an inward shift of the production possibilities curve.
B)an outward shift of the production possibilities curve.
C)an increasingly bowed out production possibilities curve.
D)a production possibilities curve that is less bowed out.
Unlock Deck
Unlock for access to all 137 flashcards in this deck.
Unlock Deck
k this deck
64
A country that must reduce current consumption if it wished to increase future consumption possibilities
A)must be producing along its production possibilities curve.
B)must be producing outside the production possibilities curve.
C)must be allocating resources inefficiently.
D)must not have private ownership of property.
A)must be producing along its production possibilities curve.
B)must be producing outside the production possibilities curve.
C)must be allocating resources inefficiently.
D)must not have private ownership of property.
Unlock Deck
Unlock for access to all 137 flashcards in this deck.
Unlock Deck
k this deck
65
In general,specialization allows
A)constant opportunity costs.
B)greater self-reliance.
C)the production of fewer capital goods.
D)greater productivity.
A)constant opportunity costs.
B)greater self-reliance.
C)the production of fewer capital goods.
D)greater productivity.
Unlock Deck
Unlock for access to all 137 flashcards in this deck.
Unlock Deck
k this deck
66
If you are able to earn $20,000 a year teaching,$25,000 a year typing,$30,000 a year driving a cab,and $40,000 a year as a chef,you have a comparative advantage in ________.
Unlock Deck
Unlock for access to all 137 flashcards in this deck.
Unlock Deck
k this deck
67
Comparative advantage is always a(n)________ concept.
A)relative
B)engineering
C)monetary
D)absolute
A)relative
B)engineering
C)monetary
D)absolute
Unlock Deck
Unlock for access to all 137 flashcards in this deck.
Unlock Deck
k this deck
68
Increasing relative costs are the result of
A)high taxes.
B)increasing scarcity.
C)the fact that resources are not perfectly adaptable for alternative uses.
D)the fact that the more society produces,the more difficult it is to use resources efficiently.
A)high taxes.
B)increasing scarcity.
C)the fact that resources are not perfectly adaptable for alternative uses.
D)the fact that the more society produces,the more difficult it is to use resources efficiently.
Unlock Deck
Unlock for access to all 137 flashcards in this deck.
Unlock Deck
k this deck
69
The organization of productive activities among persons and regions so that no one individual or area is totally self-sufficient is known as
A)comparative value.
B)advantage-taking.
C)specialization.
D)out-sourcing.
A)comparative value.
B)advantage-taking.
C)specialization.
D)out-sourcing.
Unlock Deck
Unlock for access to all 137 flashcards in this deck.
Unlock Deck
k this deck
70
A person has a comparative advantage in an activity whenever she
A)can perform the activity at a lower opportunity cost than another person.
B)can do everything better than anyone else.
C)has an absolute advantage in that activity.
D)can do the activity in less time than anyone else.
A)can perform the activity at a lower opportunity cost than another person.
B)can do everything better than anyone else.
C)has an absolute advantage in that activity.
D)can do the activity in less time than anyone else.
Unlock Deck
Unlock for access to all 137 flashcards in this deck.
Unlock Deck
k this deck
71
The opportunity cost of producing more capital goods today is
A)fewer consumer goods today.
B)fewer capital goods in the future.
C)more unemployed resources in the future.
D)fewer consumer goods in the future.
A)fewer consumer goods today.
B)fewer capital goods in the future.
C)more unemployed resources in the future.
D)fewer consumer goods in the future.
Unlock Deck
Unlock for access to all 137 flashcards in this deck.
Unlock Deck
k this deck
72
If a country increases the production of its capital goods,then
A)the more consumption of goods it can have today.
B)the less consumption it can have today,but the more it can have in future.
C)the more unemployed resources there will be in the future.
D)the more unemployed resources there are today.
A)the more consumption of goods it can have today.
B)the less consumption it can have today,but the more it can have in future.
C)the more unemployed resources there will be in the future.
D)the more unemployed resources there are today.
Unlock Deck
Unlock for access to all 137 flashcards in this deck.
Unlock Deck
k this deck
73
Suppose a hectare of land yields 100 tonnes of corn and that one tonne of corn provides enough seed for one-quarter of a hectare of land.The opportunity cost of consuming another tonne of corn today is
A)25 tonnes of corn next year.
B)10 tonnes of corn next year.
C)100 tonnes of corn next year.
D)2)5 tonnes of corn next year.
A)25 tonnes of corn next year.
B)10 tonnes of corn next year.
C)100 tonnes of corn next year.
D)2)5 tonnes of corn next year.
Unlock Deck
Unlock for access to all 137 flashcards in this deck.
Unlock Deck
k this deck
74
Economy A and Economy B have the same resources,but workers in Economy A have specialized whereas individuals in Economy B have not.Given this information,you can determine that
A)Economy A will have a lower output than Economy B.
B)Economy A will have a higher output than Economy B.
C)Individuals in Economy A will have lower incomes than individuals in Economy B.
D)Economy A and Economy B will have identical outputs.
A)Economy A will have a lower output than Economy B.
B)Economy A will have a higher output than Economy B.
C)Individuals in Economy A will have lower incomes than individuals in Economy B.
D)Economy A and Economy B will have identical outputs.
Unlock Deck
Unlock for access to all 137 flashcards in this deck.
Unlock Deck
k this deck
75
The more goods and services a society consumes today,
A)the more it will be able to consume in the future.
B)the harder it will be to reduce consumption in the future because people will find it difficult to accept having less.
C)the less it can consume in the future.
D)the easier it will be to consume less in the future.
A)the more it will be able to consume in the future.
B)the harder it will be to reduce consumption in the future because people will find it difficult to accept having less.
C)the less it can consume in the future.
D)the easier it will be to consume less in the future.
Unlock Deck
Unlock for access to all 137 flashcards in this deck.
Unlock Deck
k this deck
76
If individual X has a comparative advantage in painting fences and individual Y has a comparative advantage in carpentry,we know that
A)individual X would use fewer hours to paint a fence than individual Y.
B)individual Y is a better carpenter than X.
C)we cannot tell whether specialization should occur without information on each person's absolute advantage.
D)there is a lower opportunity cost (expressed in units of carpentry)for individual X to paint than for individual Y to paint.
Unlock Deck
Unlock for access to all 137 flashcards in this deck.
Unlock Deck
k this deck
77
If a country's production possibilities curve gets more bowed out over time,we know that
A)resources have become more highly specialized.
B)society is learning to use its resources more efficiently.
C)the quantity of labour and capital have increased.
D)technological change has taken place.
A)resources have become more highly specialized.
B)society is learning to use its resources more efficiently.
C)the quantity of labour and capital have increased.
D)technological change has taken place.
Unlock Deck
Unlock for access to all 137 flashcards in this deck.
Unlock Deck
k this deck
78
A production possibilities curve that is bowed outward indicates that
A)additional units of output of one good necessitate increased reductions in the other good as more and more of the first is produced.
B)resources are scarce.
C)opportunity costs are constant.
D)the society is operating on the production possibilities curve.
A)additional units of output of one good necessitate increased reductions in the other good as more and more of the first is produced.
B)resources are scarce.
C)opportunity costs are constant.
D)the society is operating on the production possibilities curve.
Unlock Deck
Unlock for access to all 137 flashcards in this deck.
Unlock Deck
k this deck
79
If all resources are perfectly adaptable for alternative uses,the production possibilities curve will
A)be a straight line.
B)be bowed in.
C)be bowed out.
D)not exist.
A)be a straight line.
B)be bowed in.
C)be bowed out.
D)not exist.
Unlock Deck
Unlock for access to all 137 flashcards in this deck.
Unlock Deck
k this deck
80
The principle of comparative advantage implies that it is desirable to choose the activity that
A)is inside the production possibilities frontier.
B)does not demand any specialization.
C)has the lowest opportunity cost.
D)has a high opportunity cost.
A)is inside the production possibilities frontier.
B)does not demand any specialization.
C)has the lowest opportunity cost.
D)has a high opportunity cost.
Unlock Deck
Unlock for access to all 137 flashcards in this deck.
Unlock Deck
k this deck
Unlock Deck
Unlock for access to all 137 flashcards in this deck.


