Deck 12: Financial Statement Analysis
Full screen (f)
Question
Question
Question
Question
Question
Question
Question
Question
Question
Question
Question
Question
Question
Question
Question
Question
Question
Question
Question
Question
Question
Question
Question
Question
Question
Question
Question
Question
Question
Nekich Company reports the following sales figures(in millions): 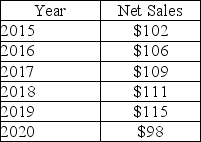 What is the trend percentage in 2020 if 2015 is the base year? (Round your final answer to the nearest whole percentage)
A)92%
B)88%
C)85%
D)96%
What is the trend percentage in 2020 if 2015 is the base year? (Round your final answer to the nearest whole percentage)A)92%
B)88%
C)85%
D)96%
Question
Question
Question
Question
Goelzer Company reports the following trend percentages for net income: 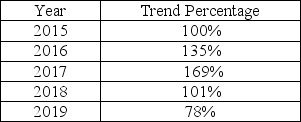 Given the above data,which statement is FALSE assuming 2015 is the base year?
A)When compared to 2017,net income is falling in 2018.
B)Net income is increasing in 2016 and 2017.
C)Net income is lower in 2019 than in 2015.
D)Net income is higher in 2019 than in 2015.
Given the above data,which statement is FALSE assuming 2015 is the base year?A)When compared to 2017,net income is falling in 2018.
B)Net income is increasing in 2016 and 2017.
C)Net income is lower in 2019 than in 2015.
D)Net income is higher in 2019 than in 2015.
Question
Zebra Company reports the following figures for the years ending December 31,2019 and 2018: 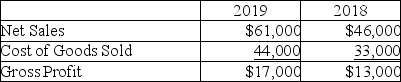 What are the percentage changes from 2018 to 2019 for Net Sales,Cost of Goods Sold and Gross Profit,respectively? (Round your final answers to one decimal place,X.X%)
A)100%,30.8%,33.3%
B)100%,0.8%,0.8%
C)30.8%,32.6%,33.3%
D)32.6%,33.3%,30.8%
What are the percentage changes from 2018 to 2019 for Net Sales,Cost of Goods Sold and Gross Profit,respectively? (Round your final answers to one decimal place,X.X%)A)100%,30.8%,33.3%
B)100%,0.8%,0.8%
C)30.8%,32.6%,33.3%
D)32.6%,33.3%,30.8%
Question
Bryanwood Company reports the following data: 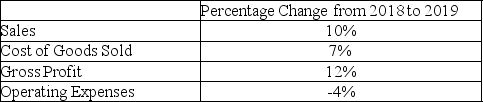 Based on the above information,what can be said about the company's business strategy?
A)The company has lost control of operating expenses.
B)The company has reduced cost of goods sold in total dollar amount.
C)The company has successfully undertaken some cost-cutting measures for operating expenses.
D)The company has fewer sales in 2019 than 2018.
Based on the above information,what can be said about the company's business strategy?A)The company has lost control of operating expenses.
B)The company has reduced cost of goods sold in total dollar amount.
C)The company has successfully undertaken some cost-cutting measures for operating expenses.
D)The company has fewer sales in 2019 than 2018.
Question
Question
For the period from 2019 to 2020,a company reports the following: 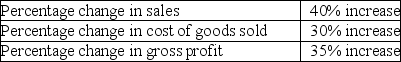 If sales are $8,000,000 in 2019,what are sales in 2020?
A)$3,200,000
B)$8,000,000
C)$10,800,000
D)$11,200,000
If sales are $8,000,000 in 2019,what are sales in 2020?A)$3,200,000
B)$8,000,000
C)$10,800,000
D)$11,200,000
Question
Goelzer Company reports the following information for 2020 and 2021.Calculate the amount and percentage of increase or decrease for each financial statement line item doing a horizontal analysis.Use one decimal place for percentages.
Question
Question
Zemanowski Company reports the following sales figures (in millions): 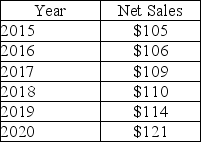 What is the trend percentage in 2017 if 2015 is the base year? (Round your final answer to the nearest whole percentage)
A)109%
B)101%
C)104%
D)105%
What is the trend percentage in 2017 if 2015 is the base year? (Round your final answer to the nearest whole percentage)A)109%
B)101%
C)104%
D)105%
Question
Question
Question
Question
Question
Question
Question
Question
Question
Question
Question
Question
Szidon Company reports the following data: 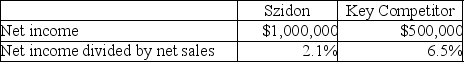 Using benchmarking,what can be said about Szidon Company?
A)Szidon is inferior to the key competitor because the key competitor's net income percentage is higher.
B)Szidon is superior to the key competitor because net income is higher.
C)There is not enough information to make any conclusions.
D)There is conflicting information so no conclusions can be reached.
Using benchmarking,what can be said about Szidon Company?A)Szidon is inferior to the key competitor because the key competitor's net income percentage is higher.
B)Szidon is superior to the key competitor because net income is higher.
C)There is not enough information to make any conclusions.
D)There is conflicting information so no conclusions can be reached.
Question
Question
Question
Question
Question
Mussa Corporation reports the following data: 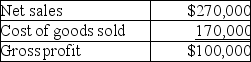 In vertical analysis,the cost of goods sold percentage is closest to: (Round your final answer to the nearest whole percentage)
A)37%.
B)59%.
C)63%.
D)170%.
In vertical analysis,the cost of goods sold percentage is closest to: (Round your final answer to the nearest whole percentage)A)37%.
B)59%.
C)63%.
D)170%.
Question
Question
Question
Question
Question
Question
Question
Question
Question
Given the following data: 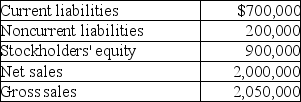 In vertical analysis,current liabilities would be expressed as: (Round your final answer to the nearest whole percent. )
A)35%.
B)39%.
C)34%.
D)50%.
In vertical analysis,current liabilities would be expressed as: (Round your final answer to the nearest whole percent. )A)35%.
B)39%.
C)34%.
D)50%.
Question
Prepare a vertical analysis for Katrina Corporation using the information shown below.Round percentages to one decimal place.

Question
Question
Question
Given the following data: 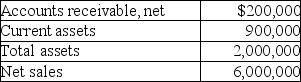 In vertical analysis,Accounts Receivable,net would be expressed as: (Round your final answer to the nearest whole percent)
A)3%.
B)33%.
C)10%.
D)22%.
In vertical analysis,Accounts Receivable,net would be expressed as: (Round your final answer to the nearest whole percent)A)3%.
B)33%.
C)10%.
D)22%.
Question
Hull Company reports the following data: 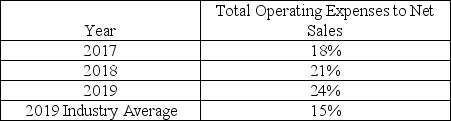 Based on the above data,what can be said about the Hull Company?
A)The company is controlling operating expenses.
B)The company is doing better than the industry average.
C)The company is losing control of operating expenses.
D)The company is increasing sales over time.
Based on the above data,what can be said about the Hull Company?A)The company is controlling operating expenses.
B)The company is doing better than the industry average.
C)The company is losing control of operating expenses.
D)The company is increasing sales over time.
Question
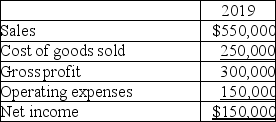
Given the following data: 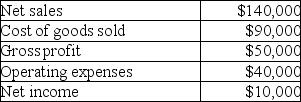 In vertical analysis,net income would be expressed as: (Round your final answer to the nearest whole percent)
A)7%.
B)36%.
C)64%.
D)29%.
In vertical analysis,net income would be expressed as: (Round your final answer to the nearest whole percent)A)7%.
B)36%.
C)64%.
D)29%.
Question
Reimer Company reports the following data: 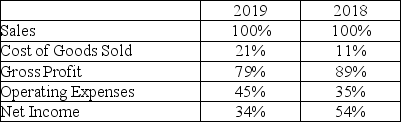 When evaluating the results of operations,what can be said about Reimer Company?
A)Using vertical analysis,the company's profitability declined in 2018.
B)Using horizontal analysis,the company's profitability declined in 2018.
C)Using vertical analysis,the company's profitability declined in 2019.
D)Using horizontal analysis,the company's profitability declined in 2019.
When evaluating the results of operations,what can be said about Reimer Company?A)Using vertical analysis,the company's profitability declined in 2018.
B)Using horizontal analysis,the company's profitability declined in 2018.
C)Using vertical analysis,the company's profitability declined in 2019.
D)Using horizontal analysis,the company's profitability declined in 2019.
Question
Wilhelm Company's gross profit percentages for the past 3 years are: 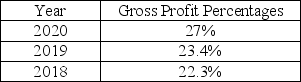 Based on the above data,what can be said about the Wilhelm Company?
A)The sales volume is decreasing.
B)The company is decreasing the income tax expense.
C)The company is controlling operating expenses.
D)The company is controlling cost of goods sold.
Based on the above data,what can be said about the Wilhelm Company?A)The sales volume is decreasing.
B)The company is decreasing the income tax expense.
C)The company is controlling operating expenses.
D)The company is controlling cost of goods sold.
Question
Dynasty Incorporated has the following data available at December 31,2019:
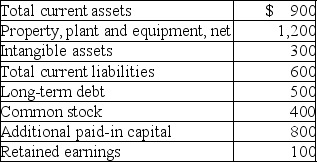 Prepare a balance sheet with vertical analysis of for Dynasty.Round percentages to one decimal place.
Prepare a balance sheet with vertical analysis of for Dynasty.Round percentages to one decimal place. Question
Question
Question
Question
Question

Unlock Deck
Sign up to unlock the cards in this deck!
Unlock Deck
Unlock Deck
1/120
Play
Full screen (f)
Deck 12: Financial Statement Analysis
1
The percentage change in a financial statement line item over two years is computed by dividing the dollar amount of the line item in the most recent year by the prior year dollar amount of the line item.
False
2
Horizontal analysis highlights changes in financial statement line items over time and provides a complete picture of a business.
False
3
Steadily increasing income from operations means that a company is growing its revenues but not controlling its costs,which usually signals expansion and growth in the business's value in future years.
False
4
A thorough analysis of a company begins with understanding a company's business and industry.
Unlock Deck
Unlock for access to all 120 flashcards in this deck.
Unlock Deck
k this deck
5
Horizontal analysis compares a financial statement line item in the current year with the same line item in the prior year.
Unlock Deck
Unlock for access to all 120 flashcards in this deck.
Unlock Deck
k this deck
6
If a company has sales of $250 in 2019 and $225 in 2020,the percentage decrease from 2019 to 2020 is 10%.
Unlock Deck
Unlock for access to all 120 flashcards in this deck.
Unlock Deck
k this deck
7
Accounting data should paint a picture of the results of implementing a particular business strategy by a company.
Unlock Deck
Unlock for access to all 120 flashcards in this deck.
Unlock Deck
k this deck
8
Trend percentages are a form of horizontal analysis.
Unlock Deck
Unlock for access to all 120 flashcards in this deck.
Unlock Deck
k this deck
9
If a company has sales of $150 in 2018 and $225 in 2019,the percentage change from 2018 to 2019 is 50%.
Unlock Deck
Unlock for access to all 120 flashcards in this deck.
Unlock Deck
k this deck
10
An annual report is filed by every public company with the:
A)FASB.
B)SEC.
C)U.S.Treasury department.
D)An annual report is not filed.
A)FASB.
B)SEC.
C)U.S.Treasury department.
D)An annual report is not filed.
Unlock Deck
Unlock for access to all 120 flashcards in this deck.
Unlock Deck
k this deck
11
Trend percentages are a form of horizontal analysis that are computed only for balance sheet items.
Unlock Deck
Unlock for access to all 120 flashcards in this deck.
Unlock Deck
k this deck
12
Declining income from operations indicates a slowdown in business activity.
Unlock Deck
Unlock for access to all 120 flashcards in this deck.
Unlock Deck
k this deck
13
Trend analysis using income statement data is widely used for predicting the future.
Unlock Deck
Unlock for access to all 120 flashcards in this deck.
Unlock Deck
k this deck
14
Learning about what's happening in the industry,markets,general economic conditions,trends in product development,and specific company strategies puts a company's numbers in context and helps you understand why they turned out as they did.
Unlock Deck
Unlock for access to all 120 flashcards in this deck.
Unlock Deck
k this deck
15
Every public company's annual report filed begins with the income statement.
Unlock Deck
Unlock for access to all 120 flashcards in this deck.
Unlock Deck
k this deck
16
The description section of a company's business in an annual report does NOT generally include information about:
A)income taxes.
B)the company's products.
C)sales and distribution strategies.
D)product design and development.
A)income taxes.
B)the company's products.
C)sales and distribution strategies.
D)product design and development.
Unlock Deck
Unlock for access to all 120 flashcards in this deck.
Unlock Deck
k this deck
17
In the Management's Discussion and Analysis section of the annual report,you will find management's explanation for trends in sales.
Unlock Deck
Unlock for access to all 120 flashcards in this deck.
Unlock Deck
k this deck
18
Financial analysis involves more than just looking at financial reports and doing some math.
Unlock Deck
Unlock for access to all 120 flashcards in this deck.
Unlock Deck
k this deck
19
A company's business section of the annual report provides vital information about the company's products,its marketing and promotion,sales and distribution strategies,product design and development,manufacturing and quality assurance,and inventory management.
Unlock Deck
Unlock for access to all 120 flashcards in this deck.
Unlock Deck
k this deck
20
MD&A stands for:
A)Management's Discussion and Analysis.
B)Management's Decisions and Analysis.
C)Marketing Discussion and Analysis.
D)Marketing Decisions and Analysis.
A)Management's Discussion and Analysis.
B)Management's Decisions and Analysis.
C)Marketing Discussion and Analysis.
D)Marketing Decisions and Analysis.
Unlock Deck
Unlock for access to all 120 flashcards in this deck.
Unlock Deck
k this deck
21
The ratio of the dollar amount of each individual asset to the dollar amount of total assets is an example of vertical analysis.
Unlock Deck
Unlock for access to all 120 flashcards in this deck.
Unlock Deck
k this deck
22
When computing trend percentages:
A)the current year is always equal to 100%.
B)the base year is always the current year.
C)the base year is always equal to 100%.
D)the base year is equal to the current year plus the previous year divided by two.
A)the current year is always equal to 100%.
B)the base year is always the current year.
C)the base year is always equal to 100%.
D)the base year is equal to the current year plus the previous year divided by two.
Unlock Deck
Unlock for access to all 120 flashcards in this deck.
Unlock Deck
k this deck
23
A type of analysis that indicates the direction a business is taking is:
A)benchmarking.
B)current ratio.
C)vertical analysis.
D)trend percentages.
A)benchmarking.
B)current ratio.
C)vertical analysis.
D)trend percentages.
Unlock Deck
Unlock for access to all 120 flashcards in this deck.
Unlock Deck
k this deck
24
Vertical analysis compares a line item on the balance sheet,in a current period,to the same line item on the balance sheet in a prior period.
Unlock Deck
Unlock for access to all 120 flashcards in this deck.
Unlock Deck
k this deck
25
How is the trend percentage for sales in 2019 computed? The base year is 2012.
A)Year 2019 sales ÷ Year 2012 sales
B)(Year 2019 sales - Year 2012 sales)÷ Year 2012 sales
C)(Year 2019 sales - Year 2012 sales)÷ Year 2019 sales
D)(Year 2019 sales ÷ Year 2012 sales)× 100
A)Year 2019 sales ÷ Year 2012 sales
B)(Year 2019 sales - Year 2012 sales)÷ Year 2012 sales
C)(Year 2019 sales - Year 2012 sales)÷ Year 2019 sales
D)(Year 2019 sales ÷ Year 2012 sales)× 100
Unlock Deck
Unlock for access to all 120 flashcards in this deck.
Unlock Deck
k this deck
26
The formula for the percentage change in a financial statement line item is the current year amount:
A)divided by the base year amount.
B)minus the base year amount divided by the base year amount.
C)minus the base year amount divided by current year amount.
D)added to the base year amount divided by the base year amount.
A)divided by the base year amount.
B)minus the base year amount divided by the base year amount.
C)minus the base year amount divided by current year amount.
D)added to the base year amount divided by the base year amount.
Unlock Deck
Unlock for access to all 120 flashcards in this deck.
Unlock Deck
k this deck
27
Horizontal analysis is most closely related to:
A)trend analysis.
B)current ratio.
C)vertical analysis.
D)benchmarking.
A)trend analysis.
B)current ratio.
C)vertical analysis.
D)benchmarking.
Unlock Deck
Unlock for access to all 120 flashcards in this deck.
Unlock Deck
k this deck
28
Year to year percentage changes in line items from comparative financial statements is called:
A)benchmarking.
B)horizontal analysis.
C)vertical analysis.
D)common-size financial statements.
A)benchmarking.
B)horizontal analysis.
C)vertical analysis.
D)common-size financial statements.
Unlock Deck
Unlock for access to all 120 flashcards in this deck.
Unlock Deck
k this deck
29
Nekich Company reports the following sales figures(in millions): What is the trend percentage in 2020 if 2015 is the base year? (Round your final answer to the nearest whole percentage)
A)92%
B)88%
C)85%
D)96%
What is the trend percentage in 2020 if 2015 is the base year? (Round your final answer to the nearest whole percentage)A)92%
B)88%
C)85%
D)96%
Unlock Deck
Unlock for access to all 120 flashcards in this deck.
Unlock Deck
k this deck
30
The primary focus of horizontal analysis is:
A)percentage changes in line items from comparative financial statements.
B)the balance sheet only.
C)the amount of individual financial statement line items as a percentage of some related total,such as total assets.
D)the income statement only.
A)percentage changes in line items from comparative financial statements.
B)the balance sheet only.
C)the amount of individual financial statement line items as a percentage of some related total,such as total assets.
D)the income statement only.
Unlock Deck
Unlock for access to all 120 flashcards in this deck.
Unlock Deck
k this deck
31
When comparing companies of different sizes,vertical analysis is a useful tool.
Unlock Deck
Unlock for access to all 120 flashcards in this deck.
Unlock Deck
k this deck
32
How is the percentage change (for horizontal analysis)for sales from 2018 to 2019 computed?
A)Year 2019 sales ÷ Year 2018 sales
B)(Year 2019 sales - Year 2018 sales)÷ Year 2018 sales
C)(Year 2019 sales - Year 2018 sales)÷ Year 2019 sales
D)(Year 2019 sales ÷ Year 2018 sales)× 100
A)Year 2019 sales ÷ Year 2018 sales
B)(Year 2019 sales - Year 2018 sales)÷ Year 2018 sales
C)(Year 2019 sales - Year 2018 sales)÷ Year 2019 sales
D)(Year 2019 sales ÷ Year 2018 sales)× 100
Unlock Deck
Unlock for access to all 120 flashcards in this deck.
Unlock Deck
k this deck
33
Goelzer Company reports the following trend percentages for net income: Given the above data,which statement is FALSE assuming 2015 is the base year?
A)When compared to 2017,net income is falling in 2018.
B)Net income is increasing in 2016 and 2017.
C)Net income is lower in 2019 than in 2015.
D)Net income is higher in 2019 than in 2015.
Given the above data,which statement is FALSE assuming 2015 is the base year?A)When compared to 2017,net income is falling in 2018.
B)Net income is increasing in 2016 and 2017.
C)Net income is lower in 2019 than in 2015.
D)Net income is higher in 2019 than in 2015.
Unlock Deck
Unlock for access to all 120 flashcards in this deck.
Unlock Deck
k this deck
34
Zebra Company reports the following figures for the years ending December 31,2019 and 2018: What are the percentage changes from 2018 to 2019 for Net Sales,Cost of Goods Sold and Gross Profit,respectively? (Round your final answers to one decimal place,X.X%)
A)100%,30.8%,33.3%
B)100%,0.8%,0.8%
C)30.8%,32.6%,33.3%
D)32.6%,33.3%,30.8%
What are the percentage changes from 2018 to 2019 for Net Sales,Cost of Goods Sold and Gross Profit,respectively? (Round your final answers to one decimal place,X.X%)A)100%,30.8%,33.3%
B)100%,0.8%,0.8%
C)30.8%,32.6%,33.3%
D)32.6%,33.3%,30.8%
Unlock Deck
Unlock for access to all 120 flashcards in this deck.
Unlock Deck
k this deck
35
Bryanwood Company reports the following data: Based on the above information,what can be said about the company's business strategy?
A)The company has lost control of operating expenses.
B)The company has reduced cost of goods sold in total dollar amount.
C)The company has successfully undertaken some cost-cutting measures for operating expenses.
D)The company has fewer sales in 2019 than 2018.
Based on the above information,what can be said about the company's business strategy?A)The company has lost control of operating expenses.
B)The company has reduced cost of goods sold in total dollar amount.
C)The company has successfully undertaken some cost-cutting measures for operating expenses.
D)The company has fewer sales in 2019 than 2018.
Unlock Deck
Unlock for access to all 120 flashcards in this deck.
Unlock Deck
k this deck
36
The percentage change in any individual item shown on comparative financial statements is calculated by dividing the dollar amount of the change from the base period to the current period by:
A)the amount shown for the current period.
B)the base-period amount.
C)the average of the amounts shown for the base and the current periods.
D)the amount estimated for the future period.
A)the amount shown for the current period.
B)the base-period amount.
C)the average of the amounts shown for the base and the current periods.
D)the amount estimated for the future period.
Unlock Deck
Unlock for access to all 120 flashcards in this deck.
Unlock Deck
k this deck
37
For the period from 2019 to 2020,a company reports the following: If sales are $8,000,000 in 2019,what are sales in 2020?
A)$3,200,000
B)$8,000,000
C)$10,800,000
D)$11,200,000
If sales are $8,000,000 in 2019,what are sales in 2020?A)$3,200,000
B)$8,000,000
C)$10,800,000
D)$11,200,000
Unlock Deck
Unlock for access to all 120 flashcards in this deck.
Unlock Deck
k this deck
38
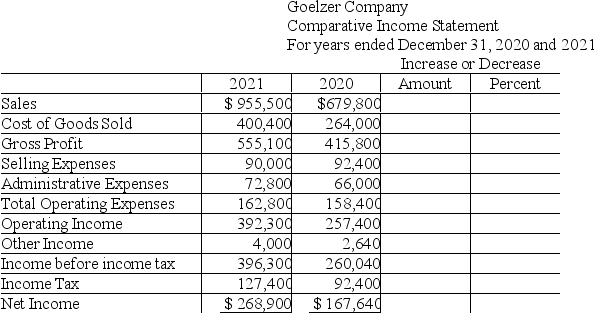
Goelzer Company reports the following information for 2020 and 2021.Calculate the amount and percentage of increase or decrease for each financial statement line item doing a horizontal analysis.Use one decimal place for percentages.
Unlock Deck
Unlock for access to all 120 flashcards in this deck.
Unlock Deck
k this deck
39
When performing a vertical analysis of the income statement,each line item is stated as a percentage of net income.
Unlock Deck
Unlock for access to all 120 flashcards in this deck.
Unlock Deck
k this deck
40
Zemanowski Company reports the following sales figures (in millions): What is the trend percentage in 2017 if 2015 is the base year? (Round your final answer to the nearest whole percentage)
A)109%
B)101%
C)104%
D)105%
What is the trend percentage in 2017 if 2015 is the base year? (Round your final answer to the nearest whole percentage)A)109%
B)101%
C)104%
D)105%
Unlock Deck
Unlock for access to all 120 flashcards in this deck.
Unlock Deck
k this deck
41
You are using a leading competitor,Company B,for benchmarking your company,Company A.When benchmarking,the gross margin of Company A is expressed as a percentage of:
A)the net sales of Companies A and B.
B)Company B's net sales.
C)Company A's net income.
D)Company A's net sales.
A)the net sales of Companies A and B.
B)Company B's net sales.
C)Company A's net income.
D)Company A's net sales.
Unlock Deck
Unlock for access to all 120 flashcards in this deck.
Unlock Deck
k this deck
42
A vertical analysis is primarily concerned with:
A)the dollar amount of the change in various financial statement line items from year to year.
B)individual financial statement line items expressed as a percentage of a base (which represents 100%).
C)percentage changes in the balances of line items from comparative financial statements.
D)the change in key financial statement ratios over a specified period of time.
Unlock Deck
Unlock for access to all 120 flashcards in this deck.
Unlock Deck
k this deck
43
A financial statement that shows each line item as a percentage of one key item on the statement is referred to as a:
A)benchmarking.
B)common-size statement.
C)horizontal analysis.
D)financial ratio analysis.
A)benchmarking.
B)common-size statement.
C)horizontal analysis.
D)financial ratio analysis.
Unlock Deck
Unlock for access to all 120 flashcards in this deck.
Unlock Deck
k this deck
44
Expressing cash and cash equivalents as a percentage of total assets is an example of:
A)horizontal analysis.
B)current ratio.
C)ratio analysis.
D)vertical analysis.
A)horizontal analysis.
B)current ratio.
C)ratio analysis.
D)vertical analysis.
Unlock Deck
Unlock for access to all 120 flashcards in this deck.
Unlock Deck
k this deck
45
Which of the following is typically used as the base in a vertical analysis of an income statement?
A)gross profit
B)operating income
C)net income
D)net sales
A)gross profit
B)operating income
C)net income
D)net sales
Unlock Deck
Unlock for access to all 120 flashcards in this deck.
Unlock Deck
k this deck
46
Benchmarking compares a company to some standard set by others.
Unlock Deck
Unlock for access to all 120 flashcards in this deck.
Unlock Deck
k this deck
47
In performing vertical analysis,the base for inventory is:
A)total stockholders' equity.
B)total assets.
C)total cash and cash equivalents.
D)total current assets.
A)total stockholders' equity.
B)total assets.
C)total cash and cash equivalents.
D)total current assets.
Unlock Deck
Unlock for access to all 120 flashcards in this deck.
Unlock Deck
k this deck
48
Common-size financial statements report only dollar amounts.
Unlock Deck
Unlock for access to all 120 flashcards in this deck.
Unlock Deck
k this deck
49
A financial statement line item expressed as a percentage of a base amount is a result of:
A)horizontal analysis.
B)economic value added.
C)vertical analysis.
D)comparative analysis.
A)horizontal analysis.
B)economic value added.
C)vertical analysis.
D)comparative analysis.
Unlock Deck
Unlock for access to all 120 flashcards in this deck.
Unlock Deck
k this deck
50
You are the CEO of Company A and you are using an industry leader (Leader Company)for benchmarking.Company A is much smaller than Leader Company in terms of total assets and total sales revenue.You should compare the:
A)gross profit of Company A to the gross profit of Leader Company.
B)net income of Company A to the net income of Leader Company.
C)net sales of Company A to the net sales of Leader Company.
D)net income to net sales ratio of Company A to net income to net sales ratio of Leader Company.
A)gross profit of Company A to the gross profit of Leader Company.
B)net income of Company A to the net income of Leader Company.
C)net sales of Company A to the net sales of Leader Company.
D)net income to net sales ratio of Company A to net income to net sales ratio of Leader Company.
Unlock Deck
Unlock for access to all 120 flashcards in this deck.
Unlock Deck
k this deck
51
A company's net income as a percentage of sales is 15%.Using vertical analysis,the cost of goods sold as a percentage of sales must be 85%.
Unlock Deck
Unlock for access to all 120 flashcards in this deck.
Unlock Deck
k this deck
52
Szidon Company reports the following data: Using benchmarking,what can be said about Szidon Company?
A)Szidon is inferior to the key competitor because the key competitor's net income percentage is higher.
B)Szidon is superior to the key competitor because net income is higher.
C)There is not enough information to make any conclusions.
D)There is conflicting information so no conclusions can be reached.
Using benchmarking,what can be said about Szidon Company?A)Szidon is inferior to the key competitor because the key competitor's net income percentage is higher.
B)Szidon is superior to the key competitor because net income is higher.
C)There is not enough information to make any conclusions.
D)There is conflicting information so no conclusions can be reached.
Unlock Deck
Unlock for access to all 120 flashcards in this deck.
Unlock Deck
k this deck
53
Walton Company's return on sales for the most recent year was 5%.The industry leader reports a return on sales of 7%.The comparison of Walton Company's return on sales to the industry leader is an example of:
A)benchmarking.
B)gross margin analysis.
C)detail analysis.
D)intercompany analysis.
A)benchmarking.
B)gross margin analysis.
C)detail analysis.
D)intercompany analysis.
Unlock Deck
Unlock for access to all 120 flashcards in this deck.
Unlock Deck
k this deck
54
Benchmarking common size variables against a key competitor provides meaningful information only if the companies are similar in size.
Unlock Deck
Unlock for access to all 120 flashcards in this deck.
Unlock Deck
k this deck
55
On a common-size income statement,income taxes expense is expressed as a percentage of:
A)net income.
B)total stockholders' equity.
C)total assets.
D)net sales.
A)net income.
B)total stockholders' equity.
C)total assets.
D)net sales.
Unlock Deck
Unlock for access to all 120 flashcards in this deck.
Unlock Deck
k this deck
56
Which of the following is typically used as the base in a vertical analysis of a balance sheet?
A)total liabilities
B)total stockholders' equity
C)total assets
D)net sales
A)total liabilities
B)total stockholders' equity
C)total assets
D)net sales
Unlock Deck
Unlock for access to all 120 flashcards in this deck.
Unlock Deck
k this deck
57
Mussa Corporation reports the following data: In vertical analysis,the cost of goods sold percentage is closest to: (Round your final answer to the nearest whole percentage)
A)37%.
B)59%.
C)63%.
D)170%.
In vertical analysis,the cost of goods sold percentage is closest to: (Round your final answer to the nearest whole percentage)A)37%.
B)59%.
C)63%.
D)170%.
Unlock Deck
Unlock for access to all 120 flashcards in this deck.
Unlock Deck
k this deck
58
On a common-size balance sheet,each line item is expressed as a percentage of:
A)current assets.
B)operating income.
C)total assets.
D)net income.
A)current assets.
B)operating income.
C)total assets.
D)net income.
Unlock Deck
Unlock for access to all 120 flashcards in this deck.
Unlock Deck
k this deck
59
In vertical analysis:
A)a base amount is optional.
B)a base amount is required.
C)line items from balance sheets are examined only.
D)line items from income statements are examined only.
A)a base amount is optional.
B)a base amount is required.
C)line items from balance sheets are examined only.
D)line items from income statements are examined only.
Unlock Deck
Unlock for access to all 120 flashcards in this deck.
Unlock Deck
k this deck
60
Which of the following would be most helpful in the comparison of different size companies?
A)horizontal analysis
B)comparison of their net incomes
C)comparison of their working capital balances
D)preparation of common-size financial statements
A)horizontal analysis
B)comparison of their net incomes
C)comparison of their working capital balances
D)preparation of common-size financial statements
Unlock Deck
Unlock for access to all 120 flashcards in this deck.
Unlock Deck
k this deck
61
In performing vertical analysis,the base for income before taxes is:
A)net income.
B)gross sales.
C)gross profit.
D)net sales.
A)net income.
B)gross sales.
C)gross profit.
D)net sales.
Unlock Deck
Unlock for access to all 120 flashcards in this deck.
Unlock Deck
k this deck
62
Cash,short-term investments and net current receivables are all components of the numerator of the quick ratio.
Unlock Deck
Unlock for access to all 120 flashcards in this deck.
Unlock Deck
k this deck
63
In performing vertical analysis,the base for income tax expense is:
A)net sales.
B)gross revenues.
C)net income.
D)gross profit.
A)net sales.
B)gross revenues.
C)net income.
D)gross profit.
Unlock Deck
Unlock for access to all 120 flashcards in this deck.
Unlock Deck
k this deck
64
A company's debt ratio is computed as total assets minus total liabilities divided by total assets.
Unlock Deck
Unlock for access to all 120 flashcards in this deck.
Unlock Deck
k this deck
65
A vertical analysis of a balance sheet shows that current assets have increased from 42% to 56%.This means that:
A)current assets have increased as a percentage of total assets.
B)the dollar amount of total assets has increased.
C)the dollar amount of total assets has decreased.
D)the dollar amount of long-term assets has increased.
A)current assets have increased as a percentage of total assets.
B)the dollar amount of total assets has increased.
C)the dollar amount of total assets has decreased.
D)the dollar amount of long-term assets has increased.
Unlock Deck
Unlock for access to all 120 flashcards in this deck.
Unlock Deck
k this deck
66
Given the following data: In vertical analysis,current liabilities would be expressed as: (Round your final answer to the nearest whole percent. )
A)35%.
B)39%.
C)34%.
D)50%.
In vertical analysis,current liabilities would be expressed as: (Round your final answer to the nearest whole percent. )A)35%.
B)39%.
C)34%.
D)50%.
Unlock Deck
Unlock for access to all 120 flashcards in this deck.
Unlock Deck
k this deck
67
Prepare a vertical analysis for Katrina Corporation using the information shown below.Round percentages to one decimal place.
Unlock Deck
Unlock for access to all 120 flashcards in this deck.
Unlock Deck
k this deck
68
A firm's ability to pay current liabilities can be evaluated using the quick ratio and the current ratio.
Unlock Deck
Unlock for access to all 120 flashcards in this deck.
Unlock Deck
k this deck
69
In performing vertical analysis,the base for operating expenses is:
A)net sales.
B)gross profit.
C)net income.
D)operating income.
A)net sales.
B)gross profit.
C)net income.
D)operating income.
Unlock Deck
Unlock for access to all 120 flashcards in this deck.
Unlock Deck
k this deck
70
Given the following data: In vertical analysis,Accounts Receivable,net would be expressed as: (Round your final answer to the nearest whole percent)
A)3%.
B)33%.
C)10%.
D)22%.
In vertical analysis,Accounts Receivable,net would be expressed as: (Round your final answer to the nearest whole percent)A)3%.
B)33%.
C)10%.
D)22%.
Unlock Deck
Unlock for access to all 120 flashcards in this deck.
Unlock Deck
k this deck
71
Hull Company reports the following data: Based on the above data,what can be said about the Hull Company?
A)The company is controlling operating expenses.
B)The company is doing better than the industry average.
C)The company is losing control of operating expenses.
D)The company is increasing sales over time.
Based on the above data,what can be said about the Hull Company?A)The company is controlling operating expenses.
B)The company is doing better than the industry average.
C)The company is losing control of operating expenses.
D)The company is increasing sales over time.
Unlock Deck
Unlock for access to all 120 flashcards in this deck.
Unlock Deck
k this deck
72
Given the following data: In vertical analysis,net income would be expressed as: (Round your final answer to the nearest whole percent)
A)7%.
B)36%.
C)64%.
D)29%.
In vertical analysis,net income would be expressed as: (Round your final answer to the nearest whole percent)A)7%.
B)36%.
C)64%.
D)29%.
Unlock Deck
Unlock for access to all 120 flashcards in this deck.
Unlock Deck
k this deck
73
Reimer Company reports the following data: When evaluating the results of operations,what can be said about Reimer Company?
A)Using vertical analysis,the company's profitability declined in 2018.
B)Using horizontal analysis,the company's profitability declined in 2018.
C)Using vertical analysis,the company's profitability declined in 2019.
D)Using horizontal analysis,the company's profitability declined in 2019.
When evaluating the results of operations,what can be said about Reimer Company?A)Using vertical analysis,the company's profitability declined in 2018.
B)Using horizontal analysis,the company's profitability declined in 2018.
C)Using vertical analysis,the company's profitability declined in 2019.
D)Using horizontal analysis,the company's profitability declined in 2019.
Unlock Deck
Unlock for access to all 120 flashcards in this deck.
Unlock Deck
k this deck
74
Wilhelm Company's gross profit percentages for the past 3 years are: Based on the above data,what can be said about the Wilhelm Company?
A)The sales volume is decreasing.
B)The company is decreasing the income tax expense.
C)The company is controlling operating expenses.
D)The company is controlling cost of goods sold.
Based on the above data,what can be said about the Wilhelm Company?A)The sales volume is decreasing.
B)The company is decreasing the income tax expense.
C)The company is controlling operating expenses.
D)The company is controlling cost of goods sold.
Unlock Deck
Unlock for access to all 120 flashcards in this deck.
Unlock Deck
k this deck
75
Dynasty Incorporated has the following data available at December 31,2019:
Prepare a balance sheet with vertical analysis of for Dynasty.Round percentages to one decimal place.
Prepare a balance sheet with vertical analysis of for Dynasty.Round percentages to one decimal place. Unlock Deck
Unlock for access to all 120 flashcards in this deck.
Unlock Deck
k this deck
76
In 2018,the Zenon Company reported that property,plant and equipment were equal to 12% of total assets.In 2018,current assets were equal to 88% of total assets.In 2019 the company reported that property,plant and equipment were equal to 28% of total assets.In 2019,current assets were equal to 72% of total assets.What conclusion can be reached from this information?
A)In 2019,the company is downsizing.
B)In 2019,property,plant and equipment as a proportion of total assets increased.
C)In 2019,the company is investing in the future.
D)B and C.
A)In 2019,the company is downsizing.
B)In 2019,property,plant and equipment as a proportion of total assets increased.
C)In 2019,the company is investing in the future.
D)B and C.
Unlock Deck
Unlock for access to all 120 flashcards in this deck.
Unlock Deck
k this deck
77
A high inventory turnover may indicate that a company is experiencing difficulty selling its inventory.
Unlock Deck
Unlock for access to all 120 flashcards in this deck.
Unlock Deck
k this deck
78
In general,the larger the working capital,the better the ability to pay debts.
Unlock Deck
Unlock for access to all 120 flashcards in this deck.
Unlock Deck
k this deck
79
The quick ratio reflects the company's percentage of total assets financed with debt.
Unlock Deck
Unlock for access to all 120 flashcards in this deck.
Unlock Deck
k this deck
80
Inventory turnover is calculated by dividing the cost of goods sold by the average inventory.
Unlock Deck
Unlock for access to all 120 flashcards in this deck.
Unlock Deck
k this deck
Unlock Deck
Unlock for access to all 120 flashcards in this deck.


