Deck 4: Human Populations- One Child China Grows Up: a Country Faces the Outcomes of Radical Population Control
Full screen (f)
Question
Question
Question
Question
Question
Question
Question
Question
Question
Question
Question
Question
Infographic 4.1.
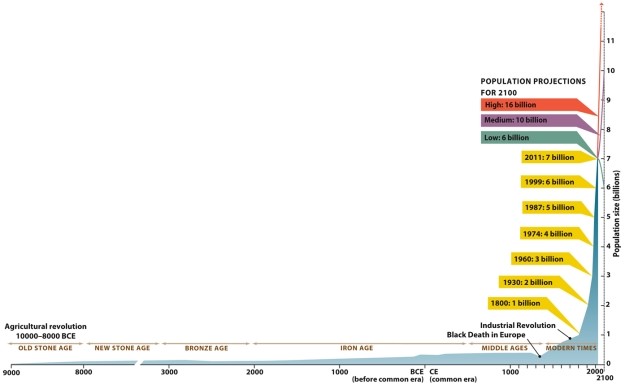
Refer to Infographic 4.1. As an emergency food supply in World War II, 20 reindeer were taken to an island in the Pacific, along with troops stationed there. Shortly thereafter, the war ended and the troops returned home, leaving the reindeer behind. After 10 years, the population of reindeer had increased to 6,000. However, with no predators and limited food and space available on the island, the population crashed, with no reindeer remaining after 10 more years. Describe what lessons can be learned from this as it applies to human populations on Earth.
Question
Question
Question
Question
Question
Question
Question
Question
Question
Question
Question
Question
Question
Question
Question
Question
Question
Question
Question
Question
Infographic 4.3.
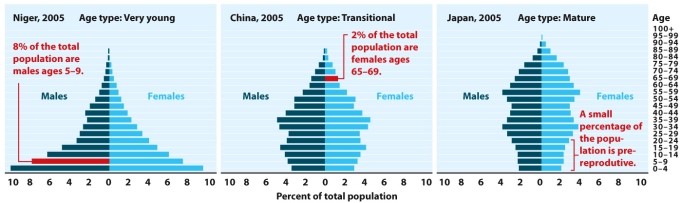
Refer to Infographic 4.3. Looking at these three age structure diagrams, explain which country will be experiencing rapid population growth during the next two decades.
Refer to Infographic 4.3. Looking at these three age structure diagrams, explain which country will be experiencing rapid population growth during the next two decades.
Question
Question
Infographic 4.5.
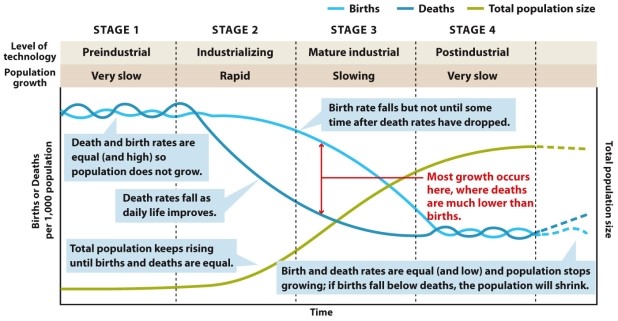
Refer to Infographic 4.5. The AIDS epidemic continues to affect certain African countries especially hard, as it targets individuals of reproductive and pre-reproductive age. Describe how this epidemic might prevent a country from proceeding through the demographic transition. In which stage might they be stuck?
Refer to Infographic 4.5. The AIDS epidemic continues to affect certain African countries especially hard, as it targets individuals of reproductive and pre-reproductive age. Describe how this epidemic might prevent a country from proceeding through the demographic transition. In which stage might they be stuck?
Question
Question
Question
Question
Question
Question
Infographic 4.4.
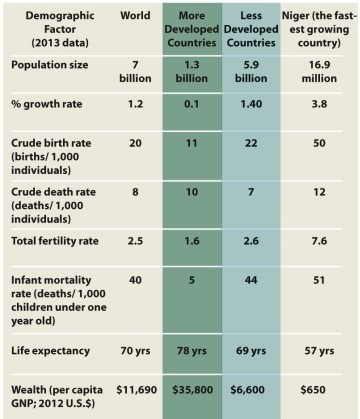
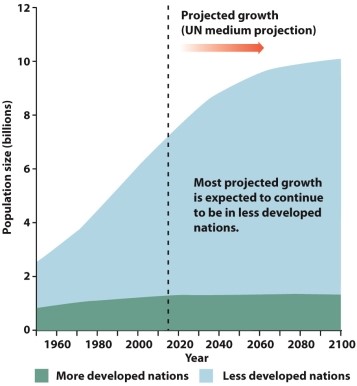
Refer to the graph in Infographic 4.4. A friend states that the only reason human environmental impact is unsustainable is the dramatic population growth in less developed countries. How can you explain that more developed countries also make unsustainable demands on our Earth's limited resources?
Refer to the graph in Infographic 4.4. A friend states that the only reason human environmental impact is unsustainable is the dramatic population growth in less developed countries. How can you explain that more developed countries also make unsustainable demands on our Earth's limited resources?
Question
Question
Question
Question
Question
Infographic 4.2.
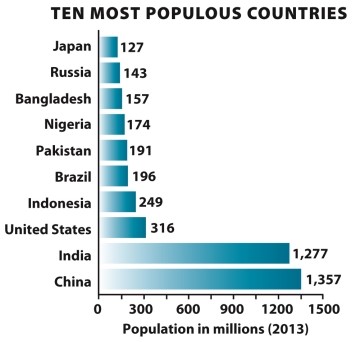
Refer to the map in Infographic 4.2. Why is it important to consider the density of a population when exploring the impact the population has on the area?
Refer to the map in Infographic 4.2. Why is it important to consider the density of a population when exploring the impact the population has on the area?
Question
Question
Question
Question
Question
Question
Match between columns
Question
Question
Question
Infographic 4.8.
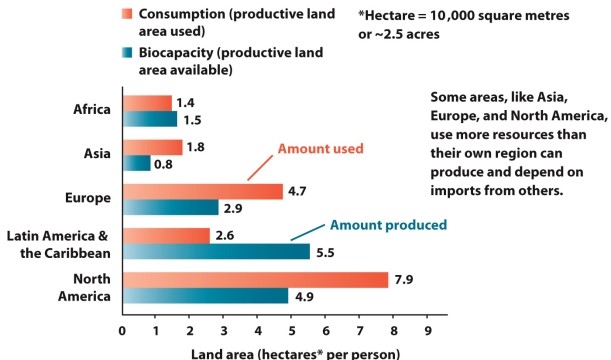
Refer to Infographic 4.8. Use the infographic to explain how countries in Latin America cut down vast amounts of forests despite not actually needing that quantity of the resource for themselves.
Refer to Infographic 4.8. Use the infographic to explain how countries in Latin America cut down vast amounts of forests despite not actually needing that quantity of the resource for themselves.
Question
Question
Question

Unlock Deck
Sign up to unlock the cards in this deck!
Unlock Deck
Unlock Deck
1/57
Play
Full screen (f)
Deck 4: Human Populations- One Child China Grows Up: a Country Faces the Outcomes of Radical Population Control
1
Which statement is FALSE?
A) More and less developed countries have similar values for demographic factors.
B) Desired family size is one of the best predictors of actual fertility.
C) The need for labor is a common pronatalist pressure in agrarian societies.
D) Total fertility rate is the average number of children a woman has in the course of her lifetime.
E) A high infant mortality rate contributes to higher fertility.
More and less developed countries have similar values for demographic factors.
2
The percentage increase of a population size over time is known as its ________.
A) population momentum
B) crude birth rate
C) life expectancy
D) growth rate
E) total fertility rate
A) population momentum
B) crude birth rate
C) life expectancy
D) growth rate
E) total fertility rate
growth rate
3
The global population in 2012 is approximately _________.
A) 700,000
B) 7 million
C) 7 billion
D) 700 million
E) 70 billion
A) 700,000
B) 7 million
C) 7 billion
D) 700 million
E) 70 billion
7 billion
4
What is total fertility rate (TFR)? How do programs such as social security, pension plans, and Medicare affect TFR?
Unlock Deck
Unlock for access to all 57 flashcards in this deck.
Unlock Deck
k this deck
5
Which of the following is TRUE regarding values for demographic factors between more and less developed countries?
A) Developed countries have higher total fertility rates.
B) Life expectancy in developing countries is higher.
C) Infant mortality rates are lower in developing countries.
D) Crude birth rates are higher in developing countries.
E) Life expectancy is higher in developing countries.
A) Developed countries have higher total fertility rates.
B) Life expectancy in developing countries is higher.
C) Infant mortality rates are lower in developing countries.
D) Crude birth rates are higher in developing countries.
E) Life expectancy is higher in developing countries.
Unlock Deck
Unlock for access to all 57 flashcards in this deck.
Unlock Deck
k this deck
6
A good example of a demographic factor that influences population changes would be ________.
A) education
B) economic conditions
C) cultural values
D) health care
E) All of the factors listed above influence population changes.
A) education
B) economic conditions
C) cultural values
D) health care
E) All of the factors listed above influence population changes.
Unlock Deck
Unlock for access to all 57 flashcards in this deck.
Unlock Deck
k this deck
7
Which of the following is NOT a good predictor of population growth in a country?
A) the land mass of a country
B) crude death rate
C) crude birth rate
D) population momentum
E) All of the above are good predictors.
A) the land mass of a country
B) crude death rate
C) crude birth rate
D) population momentum
E) All of the above are good predictors.
Unlock Deck
Unlock for access to all 57 flashcards in this deck.
Unlock Deck
k this deck
8
The discovery of penicillin, the first antibiotic, changed the face of disease management and treatment. For the first time, people were surviving infections that would normally have killed them. How would you think antibiotics, such as penicillin, affect a population's growth rate?
Unlock Deck
Unlock for access to all 57 flashcards in this deck.
Unlock Deck
k this deck
9
Which event 10,000 years ago resulted in a dramatic growth spurt in global human population?
A) an agricultural revolution
B) the Bronze Age
C) the Computer Age
D) the Industrial Revolution
E) the Black Death in Europe
A) an agricultural revolution
B) the Bronze Age
C) the Computer Age
D) the Industrial Revolution
E) the Black Death in Europe
Unlock Deck
Unlock for access to all 57 flashcards in this deck.
Unlock Deck
k this deck
10
The average number of children that a woman has over her lifetime is called the _______.
A) replacement fertility rate
B) total fertility rate
C) crude birth rate
D) population momentum
E) desired fertility
A) replacement fertility rate
B) total fertility rate
C) crude birth rate
D) population momentum
E) desired fertility
Unlock Deck
Unlock for access to all 57 flashcards in this deck.
Unlock Deck
k this deck
11
Cultural and economic forces than encourage women to have more children are called __________.
A) pronatalist pressures
B) population momentum
C) total fertility rates
D) demographic transitions
E) None of the above is correct.
A) pronatalist pressures
B) population momentum
C) total fertility rates
D) demographic transitions
E) None of the above is correct.
Unlock Deck
Unlock for access to all 57 flashcards in this deck.
Unlock Deck
k this deck
12
Infographic 4.1.
Refer to Infographic 4.1. As an emergency food supply in World War II, 20 reindeer were taken to an island in the Pacific, along with troops stationed there. Shortly thereafter, the war ended and the troops returned home, leaving the reindeer behind. After 10 years, the population of reindeer had increased to 6,000. However, with no predators and limited food and space available on the island, the population crashed, with no reindeer remaining after 10 more years. Describe what lessons can be learned from this as it applies to human populations on Earth.
Unlock Deck
Unlock for access to all 57 flashcards in this deck.
Unlock Deck
k this deck
13
The growth rate of a population is affected by which of the following?
A) crude birth rate
B) crude death rate
C) emigration
D) immigration
E) All of the above affect the growth rate.
A) crude birth rate
B) crude death rate
C) emigration
D) immigration
E) All of the above affect the growth rate.
Unlock Deck
Unlock for access to all 57 flashcards in this deck.
Unlock Deck
k this deck
14
An age structure diagram that shows a significant loss in the male population for a specific age group is likely representative of __________.
A) epidemic
B) war
C) pandemic
D) emigration
E) natural selection
A) epidemic
B) war
C) pandemic
D) emigration
E) natural selection
Unlock Deck
Unlock for access to all 57 flashcards in this deck.
Unlock Deck
k this deck
15
__________, the occurrence of more people living in an area than its natural and human resources can support, was one reason why China's leaders took political action to slow their country's growing population.
A) Immigration
B) Overpopulation
C) Population momentum
D) Emigration
E) Crude death rate
A) Immigration
B) Overpopulation
C) Population momentum
D) Emigration
E) Crude death rate
Unlock Deck
Unlock for access to all 57 flashcards in this deck.
Unlock Deck
k this deck
16
The crude death rate is defined as the number of deaths per ____ individuals per year.
A) 10
B) 100
C) 1,000
D) 10,000
E) 100,000
A) 10
B) 100
C) 1,000
D) 10,000
E) 100,000
Unlock Deck
Unlock for access to all 57 flashcards in this deck.
Unlock Deck
k this deck
17
Which of the following is NOT a reason why the global growth rate surged as a result of the Industrial Revolution in the 1700s?
A) greater use of vaccines
B) access to cleaner water
C) improved nutrition
D) improvements to the educational system
E) All of the above contributed to the surging growth rate.
A) greater use of vaccines
B) access to cleaner water
C) improved nutrition
D) improvements to the educational system
E) All of the above contributed to the surging growth rate.
Unlock Deck
Unlock for access to all 57 flashcards in this deck.
Unlock Deck
k this deck
18
A country with a growing population will have a ________ age structure diagram, while a country with a shrinking population will have a ________ age structure diagram.
A) pyramid-shaped; bottom-heavy
B) evenly distributed; pyramid-shaped
C) bottom-heavy; top-heavy
D) evenly distributed; top-heavy
E) top-heavy; bottom-heavy
A) pyramid-shaped; bottom-heavy
B) evenly distributed; pyramid-shaped
C) bottom-heavy; top-heavy
D) evenly distributed; top-heavy
E) top-heavy; bottom-heavy
Unlock Deck
Unlock for access to all 57 flashcards in this deck.
Unlock Deck
k this deck
19
The global population has roughly doubled since _____ to reach the current size.
A) 1750
B) 1800
C) 1935
D) 1967
E) 2000
A) 1750
B) 1800
C) 1935
D) 1967
E) 2000
Unlock Deck
Unlock for access to all 57 flashcards in this deck.
Unlock Deck
k this deck
20
Which of the following is an issue that a country with a top-heavy age structure diagram would face?
A) younger members of the population being forced to care for a large number of older relatives
B) a shrinking workforce
C) higher wages, better working conditions, and more jobs to choose from for younger members of the population
D) all of the above
E) none of the above
A) younger members of the population being forced to care for a large number of older relatives
B) a shrinking workforce
C) higher wages, better working conditions, and more jobs to choose from for younger members of the population
D) all of the above
E) none of the above
Unlock Deck
Unlock for access to all 57 flashcards in this deck.
Unlock Deck
k this deck
21
The global replacement fertility rate is approximately 2.33 children per woman. Why is this value higher than the 2.1 replacement fertility rate in the United States? If the current global total fertility rate (TFR) of 2.5 was brought down to 2.33, would that be enough to allow for sustainable existence of humans on Earth? What others factors must we also consider?
Unlock Deck
Unlock for access to all 57 flashcards in this deck.
Unlock Deck
k this deck
22
When does zero population growth occur?
A) when population growth rates decline
B) when birth rates equal death rates
C) when the replacement fertility rate is higher than the death rate
D) when death rates fall
E) when birth rates fall and death rates continue to rise
A) when population growth rates decline
B) when birth rates equal death rates
C) when the replacement fertility rate is higher than the death rate
D) when death rates fall
E) when birth rates fall and death rates continue to rise
Unlock Deck
Unlock for access to all 57 flashcards in this deck.
Unlock Deck
k this deck
23
Which of the following would NOT be a useful approach to helping a country reach zero population growth?
A) identifying reasons why birth rates are high
B) increasing educational opportunities for women
C) increasing access to family planning programs and access to contraceptives
D) educating men and providing them with job opportunities
E) providing better maternal and infant health care
A) identifying reasons why birth rates are high
B) increasing educational opportunities for women
C) increasing access to family planning programs and access to contraceptives
D) educating men and providing them with job opportunities
E) providing better maternal and infant health care
Unlock Deck
Unlock for access to all 57 flashcards in this deck.
Unlock Deck
k this deck
24
The industrializing stage of the demographic transition is characterized by _______ population growth.
A) moderate
B) slow
C) very slow
D) rapid
E) declining
A) moderate
B) slow
C) very slow
D) rapid
E) declining
Unlock Deck
Unlock for access to all 57 flashcards in this deck.
Unlock Deck
k this deck
25
Japan's population is fairly stable and is represented by an age structure diagram that looks like ________.
A) a pyramid
B) an inverted pyramid
C) a column
D) a circle
E) a square
A) a pyramid
B) an inverted pyramid
C) a column
D) a circle
E) a square
Unlock Deck
Unlock for access to all 57 flashcards in this deck.
Unlock Deck
k this deck
26
As a country's economy changes from preindustrial to postindustrial, low birth and death rates replace high birth and death rates. This phenomenon is known as _____________.
A) replacement fertility rate
B) demographic transition
C) zero population growth
D) total fertility rate
E) population densities
A) replacement fertility rate
B) demographic transition
C) zero population growth
D) total fertility rate
E) population densities
Unlock Deck
Unlock for access to all 57 flashcards in this deck.
Unlock Deck
k this deck
27
In China, total fertility rate has been reduced to 1.54, which is below the replacement fertility rate. Immigration is mostly internal, moving from rural to urban. However, the population continues to increase. Why is this so? Is this a permanent or temporary phenomenon?
Unlock Deck
Unlock for access to all 57 flashcards in this deck.
Unlock Deck
k this deck
28
Why would airlifting crates of condoms and dropping them over African countries with high total fertility rates not be a successful strategy at slowing global population growth rates? What factors need to be considered, beyond making contraceptives available?
Unlock Deck
Unlock for access to all 57 flashcards in this deck.
Unlock Deck
k this deck
29
In the United States, the replacement fertility rate is ______.
A) 1
B) 2
C) 2.1
D) 3
E) 0
A) 1
B) 2
C) 2.1
D) 3
E) 0
Unlock Deck
Unlock for access to all 57 flashcards in this deck.
Unlock Deck
k this deck
30
The rate at which children must be born to replace those dying in the population is called ____________.
A) positive growth
B) fertility rate
C) demographic transition
D) carrying capacity
E) replacement fertility rate
A) positive growth
B) fertility rate
C) demographic transition
D) carrying capacity
E) replacement fertility rate
Unlock Deck
Unlock for access to all 57 flashcards in this deck.
Unlock Deck
k this deck
31
_________ have already undergone the demographic transition.
A) Developing countries
B) Developed countries
C) Countries with high replacement fertility rates
D) Agrarian societies
E) None of these answers are correct.
A) Developing countries
B) Developed countries
C) Countries with high replacement fertility rates
D) Agrarian societies
E) None of these answers are correct.
Unlock Deck
Unlock for access to all 57 flashcards in this deck.
Unlock Deck
k this deck
32
Infographic 4.3.
Refer to Infographic 4.3. Looking at these three age structure diagrams, explain which country will be experiencing rapid population growth during the next two decades.
Refer to Infographic 4.3. Looking at these three age structure diagrams, explain which country will be experiencing rapid population growth during the next two decades.
Unlock Deck
Unlock for access to all 57 flashcards in this deck.
Unlock Deck
k this deck
33
You have been assigned the task of determining if a population will be growing, slowing, or declining. What aspects of an age structure diagram will help you determine what will happen to the population in the future?
Unlock Deck
Unlock for access to all 57 flashcards in this deck.
Unlock Deck
k this deck
34
Infographic 4.5.
Refer to Infographic 4.5. The AIDS epidemic continues to affect certain African countries especially hard, as it targets individuals of reproductive and pre-reproductive age. Describe how this epidemic might prevent a country from proceeding through the demographic transition. In which stage might they be stuck?
Refer to Infographic 4.5. The AIDS epidemic continues to affect certain African countries especially hard, as it targets individuals of reproductive and pre-reproductive age. Describe how this epidemic might prevent a country from proceeding through the demographic transition. In which stage might they be stuck?
Unlock Deck
Unlock for access to all 57 flashcards in this deck.
Unlock Deck
k this deck
35
Zero population growth occurs when the population reaches:
A) demographic transition.
B) the replacement fertility rate.
C) the total fertility rate.
D) the infant mortality rate.
E) population momentum.
A) demographic transition.
B) the replacement fertility rate.
C) the total fertility rate.
D) the infant mortality rate.
E) population momentum.
Unlock Deck
Unlock for access to all 57 flashcards in this deck.
Unlock Deck
k this deck
36
As a country progresses from the preindustrial stage to the postindustrial stage, what will happen to the birth rate and death rate?
A) Both will increase.
B) Both will decrease.
C) Both remain unchanged.
D) Birth rate will increase, and death rate will decrease.
E) Birth rate will decrease, and death rate will increase.
A) Both will increase.
B) Both will decrease.
C) Both remain unchanged.
D) Birth rate will increase, and death rate will decrease.
E) Birth rate will decrease, and death rate will increase.
Unlock Deck
Unlock for access to all 57 flashcards in this deck.
Unlock Deck
k this deck
37
A less developed country with a high infant mortality and extensive poverty has a total fertility rate (TFR) of 5.7. Very few women receive a secondary education, and most do not work outside the home. What pronatalist pressures can you identify? What strategies can you propose to successfully lower TFR in this country?
Unlock Deck
Unlock for access to all 57 flashcards in this deck.
Unlock Deck
k this deck
38
Addressing which of the following will help countries lower their total fertility rates?
A) poverty
B) high infant mortality
C) lack of education for women
D) lack of job opportunities for women
E) all of the above
A) poverty
B) high infant mortality
C) lack of education for women
D) lack of job opportunities for women
E) all of the above
Unlock Deck
Unlock for access to all 57 flashcards in this deck.
Unlock Deck
k this deck
39
Using the following information, at what stage in the demographic transition would this country be classified in: a decline in the death rate, advances in food safety and health care, a decline in the birth rate, and a slowing population growth?
Unlock Deck
Unlock for access to all 57 flashcards in this deck.
Unlock Deck
k this deck
40
Infographic 4.4.
Refer to the graph in Infographic 4.4. A friend states that the only reason human environmental impact is unsustainable is the dramatic population growth in less developed countries. How can you explain that more developed countries also make unsustainable demands on our Earth's limited resources?
Refer to the graph in Infographic 4.4. A friend states that the only reason human environmental impact is unsustainable is the dramatic population growth in less developed countries. How can you explain that more developed countries also make unsustainable demands on our Earth's limited resources?
Unlock Deck
Unlock for access to all 57 flashcards in this deck.
Unlock Deck
k this deck
41
How does overconsumption in developed countries, such as the United States, affect countries in other regions, such as Asia?
Unlock Deck
Unlock for access to all 57 flashcards in this deck.
Unlock Deck
k this deck
42
Why should the United States be concerned with the fact that the Chinese workforce aged 20 to 24 will shrink by 50%?
A) Fewer Chinese will immigrate to the United States.
B) More jobs from the United States will move to China, leaving fewer jobs for Americans.
C) Overall fertility in China will increase with repercussions in the United States.
D) Chinese workers will get higher wages, which will increase the cost of the goods.
E) Overall, goods and services will cost less than they do now.
Unlock Deck
Unlock for access to all 57 flashcards in this deck.
Unlock Deck
k this deck
43
What is the "4-2-1" conundrum, and why do demographers fear it?
A) Compared with the top, there are four times as many people on the bottom of the age pyramid and two times as many in the middle. Demographers fear that that the population will explode.
B) In China there are four grandparents and two parents but only one child to support them all when they retire.
C) In China in 1982, 1% of the population was over 65. In 1996 it was 2%, and now 4% of the population is over 65. The result is that there are more older people to support.
D) In China, 4% of the population works, 2% are underage, and 1% are retired. Demographers fear this will reverse.
E) Worldwide, one in four females gets an education and one in two males gets an education. Demographers fear that women will have no other option then to have children.
Unlock Deck
Unlock for access to all 57 flashcards in this deck.
Unlock Deck
k this deck
44
Today, the United States and France each exhibit an aging population. Why is this such a concern for demographers?
A) Too many babies are being born.
B) People are dying earlier.
C) More people are retiring with fewer younger people to support them.
D) There isn't enough housing for the people.
E) The aging population is producing more waste than younger people.
A) Too many babies are being born.
B) People are dying earlier.
C) More people are retiring with fewer younger people to support them.
D) There isn't enough housing for the people.
E) The aging population is producing more waste than younger people.
Unlock Deck
Unlock for access to all 57 flashcards in this deck.
Unlock Deck
k this deck
45
Infographic 4.2.
Refer to the map in Infographic 4.2. Why is it important to consider the density of a population when exploring the impact the population has on the area?
Refer to the map in Infographic 4.2. Why is it important to consider the density of a population when exploring the impact the population has on the area?
Unlock Deck
Unlock for access to all 57 flashcards in this deck.
Unlock Deck
k this deck
46
What is the ultimate population question?
A) Is the carrying capacity 7 billion people?
B) Is the carrying capacity 9 billion people?
C) Should China continue their one-child policy?
D) What is the acceptable quality of life?
E) Is population growth linked to climate change?
A) Is the carrying capacity 7 billion people?
B) Is the carrying capacity 9 billion people?
C) Should China continue their one-child policy?
D) What is the acceptable quality of life?
E) Is population growth linked to climate change?
Unlock Deck
Unlock for access to all 57 flashcards in this deck.
Unlock Deck
k this deck
47
What effect is the Chinese migration from rural to urban areas having on the population?
A) Urban families tend to be larger than rural families.
B) Urban families tend to be smaller than rural families.
C) Cities are better able to handle the burgeoning populations than the countryside is.
D) There are fewer opportunities for education and health care in the cities.
E) More Chinese are deciding to immigrate to other countries.
Unlock Deck
Unlock for access to all 57 flashcards in this deck.
Unlock Deck
k this deck
48
An increase in population causes all but which of the following?
A) an increased standard of living due to technology
B) land degradation
C) water supply depletion
D) water pollution
E) an impoverished environment
A) an increased standard of living due to technology
B) land degradation
C) water supply depletion
D) water pollution
E) an impoverished environment
Unlock Deck
Unlock for access to all 57 flashcards in this deck.
Unlock Deck
k this deck
49
Refer to Infographic 4.8. Only one region in this graph produces more resources than they use. How is biocapacity related to population?
Unlock Deck
Unlock for access to all 57 flashcards in this deck.
Unlock Deck
k this deck
50
In terms of reaching Earth's carrying capacity, developing countries exacerbate the problem due to their ________, while developed countries also aggravate the situation due to their ___________.
A) unsustainable resource use; high fertility rates
B) high fertility rates; overconsumption
C) high immigration rates; low emigration rates
D) gendercide; overconsumption
E) use of nonrenewable energy; high death rates
A) unsustainable resource use; high fertility rates
B) high fertility rates; overconsumption
C) high immigration rates; low emigration rates
D) gendercide; overconsumption
E) use of nonrenewable energy; high death rates
Unlock Deck
Unlock for access to all 57 flashcards in this deck.
Unlock Deck
k this deck
51
Match between columns
Unlock Deck
Unlock for access to all 57 flashcards in this deck.
Unlock Deck
k this deck
52
To feed an increasing world population, humanity has needed to increase the carrying capacity of the planet. This has involved ___________.
A) dependence on the use of fossil fuels to grow food
B) dependence on the use of herbicides to grow food
C) removing more fish from the oceans than they can repopulate
D) destruction of animal habitat for human use
E) It has involved all of the above issues
A) dependence on the use of fossil fuels to grow food
B) dependence on the use of herbicides to grow food
C) removing more fish from the oceans than they can repopulate
D) destruction of animal habitat for human use
E) It has involved all of the above issues
Unlock Deck
Unlock for access to all 57 flashcards in this deck.
Unlock Deck
k this deck
53
Which of the following issues is not a result of sex preference?
A) sex-selective abortions
B) gendercide
C) increased foreign adoptions of female infants
D) sex ratio skewed toward males
E) increased emigration
A) sex-selective abortions
B) gendercide
C) increased foreign adoptions of female infants
D) sex ratio skewed toward males
E) increased emigration
Unlock Deck
Unlock for access to all 57 flashcards in this deck.
Unlock Deck
k this deck
54
Infographic 4.8.
Refer to Infographic 4.8. Use the infographic to explain how countries in Latin America cut down vast amounts of forests despite not actually needing that quantity of the resource for themselves.
Refer to Infographic 4.8. Use the infographic to explain how countries in Latin America cut down vast amounts of forests despite not actually needing that quantity of the resource for themselves.
Unlock Deck
Unlock for access to all 57 flashcards in this deck.
Unlock Deck
k this deck
55
How has the one-child policy in China changed the country's sex ratio? What effect is this having on the country?
Unlock Deck
Unlock for access to all 57 flashcards in this deck.
Unlock Deck
k this deck
56
China's growth rate has slowed dramatically since the 1950s. With more resources available per child, more and more families are raising their standard of living and focusing on smaller family sizes. The numbers of cars and mobile phones is expected to boom soon in China. Explain how population pressures are not the only factor in reaching a population's carrying capacity.
Unlock Deck
Unlock for access to all 57 flashcards in this deck.
Unlock Deck
k this deck
57
You have been assigned the task of helping a developing country transition from demographic stage 2 (industrializing) to demographic stage 3 (mature industrial). How would you accomplish this task?
Unlock Deck
Unlock for access to all 57 flashcards in this deck.
Unlock Deck
k this deck
Unlock Deck
Unlock for access to all 57 flashcards in this deck.


