Deck 9: Essay
Full screen (f)
Question
Figure 9-26
The following diagram shows the domestic demand and domestic supply curves in a market.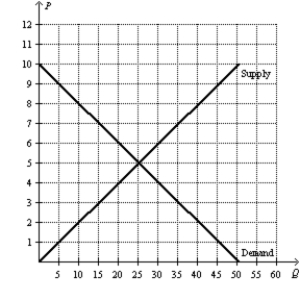
Refer to Figure 9-26.Suppose the world price in this market is $7.If the country allows free trade,by how much do consumer surplus,producer surplus,and total surplus change with trade?
The following diagram shows the domestic demand and domestic supply curves in a market.
Refer to Figure 9-26.Suppose the world price in this market is $7.If the country allows free trade,by how much do consumer surplus,producer surplus,and total surplus change with trade?
Question
Figure 9-27
The following diagram shows the domestic demand and supply curves in a market.Assume that the world price in this market is $20 per unit.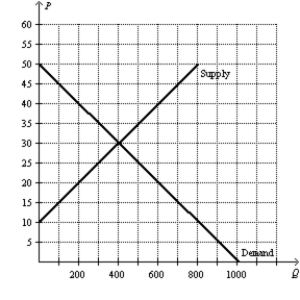
Refer to Figure 9-27.With no trade allowed,how much are consumer surplus,producer surplus,and total surplus?
The following diagram shows the domestic demand and supply curves in a market.Assume that the world price in this market is $20 per unit.
Refer to Figure 9-27.With no trade allowed,how much are consumer surplus,producer surplus,and total surplus?
Question
Question
Figure 9-26
The following diagram shows the domestic demand and domestic supply curves in a market.
Refer to Figure 9-26.Suppose the world price in this market is $7.If the country allows free trade,how many units will domestic consumers demand,and how many units will domestic producers produce?
The following diagram shows the domestic demand and domestic supply curves in a market.
Refer to Figure 9-26.Suppose the world price in this market is $7.If the country allows free trade,how many units will domestic consumers demand,and how many units will domestic producers produce?
Question
Figure 9-26
The following diagram shows the domestic demand and domestic supply curves in a market.
Refer to Figure 9-26.Suppose the world price in this market is $7.If the country allows free trade,will the country import or export this good,and how many units will be imported/exported?
The following diagram shows the domestic demand and domestic supply curves in a market.
Refer to Figure 9-26.Suppose the world price in this market is $7.If the country allows free trade,will the country import or export this good,and how many units will be imported/exported?
Question
Figure 9-27
The following diagram shows the domestic demand and supply curves in a market.Assume that the world price in this market is $20 per unit.
Refer to Figure 9-27.With no trade allowed,what are the equilibrium price and equilibrium quantity in this market?
The following diagram shows the domestic demand and supply curves in a market.Assume that the world price in this market is $20 per unit.
Refer to Figure 9-27.With no trade allowed,what are the equilibrium price and equilibrium quantity in this market?
Question
Question
Figure 9-26
The following diagram shows the domestic demand and domestic supply curves in a market.
Refer to Figure 9-26.Suppose the world price in this market is $7.If the country allows free trade,how much are consumer surplus,producer surplus,and total surplus with trade?
The following diagram shows the domestic demand and domestic supply curves in a market.
Refer to Figure 9-26.Suppose the world price in this market is $7.If the country allows free trade,how much are consumer surplus,producer surplus,and total surplus with trade?
Question
Figure 9-27
The following diagram shows the domestic demand and supply curves in a market.Assume that the world price in this market is $20 per unit.
Refer to Figure 9-27.If the country allows free trade,how many units will domestic consumers demand and how many units will domestic producers produce?
The following diagram shows the domestic demand and supply curves in a market.Assume that the world price in this market is $20 per unit.
Refer to Figure 9-27.If the country allows free trade,how many units will domestic consumers demand and how many units will domestic producers produce?
Question
Figure 9-26
The following diagram shows the domestic demand and domestic supply curves in a market.
Refer to Figure 9-26.With no trade allowed,what are the equilibrium price and equilibrium quantity in this market?
The following diagram shows the domestic demand and domestic supply curves in a market.
Refer to Figure 9-26.With no trade allowed,what are the equilibrium price and equilibrium quantity in this market?
Question
Question
Question
Figure 9-27
The following diagram shows the domestic demand and supply curves in a market.Assume that the world price in this market is $20 per unit.
Refer to Figure 9-27.If the country allows free trade,will the country import or export this good,and how many units will be imported/exported?
The following diagram shows the domestic demand and supply curves in a market.Assume that the world price in this market is $20 per unit.
Refer to Figure 9-27.If the country allows free trade,will the country import or export this good,and how many units will be imported/exported?
Question
Figure 9-26
The following diagram shows the domestic demand and domestic supply curves in a market.
Refer to Figure 9-26.With no trade allowed,how much are consumer surplus,producer surplus,and total surplus in this market?
The following diagram shows the domestic demand and domestic supply curves in a market.
Refer to Figure 9-26.With no trade allowed,how much are consumer surplus,producer surplus,and total surplus in this market?
Question
Question
Question
Question
Question
Figure 9-27
The following diagram shows the domestic demand and supply curves in a market.Assume that the world price in this market is $20 per unit.
Refer to Figure 9-27.If the country allows free trade,how much are consumer surplus,producer surplus,and total surplus with trade?
The following diagram shows the domestic demand and supply curves in a market.Assume that the world price in this market is $20 per unit.
Refer to Figure 9-27.If the country allows free trade,how much are consumer surplus,producer surplus,and total surplus with trade?
Question
Figure 9-27
The following diagram shows the domestic demand and supply curves in a market.Assume that the world price in this market is $20 per unit.
Refer to Figure 9-27.If the country allows free trade,by how much do consumer surplus,producer surplus,and total surplus change with trade?
The following diagram shows the domestic demand and supply curves in a market.Assume that the world price in this market is $20 per unit.
Refer to Figure 9-27.If the country allows free trade,by how much do consumer surplus,producer surplus,and total surplus change with trade?
Question
Figure 9-28
The following diagram shows the domestic demand and domestic supply curves in a market.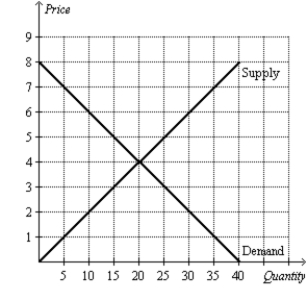
Refer to Figure 9-28.Suppose the world price in this market is $6.If the country allows free trade,how much is consumer surplus?
The following diagram shows the domestic demand and domestic supply curves in a market.
Refer to Figure 9-28.Suppose the world price in this market is $6.If the country allows free trade,how much is consumer surplus?
Question
Figure 9-28
The following diagram shows the domestic demand and domestic supply curves in a market.
Refer to Figure 9-28.Suppose the world price in this market is $6.If the country allows free trade,how many units will domestic consumers demand,and how many units will domestic producers supply?
The following diagram shows the domestic demand and domestic supply curves in a market.
Refer to Figure 9-28.Suppose the world price in this market is $6.If the country allows free trade,how many units will domestic consumers demand,and how many units will domestic producers supply?
Question
Scenario 9-3
Suppose domestic demand and domestic supply in a market are given by the following equations:
Refer to Scenario 9-3.Suppose the world price in this market is $8 per unit.If the country allows free trade,how much are consumer surplus,producer surplus,and producer surplus with trade?
Suppose domestic demand and domestic supply in a market are given by the following equations:
Refer to Scenario 9-3.Suppose the world price in this market is $8 per unit.If the country allows free trade,how much are consumer surplus,producer surplus,and producer surplus with trade?
Question
Figure 9-28
The following diagram shows the domestic demand and domestic supply curves in a market.
Refer to Figure 9-28.Suppose the world price in this market is $6.If the country allows free trade,will the country import or export this good,and how many units will be imported/exported?
The following diagram shows the domestic demand and domestic supply curves in a market.
Refer to Figure 9-28.Suppose the world price in this market is $6.If the country allows free trade,will the country import or export this good,and how many units will be imported/exported?
Question
Scenario 9-3
Suppose domestic demand and domestic supply in a market are given by the following equations:
Refer to Scenario 9-3.Suppose the world price in this market is $8 per unit.If the country allows free trade,by how much do consumer surplus,producer surplus,and producer surplus change?
Suppose domestic demand and domestic supply in a market are given by the following equations:
Refer to Scenario 9-3.Suppose the world price in this market is $8 per unit.If the country allows free trade,by how much do consumer surplus,producer surplus,and producer surplus change?
Question
Scenario 9-3
Suppose domestic demand and domestic supply in a market are given by the following equations:
Refer to Scenario 9-3.With no trade allowed,how much are consumer surplus,producer surplus,and total surplus in this market?
Suppose domestic demand and domestic supply in a market are given by the following equations:
Refer to Scenario 9-3.With no trade allowed,how much are consumer surplus,producer surplus,and total surplus in this market?
Question
Figure 9-29
The following diagram shows the domestic demand and domestic supply curves in a market.Assume that the world price in this market is $1 per unit.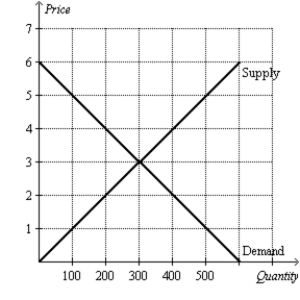
Refer to Figure 9-29.With no trade allowed,how much are consumer surplus,producer surplus,and total surplus?
The following diagram shows the domestic demand and domestic supply curves in a market.Assume that the world price in this market is $1 per unit.
Refer to Figure 9-29.With no trade allowed,how much are consumer surplus,producer surplus,and total surplus?
Question
Figure 9-28
The following diagram shows the domestic demand and domestic supply curves in a market.
Refer to Figure 9-28.Suppose the world price in this market is $6.If the country allows free trade,how much is total surplus?
The following diagram shows the domestic demand and domestic supply curves in a market.
Refer to Figure 9-28.Suppose the world price in this market is $6.If the country allows free trade,how much is total surplus?
Question
Figure 9-29
The following diagram shows the domestic demand and domestic supply curves in a market.Assume that the world price in this market is $1 per unit.
Refer to Figure 9-29.If the country allows free trade,how many units will domestic consumers demand and how many units will domestic producers supply?
The following diagram shows the domestic demand and domestic supply curves in a market.Assume that the world price in this market is $1 per unit.
Refer to Figure 9-29.If the country allows free trade,how many units will domestic consumers demand and how many units will domestic producers supply?
Question
Figure 9-29
The following diagram shows the domestic demand and domestic supply curves in a market.Assume that the world price in this market is $1 per unit.
Refer to Figure 9-29.With no trade allowed,what are the equilibrium price and equilibrium quantity in this market?
The following diagram shows the domestic demand and domestic supply curves in a market.Assume that the world price in this market is $1 per unit.
Refer to Figure 9-29.With no trade allowed,what are the equilibrium price and equilibrium quantity in this market?
Question
Figure 9-27
The following diagram shows the domestic demand and supply curves in a market.Assume that the world price in this market is $20 per unit.
Refer to Figure 9-27.Suppose the country imposes a $5 per unit tariff.If the country allows trade with a tariff,how much are consumer surplus,producer surplus,tariff revenue,and total surplus?
Question
Figure 9-28
The following diagram shows the domestic demand and domestic supply curves in a market.
Refer to Figure 9-28.With no trade allowed,how much are consumer surplus,producer surplus,and total surplus in this market?
The following diagram shows the domestic demand and domestic supply curves in a market.
Refer to Figure 9-28.With no trade allowed,how much are consumer surplus,producer surplus,and total surplus in this market?
Question
Scenario 9-3
Suppose domestic demand and domestic supply in a market are given by the following equations:
Refer to Scenario 9-3.With no trade allowed,what are the equilibrium price and quantity in this market?
Suppose domestic demand and domestic supply in a market are given by the following equations:
Refer to Scenario 9-3.With no trade allowed,what are the equilibrium price and quantity in this market?
Question
Scenario 9-3
Suppose domestic demand and domestic supply in a market are given by the following equations:
Refer to Scenario 9-3.Suppose the world price in this market is $8 per unit,and suppose the country imposes a $1 per unit tariff.If the country allows trade with a tariff,how much are consumer surplus,producer surplus,tariff revenue,and total surplus?
Question
Scenario 9-3
Suppose domestic demand and domestic supply in a market are given by the following equations:
Refer to Scenario 9-3.Suppose the world price in this market is $8 per unit.If the country allows free trade,will the country import or export this good,and how many units will be imported/exported?
Suppose domestic demand and domestic supply in a market are given by the following equations:
Refer to Scenario 9-3.Suppose the world price in this market is $8 per unit.If the country allows free trade,will the country import or export this good,and how many units will be imported/exported?
Question
Figure 9-28
The following diagram shows the domestic demand and domestic supply curves in a market.
Refer to Figure 9-28.With no trade allowed,what are the equilibrium price and equilibrium quantity in this market?
The following diagram shows the domestic demand and domestic supply curves in a market.
Refer to Figure 9-28.With no trade allowed,what are the equilibrium price and equilibrium quantity in this market?
Question
Figure 9-29
The following diagram shows the domestic demand and domestic supply curves in a market.Assume that the world price in this market is $1 per unit.
Refer to Figure 9-29.If the country allows free trade,will the country import or export this good,and how many units will be imported/exported?
The following diagram shows the domestic demand and domestic supply curves in a market.Assume that the world price in this market is $1 per unit.
Refer to Figure 9-29.If the country allows free trade,will the country import or export this good,and how many units will be imported/exported?
Question
Figure 9-28
The following diagram shows the domestic demand and domestic supply curves in a market.
Refer to Figure 9-28.Suppose the world price in this market is $6.If the country allows free trade,how much is producer surplus?
The following diagram shows the domestic demand and domestic supply curves in a market.
Refer to Figure 9-28.Suppose the world price in this market is $6.If the country allows free trade,how much is producer surplus?
Question
Scenario 9-3
Suppose domestic demand and domestic supply in a market are given by the following equations:
Refer to Scenario 9-3.Suppose the world price in this market is $8 per unit,and suppose the country imposes a $1 per unit tariff.If the country allows trade with a tariff,how much is the deadweight loss caused by the tariff?
Question
Figure 9-27
The following diagram shows the domestic demand and supply curves in a market.Assume that the world price in this market is $20 per unit.
Refer to Figure 9-27.Suppose the country imposes a $5 per unit tariff.If the country allows trade with a tariff,how much is the deadweight loss caused by the tariff?
Question
Figure 9-29
The following diagram shows the domestic demand and domestic supply curves in a market.Assume that the world price in this market is $1 per unit.
Refer to Figure 9-29.Suppose the country imposes a $1 per unit tariff.If the country allows trade with a tariff,how much is the deadweight loss caused by the tariff?
Question
Figure 9-29
The following diagram shows the domestic demand and domestic supply curves in a market.Assume that the world price in this market is $1 per unit.
Refer to Figure 9-29.Suppose the country imposes a $1 per unit tariff.If the country allows trade with a tariff,how many units will be imported?
The following diagram shows the domestic demand and domestic supply curves in a market.Assume that the world price in this market is $1 per unit.
Refer to Figure 9-29.Suppose the country imposes a $1 per unit tariff.If the country allows trade with a tariff,how many units will be imported?
Question
Question
Figure 9-29
The following diagram shows the domestic demand and domestic supply curves in a market.Assume that the world price in this market is $1 per unit.
Refer to Figure 9-29.Suppose the country imposes a $1 per unit tariff.If the country allows trade with a tariff,what will be the domestic price in this market?
Question
Figure 9-29
The following diagram shows the domestic demand and domestic supply curves in a market.Assume that the world price in this market is $1 per unit.
Refer to Figure 9-29.Suppose the country imposes a $1 per unit tariff.If the country allows trade with a tariff,how much is tariff revenue?
The following diagram shows the domestic demand and domestic supply curves in a market.Assume that the world price in this market is $1 per unit.
Refer to Figure 9-29.Suppose the country imposes a $1 per unit tariff.If the country allows trade with a tariff,how much is tariff revenue?
Question
Figure 9-29
The following diagram shows the domestic demand and domestic supply curves in a market.Assume that the world price in this market is $1 per unit.
Refer to Figure 9-29.Suppose the country imposes a $1 per unit tariff.If the country allows trade with a tariff,how much is total surplus?
The following diagram shows the domestic demand and domestic supply curves in a market.Assume that the world price in this market is $1 per unit.
Refer to Figure 9-29.Suppose the country imposes a $1 per unit tariff.If the country allows trade with a tariff,how much is total surplus?
Question
Figure 9-29
The following diagram shows the domestic demand and domestic supply curves in a market.Assume that the world price in this market is $1 per unit.
Refer to Figure 9-29.Suppose the country imposes a $1 per unit tariff.If the country allows trade with a tariff,how many units will domestic consumers demand and how many units will domestic producers supply?
Question
Question
Question
Question
Figure 9-29
The following diagram shows the domestic demand and domestic supply curves in a market.Assume that the world price in this market is $1 per unit.
Refer to Figure 9-29.If the country allows free trade,how much are consumer surplus,producer surplus,and total surplus with trade?
The following diagram shows the domestic demand and domestic supply curves in a market.Assume that the world price in this market is $1 per unit.
Refer to Figure 9-29.If the country allows free trade,how much are consumer surplus,producer surplus,and total surplus with trade?
Question
Figure 9-29
The following diagram shows the domestic demand and domestic supply curves in a market.Assume that the world price in this market is $1 per unit.
Refer to Figure 9-29.Suppose the country imposes a $1 per unit tariff.If the country allows trade with a tariff,how much are consumer surplus and producer surplus?
Question

Unlock Deck
Sign up to unlock the cards in this deck!
Unlock Deck
Unlock Deck
1/53
Play
Full screen (f)
Deck 9: Essay
1
Figure 9-26
The following diagram shows the domestic demand and domestic supply curves in a market.
Refer to Figure 9-26.Suppose the world price in this market is $7.If the country allows free trade,by how much do consumer surplus,producer surplus,and total surplus change with trade?
The following diagram shows the domestic demand and domestic supply curves in a market.
Refer to Figure 9-26.Suppose the world price in this market is $7.If the country allows free trade,by how much do consumer surplus,producer surplus,and total surplus change with trade?
With trade,consumer surplus falls by $40,producer surplus rises by $60,and total surplus increases by $20.
2
Figure 9-27
The following diagram shows the domestic demand and supply curves in a market.Assume that the world price in this market is $20 per unit.
Refer to Figure 9-27.With no trade allowed,how much are consumer surplus,producer surplus,and total surplus?
The following diagram shows the domestic demand and supply curves in a market.Assume that the world price in this market is $20 per unit.
Refer to Figure 9-27.With no trade allowed,how much are consumer surplus,producer surplus,and total surplus?
Without trade,consumer surplus is $4,000,producer surplus is $4,000,and total surplus is $8,000.
3
Suppose the world price of coffee is $3 per pound and Brazil's domestic price of coffee without trade is $2 per pound.If Brazil allows free trade,will Brazil be an importer or an exporter of coffee?
Brazil will be an exporter of coffee.
4
Figure 9-26
The following diagram shows the domestic demand and domestic supply curves in a market.
Refer to Figure 9-26.Suppose the world price in this market is $7.If the country allows free trade,how many units will domestic consumers demand,and how many units will domestic producers produce?
The following diagram shows the domestic demand and domestic supply curves in a market.
Refer to Figure 9-26.Suppose the world price in this market is $7.If the country allows free trade,how many units will domestic consumers demand,and how many units will domestic producers produce?
Unlock Deck
Unlock for access to all 53 flashcards in this deck.
Unlock Deck
k this deck
5
Figure 9-26
The following diagram shows the domestic demand and domestic supply curves in a market.
Refer to Figure 9-26.Suppose the world price in this market is $7.If the country allows free trade,will the country import or export this good,and how many units will be imported/exported?
The following diagram shows the domestic demand and domestic supply curves in a market.
Refer to Figure 9-26.Suppose the world price in this market is $7.If the country allows free trade,will the country import or export this good,and how many units will be imported/exported?
Unlock Deck
Unlock for access to all 53 flashcards in this deck.
Unlock Deck
k this deck
6
Figure 9-27
The following diagram shows the domestic demand and supply curves in a market.Assume that the world price in this market is $20 per unit.
Refer to Figure 9-27.With no trade allowed,what are the equilibrium price and equilibrium quantity in this market?
The following diagram shows the domestic demand and supply curves in a market.Assume that the world price in this market is $20 per unit.
Refer to Figure 9-27.With no trade allowed,what are the equilibrium price and equilibrium quantity in this market?
Unlock Deck
Unlock for access to all 53 flashcards in this deck.
Unlock Deck
k this deck
7
Suppose in the country of Jumanji that the price of coffee with no trade allowed is below the world price of coffee.If Jumanji allows free trade,will Jumanji be an importer or an exporter of coffee?
Unlock Deck
Unlock for access to all 53 flashcards in this deck.
Unlock Deck
k this deck
8
Figure 9-26
The following diagram shows the domestic demand and domestic supply curves in a market.
Refer to Figure 9-26.Suppose the world price in this market is $7.If the country allows free trade,how much are consumer surplus,producer surplus,and total surplus with trade?
The following diagram shows the domestic demand and domestic supply curves in a market.
Refer to Figure 9-26.Suppose the world price in this market is $7.If the country allows free trade,how much are consumer surplus,producer surplus,and total surplus with trade?
Unlock Deck
Unlock for access to all 53 flashcards in this deck.
Unlock Deck
k this deck
9
Figure 9-27
The following diagram shows the domestic demand and supply curves in a market.Assume that the world price in this market is $20 per unit.
Refer to Figure 9-27.If the country allows free trade,how many units will domestic consumers demand and how many units will domestic producers produce?
The following diagram shows the domestic demand and supply curves in a market.Assume that the world price in this market is $20 per unit.
Refer to Figure 9-27.If the country allows free trade,how many units will domestic consumers demand and how many units will domestic producers produce?
Unlock Deck
Unlock for access to all 53 flashcards in this deck.
Unlock Deck
k this deck
10
Figure 9-26
The following diagram shows the domestic demand and domestic supply curves in a market.
Refer to Figure 9-26.With no trade allowed,what are the equilibrium price and equilibrium quantity in this market?
The following diagram shows the domestic demand and domestic supply curves in a market.
Refer to Figure 9-26.With no trade allowed,what are the equilibrium price and equilibrium quantity in this market?
Unlock Deck
Unlock for access to all 53 flashcards in this deck.
Unlock Deck
k this deck
11
Suppose in the country of Nash that the price of oranges is $8 per bushel with no trade allowed.If the world price of oranges is $10 per bushel and if Nash allows free trade,will Nash be an importer or an exporter of oranges?
Unlock Deck
Unlock for access to all 53 flashcards in this deck.
Unlock Deck
k this deck
12
A tax on an imported good is called a ------ .
Unlock Deck
Unlock for access to all 53 flashcards in this deck.
Unlock Deck
k this deck
13
Figure 9-27
The following diagram shows the domestic demand and supply curves in a market.Assume that the world price in this market is $20 per unit.
Refer to Figure 9-27.If the country allows free trade,will the country import or export this good,and how many units will be imported/exported?
The following diagram shows the domestic demand and supply curves in a market.Assume that the world price in this market is $20 per unit.
Refer to Figure 9-27.If the country allows free trade,will the country import or export this good,and how many units will be imported/exported?
Unlock Deck
Unlock for access to all 53 flashcards in this deck.
Unlock Deck
k this deck
14
Figure 9-26
The following diagram shows the domestic demand and domestic supply curves in a market.
Refer to Figure 9-26.With no trade allowed,how much are consumer surplus,producer surplus,and total surplus in this market?
The following diagram shows the domestic demand and domestic supply curves in a market.
Refer to Figure 9-26.With no trade allowed,how much are consumer surplus,producer surplus,and total surplus in this market?
Unlock Deck
Unlock for access to all 53 flashcards in this deck.
Unlock Deck
k this deck
15
Suppose in the country of Nash that the price of corn is $4 per bushel with no trade allowed.If the world price of corn is $3 per bushel and if Nash allows free trade,will Nash be an importer or an exporter of corn?
Unlock Deck
Unlock for access to all 53 flashcards in this deck.
Unlock Deck
k this deck
16
A country has a comparative advantage in a product if the world price is ----- than that country's domestic price without trade.
Unlock Deck
Unlock for access to all 53 flashcards in this deck.
Unlock Deck
k this deck
17
Suppose the world price of coffee is $2 per pound and Brazil's domestic price of coffee without trade is $3 per pound.If Brazil allows free trade,will Brazil be an importer or an exporter of coffee?
Unlock Deck
Unlock for access to all 53 flashcards in this deck.
Unlock Deck
k this deck
18
Suppose in the country of Jumanji that the price of wheat with no trade allowed is above the world price of wheat.If Jumanji allows free trade,will Jumanji be an importer or an exporter of wheat?
Unlock Deck
Unlock for access to all 53 flashcards in this deck.
Unlock Deck
k this deck
19
Figure 9-27
The following diagram shows the domestic demand and supply curves in a market.Assume that the world price in this market is $20 per unit.
Refer to Figure 9-27.If the country allows free trade,how much are consumer surplus,producer surplus,and total surplus with trade?
The following diagram shows the domestic demand and supply curves in a market.Assume that the world price in this market is $20 per unit.
Refer to Figure 9-27.If the country allows free trade,how much are consumer surplus,producer surplus,and total surplus with trade?
Unlock Deck
Unlock for access to all 53 flashcards in this deck.
Unlock Deck
k this deck
20
Figure 9-27
The following diagram shows the domestic demand and supply curves in a market.Assume that the world price in this market is $20 per unit.
Refer to Figure 9-27.If the country allows free trade,by how much do consumer surplus,producer surplus,and total surplus change with trade?
The following diagram shows the domestic demand and supply curves in a market.Assume that the world price in this market is $20 per unit.
Refer to Figure 9-27.If the country allows free trade,by how much do consumer surplus,producer surplus,and total surplus change with trade?
Unlock Deck
Unlock for access to all 53 flashcards in this deck.
Unlock Deck
k this deck
21
Figure 9-28
The following diagram shows the domestic demand and domestic supply curves in a market.
Refer to Figure 9-28.Suppose the world price in this market is $6.If the country allows free trade,how much is consumer surplus?
The following diagram shows the domestic demand and domestic supply curves in a market.
Refer to Figure 9-28.Suppose the world price in this market is $6.If the country allows free trade,how much is consumer surplus?
Unlock Deck
Unlock for access to all 53 flashcards in this deck.
Unlock Deck
k this deck
22
Figure 9-28
The following diagram shows the domestic demand and domestic supply curves in a market.
Refer to Figure 9-28.Suppose the world price in this market is $6.If the country allows free trade,how many units will domestic consumers demand,and how many units will domestic producers supply?
The following diagram shows the domestic demand and domestic supply curves in a market.
Refer to Figure 9-28.Suppose the world price in this market is $6.If the country allows free trade,how many units will domestic consumers demand,and how many units will domestic producers supply?
Unlock Deck
Unlock for access to all 53 flashcards in this deck.
Unlock Deck
k this deck
23
Scenario 9-3
Suppose domestic demand and domestic supply in a market are given by the following equations:
Refer to Scenario 9-3.Suppose the world price in this market is $8 per unit.If the country allows free trade,how much are consumer surplus,producer surplus,and producer surplus with trade?
Suppose domestic demand and domestic supply in a market are given by the following equations:
Refer to Scenario 9-3.Suppose the world price in this market is $8 per unit.If the country allows free trade,how much are consumer surplus,producer surplus,and producer surplus with trade?
Unlock Deck
Unlock for access to all 53 flashcards in this deck.
Unlock Deck
k this deck
24
Figure 9-28
The following diagram shows the domestic demand and domestic supply curves in a market.
Refer to Figure 9-28.Suppose the world price in this market is $6.If the country allows free trade,will the country import or export this good,and how many units will be imported/exported?
The following diagram shows the domestic demand and domestic supply curves in a market.
Refer to Figure 9-28.Suppose the world price in this market is $6.If the country allows free trade,will the country import or export this good,and how many units will be imported/exported?
Unlock Deck
Unlock for access to all 53 flashcards in this deck.
Unlock Deck
k this deck
25
Scenario 9-3
Suppose domestic demand and domestic supply in a market are given by the following equations:
Refer to Scenario 9-3.Suppose the world price in this market is $8 per unit.If the country allows free trade,by how much do consumer surplus,producer surplus,and producer surplus change?
Suppose domestic demand and domestic supply in a market are given by the following equations:
Refer to Scenario 9-3.Suppose the world price in this market is $8 per unit.If the country allows free trade,by how much do consumer surplus,producer surplus,and producer surplus change?
Unlock Deck
Unlock for access to all 53 flashcards in this deck.
Unlock Deck
k this deck
26
Scenario 9-3
Suppose domestic demand and domestic supply in a market are given by the following equations:
Refer to Scenario 9-3.With no trade allowed,how much are consumer surplus,producer surplus,and total surplus in this market?
Suppose domestic demand and domestic supply in a market are given by the following equations:
Refer to Scenario 9-3.With no trade allowed,how much are consumer surplus,producer surplus,and total surplus in this market?
Unlock Deck
Unlock for access to all 53 flashcards in this deck.
Unlock Deck
k this deck
27
Figure 9-29
The following diagram shows the domestic demand and domestic supply curves in a market.Assume that the world price in this market is $1 per unit.
Refer to Figure 9-29.With no trade allowed,how much are consumer surplus,producer surplus,and total surplus?
The following diagram shows the domestic demand and domestic supply curves in a market.Assume that the world price in this market is $1 per unit.
Refer to Figure 9-29.With no trade allowed,how much are consumer surplus,producer surplus,and total surplus?
Unlock Deck
Unlock for access to all 53 flashcards in this deck.
Unlock Deck
k this deck
28
Figure 9-28
The following diagram shows the domestic demand and domestic supply curves in a market.
Refer to Figure 9-28.Suppose the world price in this market is $6.If the country allows free trade,how much is total surplus?
The following diagram shows the domestic demand and domestic supply curves in a market.
Refer to Figure 9-28.Suppose the world price in this market is $6.If the country allows free trade,how much is total surplus?
Unlock Deck
Unlock for access to all 53 flashcards in this deck.
Unlock Deck
k this deck
29
Figure 9-29
The following diagram shows the domestic demand and domestic supply curves in a market.Assume that the world price in this market is $1 per unit.
Refer to Figure 9-29.If the country allows free trade,how many units will domestic consumers demand and how many units will domestic producers supply?
The following diagram shows the domestic demand and domestic supply curves in a market.Assume that the world price in this market is $1 per unit.
Refer to Figure 9-29.If the country allows free trade,how many units will domestic consumers demand and how many units will domestic producers supply?
Unlock Deck
Unlock for access to all 53 flashcards in this deck.
Unlock Deck
k this deck
30
Figure 9-29
The following diagram shows the domestic demand and domestic supply curves in a market.Assume that the world price in this market is $1 per unit.
Refer to Figure 9-29.With no trade allowed,what are the equilibrium price and equilibrium quantity in this market?
The following diagram shows the domestic demand and domestic supply curves in a market.Assume that the world price in this market is $1 per unit.
Refer to Figure 9-29.With no trade allowed,what are the equilibrium price and equilibrium quantity in this market?
Unlock Deck
Unlock for access to all 53 flashcards in this deck.
Unlock Deck
k this deck
31
Figure 9-27
The following diagram shows the domestic demand and supply curves in a market.Assume that the world price in this market is $20 per unit.
Refer to Figure 9-27.Suppose the country imposes a $5 per unit tariff.If the country allows trade with a tariff,how much are consumer surplus,producer surplus,tariff revenue,and total surplus?
Unlock Deck
Unlock for access to all 53 flashcards in this deck.
Unlock Deck
k this deck
32
Figure 9-28
The following diagram shows the domestic demand and domestic supply curves in a market.
Refer to Figure 9-28.With no trade allowed,how much are consumer surplus,producer surplus,and total surplus in this market?
The following diagram shows the domestic demand and domestic supply curves in a market.
Refer to Figure 9-28.With no trade allowed,how much are consumer surplus,producer surplus,and total surplus in this market?
Unlock Deck
Unlock for access to all 53 flashcards in this deck.
Unlock Deck
k this deck
33
Scenario 9-3
Suppose domestic demand and domestic supply in a market are given by the following equations:
Refer to Scenario 9-3.With no trade allowed,what are the equilibrium price and quantity in this market?
Suppose domestic demand and domestic supply in a market are given by the following equations:
Refer to Scenario 9-3.With no trade allowed,what are the equilibrium price and quantity in this market?
Unlock Deck
Unlock for access to all 53 flashcards in this deck.
Unlock Deck
k this deck
34
Scenario 9-3
Suppose domestic demand and domestic supply in a market are given by the following equations:
Refer to Scenario 9-3.Suppose the world price in this market is $8 per unit,and suppose the country imposes a $1 per unit tariff.If the country allows trade with a tariff,how much are consumer surplus,producer surplus,tariff revenue,and total surplus?
Unlock Deck
Unlock for access to all 53 flashcards in this deck.
Unlock Deck
k this deck
35
Scenario 9-3
Suppose domestic demand and domestic supply in a market are given by the following equations:
Refer to Scenario 9-3.Suppose the world price in this market is $8 per unit.If the country allows free trade,will the country import or export this good,and how many units will be imported/exported?
Suppose domestic demand and domestic supply in a market are given by the following equations:
Refer to Scenario 9-3.Suppose the world price in this market is $8 per unit.If the country allows free trade,will the country import or export this good,and how many units will be imported/exported?
Unlock Deck
Unlock for access to all 53 flashcards in this deck.
Unlock Deck
k this deck
36
Figure 9-28
The following diagram shows the domestic demand and domestic supply curves in a market.
Refer to Figure 9-28.With no trade allowed,what are the equilibrium price and equilibrium quantity in this market?
The following diagram shows the domestic demand and domestic supply curves in a market.
Refer to Figure 9-28.With no trade allowed,what are the equilibrium price and equilibrium quantity in this market?
Unlock Deck
Unlock for access to all 53 flashcards in this deck.
Unlock Deck
k this deck
37
Figure 9-29
The following diagram shows the domestic demand and domestic supply curves in a market.Assume that the world price in this market is $1 per unit.
Refer to Figure 9-29.If the country allows free trade,will the country import or export this good,and how many units will be imported/exported?
The following diagram shows the domestic demand and domestic supply curves in a market.Assume that the world price in this market is $1 per unit.
Refer to Figure 9-29.If the country allows free trade,will the country import or export this good,and how many units will be imported/exported?
Unlock Deck
Unlock for access to all 53 flashcards in this deck.
Unlock Deck
k this deck
38
Figure 9-28
The following diagram shows the domestic demand and domestic supply curves in a market.
Refer to Figure 9-28.Suppose the world price in this market is $6.If the country allows free trade,how much is producer surplus?
The following diagram shows the domestic demand and domestic supply curves in a market.
Refer to Figure 9-28.Suppose the world price in this market is $6.If the country allows free trade,how much is producer surplus?
Unlock Deck
Unlock for access to all 53 flashcards in this deck.
Unlock Deck
k this deck
39
Scenario 9-3
Suppose domestic demand and domestic supply in a market are given by the following equations:
Refer to Scenario 9-3.Suppose the world price in this market is $8 per unit,and suppose the country imposes a $1 per unit tariff.If the country allows trade with a tariff,how much is the deadweight loss caused by the tariff?
Unlock Deck
Unlock for access to all 53 flashcards in this deck.
Unlock Deck
k this deck
40
Figure 9-27
The following diagram shows the domestic demand and supply curves in a market.Assume that the world price in this market is $20 per unit.
Refer to Figure 9-27.Suppose the country imposes a $5 per unit tariff.If the country allows trade with a tariff,how much is the deadweight loss caused by the tariff?
Unlock Deck
Unlock for access to all 53 flashcards in this deck.
Unlock Deck
k this deck
41
Figure 9-29
The following diagram shows the domestic demand and domestic supply curves in a market.Assume that the world price in this market is $1 per unit.
Refer to Figure 9-29.Suppose the country imposes a $1 per unit tariff.If the country allows trade with a tariff,how much is the deadweight loss caused by the tariff?
Unlock Deck
Unlock for access to all 53 flashcards in this deck.
Unlock Deck
k this deck
42
Figure 9-29
The following diagram shows the domestic demand and domestic supply curves in a market.Assume that the world price in this market is $1 per unit.
Refer to Figure 9-29.Suppose the country imposes a $1 per unit tariff.If the country allows trade with a tariff,how many units will be imported?
The following diagram shows the domestic demand and domestic supply curves in a market.Assume that the world price in this market is $1 per unit.
Refer to Figure 9-29.Suppose the country imposes a $1 per unit tariff.If the country allows trade with a tariff,how many units will be imported?
Unlock Deck
Unlock for access to all 53 flashcards in this deck.
Unlock Deck
k this deck
43
List five arguments given to support trade restrictions.
Unlock Deck
Unlock for access to all 53 flashcards in this deck.
Unlock Deck
k this deck
44
Figure 9-29
The following diagram shows the domestic demand and domestic supply curves in a market.Assume that the world price in this market is $1 per unit.
Refer to Figure 9-29.Suppose the country imposes a $1 per unit tariff.If the country allows trade with a tariff,what will be the domestic price in this market?
Unlock Deck
Unlock for access to all 53 flashcards in this deck.
Unlock Deck
k this deck
45
Figure 9-29
The following diagram shows the domestic demand and domestic supply curves in a market.Assume that the world price in this market is $1 per unit.
Refer to Figure 9-29.Suppose the country imposes a $1 per unit tariff.If the country allows trade with a tariff,how much is tariff revenue?
The following diagram shows the domestic demand and domestic supply curves in a market.Assume that the world price in this market is $1 per unit.
Refer to Figure 9-29.Suppose the country imposes a $1 per unit tariff.If the country allows trade with a tariff,how much is tariff revenue?
Unlock Deck
Unlock for access to all 53 flashcards in this deck.
Unlock Deck
k this deck
46
Figure 9-29
The following diagram shows the domestic demand and domestic supply curves in a market.Assume that the world price in this market is $1 per unit.
Refer to Figure 9-29.Suppose the country imposes a $1 per unit tariff.If the country allows trade with a tariff,how much is total surplus?
The following diagram shows the domestic demand and domestic supply curves in a market.Assume that the world price in this market is $1 per unit.
Refer to Figure 9-29.Suppose the country imposes a $1 per unit tariff.If the country allows trade with a tariff,how much is total surplus?
Unlock Deck
Unlock for access to all 53 flashcards in this deck.
Unlock Deck
k this deck
47
Figure 9-29
The following diagram shows the domestic demand and domestic supply curves in a market.Assume that the world price in this market is $1 per unit.
Refer to Figure 9-29.Suppose the country imposes a $1 per unit tariff.If the country allows trade with a tariff,how many units will domestic consumers demand and how many units will domestic producers supply?
Unlock Deck
Unlock for access to all 53 flashcards in this deck.
Unlock Deck
k this deck
48
How does an import quota differ from an equivalent tariff?
Unlock Deck
Unlock for access to all 53 flashcards in this deck.
Unlock Deck
k this deck
49
Characterize the two different approaches a nation can take to achieve free trade.Does one approach have an advantage over the other?
Unlock Deck
Unlock for access to all 53 flashcards in this deck.
Unlock Deck
k this deck
50
What are the arguments in favor of trade restrictions,and what are the counterarguments? According to most economists,do any of these arguments really justify trade restrictions? Explain.
Unlock Deck
Unlock for access to all 53 flashcards in this deck.
Unlock Deck
k this deck
51
Figure 9-29
The following diagram shows the domestic demand and domestic supply curves in a market.Assume that the world price in this market is $1 per unit.
Refer to Figure 9-29.If the country allows free trade,how much are consumer surplus,producer surplus,and total surplus with trade?
The following diagram shows the domestic demand and domestic supply curves in a market.Assume that the world price in this market is $1 per unit.
Refer to Figure 9-29.If the country allows free trade,how much are consumer surplus,producer surplus,and total surplus with trade?
Unlock Deck
Unlock for access to all 53 flashcards in this deck.
Unlock Deck
k this deck
52
Figure 9-29
The following diagram shows the domestic demand and domestic supply curves in a market.Assume that the world price in this market is $1 per unit.
Refer to Figure 9-29.Suppose the country imposes a $1 per unit tariff.If the country allows trade with a tariff,how much are consumer surplus and producer surplus?
Unlock Deck
Unlock for access to all 53 flashcards in this deck.
Unlock Deck
k this deck
53
List four benefits of international trade.
Unlock Deck
Unlock for access to all 53 flashcards in this deck.
Unlock Deck
k this deck
Unlock Deck
Unlock for access to all 53 flashcards in this deck.


