Deck 6: Comparing Group Means
Full screen (f)
Question
Question
Question
Question
Question
Question
Question
Question
Question
Question
Question
Question
Question
Question
Question
Question
Question
Question
Question
Question
Question
Question
Answer the questions that follow this SPSS output:
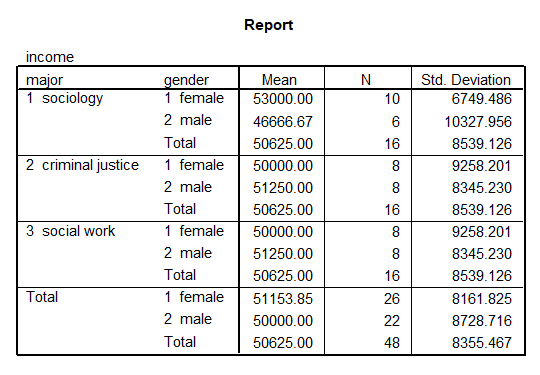
A) What is the mean income of female sociology majors? __________
B) Which subgroup has the greatest variability on income? (Specify the major and the gender of the subgroup.) _______________
C) Is there an interaction effect of gender and major on income? (yes/no)
D) State the numerical evidence that supports your conclusion about an interaction effect.
Question
Answer the questions that follow this SPSS output:
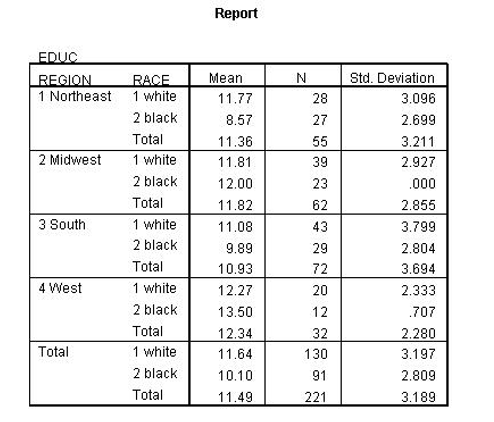
A) What is the mean years of schooling (EDUC) of blacks in the Midwest? __________
B) In the West, is there more variability in the years of schooling (EDUC) among whites or among blacks? (whites/blacks) _______________
C) Is there an interaction effect of REGION and RACE on EDUC? (yes/no) _______
D) State numerical evidence that justifies your conclusion about an interaction effect of REGION and RACE on EDUC.
Question
Answer the questions that follow this SPSS output:
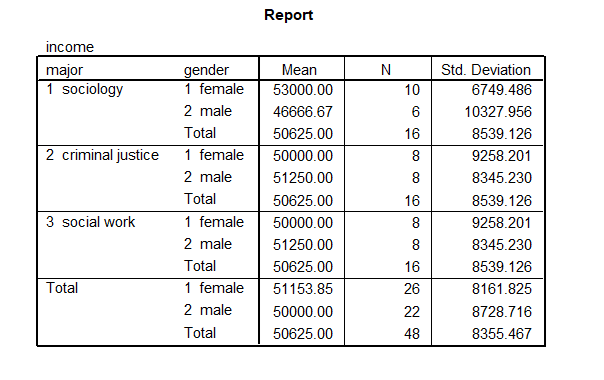
A) What is the mean income of female social work majors? __________
B) Which subgroup has the greatest variability on income? (Specify the major and the gender of the subgroup.) _______________
C) Is there a main effect for gender? (yes/no)
D) State the numerical evidence that supports your conclusion about a main effect for gender.
Question
Answer the questions that follow this SPSS output:
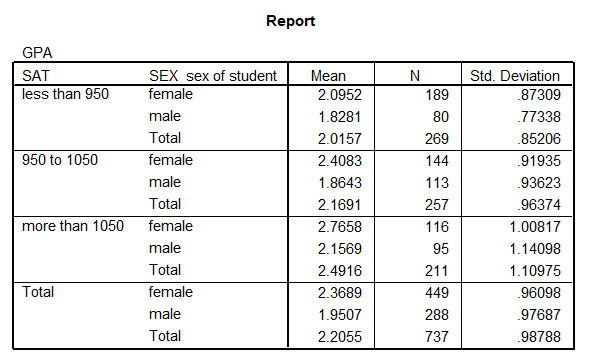
A) What is the mean GPA of female students with less than a 950 SAT score? __________
B) Which subgroup has the greatest variability on GPA? (Specify the SAT category and the gender of the subgroup.) _______________
C) Is there a main effect for SAT? (yes/no)
D) State the numerical evidence that supports your conclusion about a main effect for SAT.

Unlock Deck
Sign up to unlock the cards in this deck!
Unlock Deck
Unlock Deck
1/25
Play
Full screen (f)
Deck 6: Comparing Group Means
1
What does layering independent variables do?
Layering allows you to divide groups into subgroups by introducing an additional independent variable or factor.
2
What kinds of questions can you answer using the Means procedure?
How do the averages differ by group? Which group is highest? Which lowest? Which group is most homogeneous? Most heterogeneous? Are differences between subgroups similar or different across groups?
3
A(n) _____ is when there are differences in means on the dependent variable for groups formed by the attributes of an independent variable.
A) interaction effect
B) main effect
C) net effect
D) symmetry
A) interaction effect
B) main effect
C) net effect
D) symmetry
main effect
4
You want to compare groups on an interval/ratio variable (for example, the average SAT score of students at different colleges). Which SPSS procedure should you run?
A) Display Data File Information
B) Explore
C) Frequencies
D) Means
(Note: * indicates
A) Display Data File Information
B) Explore
C) Frequencies
D) Means
(Note: * indicates
Unlock Deck
Unlock for access to all 25 flashcards in this deck.
Unlock Deck
k this deck
5
Based on the following output, which subgroup had the greatest variability in HOURS worked?
A) never-married males
B) currently-married males
C) currently-married females
D) divorced, separated, and widowed females
A) never-married males
B) currently-married males
C) currently-married females
D) divorced, separated, and widowed females
Unlock Deck
Unlock for access to all 25 flashcards in this deck.
Unlock Deck
k this deck
6
Based on the following output, which group had the greatest variability in EDUC (years of schooling)?
A) 1980 GSS young adults
B) 1980 GSS middle-age adults
C) 2010 GSS young adults
D) 2010 GSS middle-age adults
A) 1980 GSS young adults
B) 1980 GSS middle-age adults
C) 2010 GSS young adults
D) 2010 GSS middle-age adults
Unlock Deck
Unlock for access to all 25 flashcards in this deck.
Unlock Deck
k this deck
7
Based on the following output, which subgroup averaged the least EDUC (years of schooling)?
A) 1980 GSS young men
B) 1980 GSS middle-age men
C) 2010 GSS young women
D) 2010 GSS middle-age women
A) 1980 GSS young men
B) 1980 GSS middle-age men
C) 2010 GSS young women
D) 2010 GSS middle-age women
Unlock Deck
Unlock for access to all 25 flashcards in this deck.
Unlock Deck
k this deck
8
A(n) _____ is when the size and/or direction of one independent variable's effect on the dependent variable varies depending on the value of one or more other independent variables.
A) asymmetry
B) correlation
C) interaction effect
D) main effect
A) asymmetry
B) correlation
C) interaction effect
D) main effect
Unlock Deck
Unlock for access to all 25 flashcards in this deck.
Unlock Deck
k this deck
9
You've taken a poll of probable primary election voters to see which of five candidates they prefer. Which SPSS procedure should you run?
A) Descriptives
B) Display Data File Information
C) Frequencies
D) Means
A) Descriptives
B) Display Data File Information
C) Frequencies
D) Means
Unlock Deck
Unlock for access to all 25 flashcards in this deck.
Unlock Deck
k this deck
10
What is the lowest level of measurement permissible for the variable that is averaged for each group in the Means procedure?
A) nominal
B) ordinal
C) interval/ratio
A) nominal
B) ordinal
C) interval/ratio
Unlock Deck
Unlock for access to all 25 flashcards in this deck.
Unlock Deck
k this deck
11
In the Means procedure, the lowest level of measurement that the independent variable (the variable that is used to create the groups) can be is
A) nominal
B) ordinal
C) interval/ratio
A) nominal
B) ordinal
C) interval/ratio
Unlock Deck
Unlock for access to all 25 flashcards in this deck.
Unlock Deck
k this deck
12
You want to see if average life expectancy differs by occupation and within occupations by race. Race should be the _____ when setting up the Means procedure.
A) dependent variable
B) 1st layer independent variable
C) 2nd layer independent variable
D) 3rd layer independent variable
A) dependent variable
B) 1st layer independent variable
C) 2nd layer independent variable
D) 3rd layer independent variable
Unlock Deck
Unlock for access to all 25 flashcards in this deck.
Unlock Deck
k this deck
13
You are doing a Means procedure. Your dependent variable, INCOME, is a continuous variable; your 1st layer independent variable, REGION, has 4 categories; your 2nd layer independent variable, DEGREE, has 3 categories. How many REGION by DEGREE subgroups will your analysis have?
A) 3
B) 4
C) 12
D) an infinite number
A) 3
B) 4
C) 12
D) an infinite number
Unlock Deck
Unlock for access to all 25 flashcards in this deck.
Unlock Deck
k this deck
14
Based on the following output, which conclusion is correct?
A) 1980 GSS young adults averaged 2.622 TVHOURS.
B) 1980 GSS middle-age adults had the highest average TVHOURS.
C) 2010 GSS young adults were the largest of the groups.
D) 2010 GSS middle-age adults had the greatest variability in TVHOURS.
A) 1980 GSS young adults averaged 2.622 TVHOURS.
B) 1980 GSS middle-age adults had the highest average TVHOURS.
C) 2010 GSS young adults were the largest of the groups.
D) 2010 GSS middle-age adults had the greatest variability in TVHOURS.
Unlock Deck
Unlock for access to all 25 flashcards in this deck.
Unlock Deck
k this deck
15
What is an interaction effect?
Unlock Deck
Unlock for access to all 25 flashcards in this deck.
Unlock Deck
k this deck
16
Based on the following output, which conclusion is correct?
A) For every group, women averaged more TVHOURS than men.
B) For every group, there was more variability among women than men on TVHOURS.
C) For every group, there were more women than men.
D) No group averaged more than 3.50 TVHOURS.
A) For every group, women averaged more TVHOURS than men.
B) For every group, there was more variability among women than men on TVHOURS.
C) For every group, there were more women than men.
D) No group averaged more than 3.50 TVHOURS.
Unlock Deck
Unlock for access to all 25 flashcards in this deck.
Unlock Deck
k this deck
17
You want to see the size and direction of the gender gap in education for each geographic region. Which SPSS procedure should you run?
A) Descriptives
B) Explore
C) Frequencies
D) Means
A) Descriptives
B) Explore
C) Frequencies
D) Means
Unlock Deck
Unlock for access to all 25 flashcards in this deck.
Unlock Deck
k this deck
18
Based on the following output, which conclusion is correct?
A) In each marital status, men average more HOURS worked than women.
B) Never-married females averaged 39.79 HOURS worked.
C) There was more variability in HOURS worked among never-married females than never-married males.
D) For males, the marital status with the highest average HOURS worked was divorced, widowed, or separated.
Unlock Deck
Unlock for access to all 25 flashcards in this deck.
Unlock Deck
k this deck
19
If there is a main effect of gender on income, that means
A) gender has no relationship to income
B) gender groups differ on average income
C) income causes gender
D) when gender is controlled, income differences still exist
A) gender has no relationship to income
B) gender groups differ on average income
C) income causes gender
D) when gender is controlled, income differences still exist
Unlock Deck
Unlock for access to all 25 flashcards in this deck.
Unlock Deck
k this deck
20
You want to describe what the cases in your data set are like on the single variable RELIGION. Which SPSS procedure should you run?
A) Display Data File Information
B) Frequencies
C) Means
A) Display Data File Information
B) Frequencies
C) Means
Unlock Deck
Unlock for access to all 25 flashcards in this deck.
Unlock Deck
k this deck
21
What is the lowest level of measurement you can use in the Means procedure for
A) The dependent variable? __________
B) The 1st layer independent variable? __________
C) The 2nd layer independent variable? __________
A) The dependent variable? __________
B) The 1st layer independent variable? __________
C) The 2nd layer independent variable? __________
Unlock Deck
Unlock for access to all 25 flashcards in this deck.
Unlock Deck
k this deck
22
Answer the questions that follow this SPSS output:
A) What is the mean income of female sociology majors? __________
B) Which subgroup has the greatest variability on income? (Specify the major and the gender of the subgroup.) _______________
C) Is there an interaction effect of gender and major on income? (yes/no)
D) State the numerical evidence that supports your conclusion about an interaction effect.
Unlock Deck
Unlock for access to all 25 flashcards in this deck.
Unlock Deck
k this deck
23
Answer the questions that follow this SPSS output:
A) What is the mean years of schooling (EDUC) of blacks in the Midwest? __________
B) In the West, is there more variability in the years of schooling (EDUC) among whites or among blacks? (whites/blacks) _______________
C) Is there an interaction effect of REGION and RACE on EDUC? (yes/no) _______
D) State numerical evidence that justifies your conclusion about an interaction effect of REGION and RACE on EDUC.
Unlock Deck
Unlock for access to all 25 flashcards in this deck.
Unlock Deck
k this deck
24
Answer the questions that follow this SPSS output:
A) What is the mean income of female social work majors? __________
B) Which subgroup has the greatest variability on income? (Specify the major and the gender of the subgroup.) _______________
C) Is there a main effect for gender? (yes/no)
D) State the numerical evidence that supports your conclusion about a main effect for gender.
Unlock Deck
Unlock for access to all 25 flashcards in this deck.
Unlock Deck
k this deck
25
Answer the questions that follow this SPSS output:
A) What is the mean GPA of female students with less than a 950 SAT score? __________
B) Which subgroup has the greatest variability on GPA? (Specify the SAT category and the gender of the subgroup.) _______________
C) Is there a main effect for SAT? (yes/no)
D) State the numerical evidence that supports your conclusion about a main effect for SAT.
Unlock Deck
Unlock for access to all 25 flashcards in this deck.
Unlock Deck
k this deck
Unlock Deck
Unlock for access to all 25 flashcards in this deck.


