Deck 13: Paired and Independent-Samples T Tests
Full screen (f)
Question
Question
Question
Question
Question
Question
Question
Question
Question
Question
Question
Question
Question
Question
Question
Question
Question
Question
Question
Question
Question
Question
Question
Question
Question
Question
Question
Question
Question
Question
Question
Question
Question
Question
Question
Question
Question
Question
Question
Question
Question
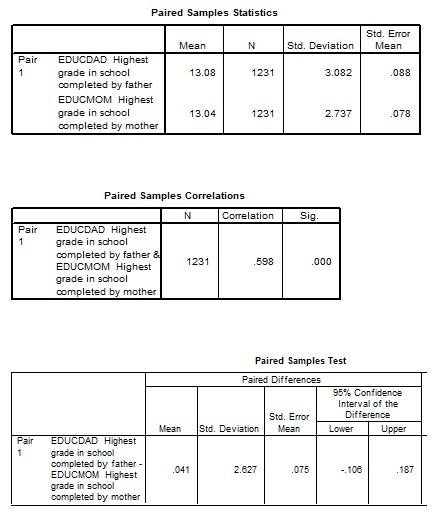
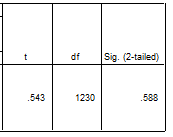
Answer the questions that follow this SPSS output:
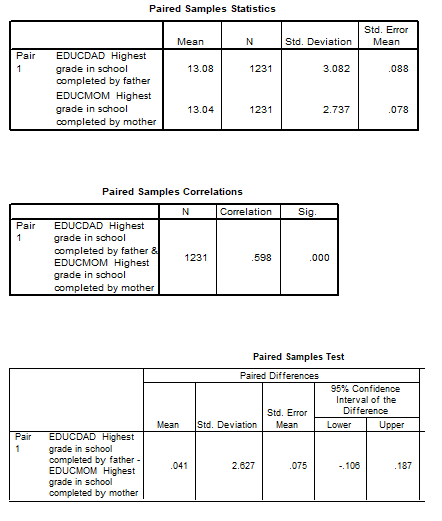
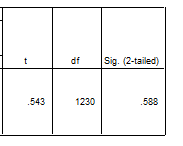
"Your research hypothesis is "In the population, persons' mothers average more years of schooling than do their fathers." (¯EDUCMOM>¯EDUCDAD)
A) State the null hypothesis being tested.
B) Is this a one-tailed or two-tailed hypothesis?
C) Are your sample results consistent with the null hypothesis or the research hypothesis? (null / research)
D) What is the probability of getting the sample results you got if the null hypothesis is true? (If this step in hypothesis testing can be skipped, write the word "SKIP".)
E) What is your conclusion? (In other words, do you "reject" or "not reject" the null hypothesis based on these results?)
F) Are your results statistically significant? (yes / no)
Question
Answer the questions that follow this SPSS output:
Your research hypothesis is "In the population, there is a difference in the average SAT scores of persons who attended small high schools and persons who attended large high schools." (¯EDUCMOM≤¯EDUCDAD)
A) State the null hypothesis being tested.
B) Is this a one-tailed or two-tailed hypothesis?
C) Are your sample results consistent with the null hypothesis or the research hypothesis? (null / research)
D) What is the significance level? (If this step in hypothesis testing can be skipped, write the word "SKIP".)
E) What is your conclusion? (In other words, do you "reject" or "not reject" the null hypothesis based on these results?)
F) Are your results statistically significant? (yes / no)
Question
Answer the questions that follow this SPSS output:
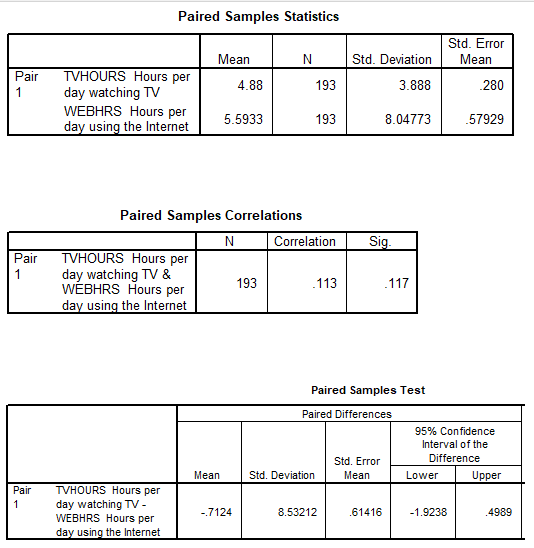
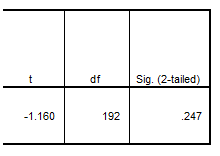
Your research hypothesis is "In the population, the average number of hours of TV watched is less than the average number of hours spent using the Internet." ((TVHOURS) ̅<(WEBHRS) ̅)
A) State the null hypothesis being tested.
B) Is this a one-tailed or two-tailed hypothesis?
C) Are your sample results consistent with the null hypothesis or the research hypothesis? (null / research)
D) What is the probability of getting the sample results you got if the null hypothesis is true? (If this step in hypothesis testing can be skipped, write the word "SKIP".)
E) What is your conclusion? (In other words, do you "reject" or "not reject" the null hypothesis based on these results?)
F) Are your results statistically significant? (yes / no)
Question
Answer the questions that follow this SPSS output:
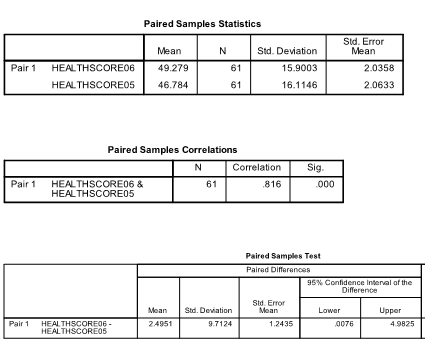
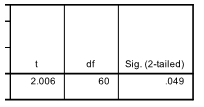
Your research hypothesis is "In the population, restaurants' average health inspection score in 2006 (HEALTHSCORE06) was higher than the average for those same restaurants in 2005 (HEALTHSCORE05)". (¯HEALTHSCORE06>¯HEALTHSCORE05)
A) State the null hypothesis being tested.
B) Is this a one-tailed or two-tailed hypothesis?
C) Are your sample results consistent with the null hypothesis or the research hypothesis? (null / research)
D) What is the probability of getting the sample results you got if the null hypothesis is true? (If this step in hypothesis testing can be skipped, write the word "SKIP".)
E) What is your conclusion? (In other words, do you "reject" or "not reject" the null hypothesis based on these results?)
F) Are your results statistically significant? (yes / no)
Question
Answer the questions that follow this SPSS output:
Your research hypothesis is "In the population, persons with 16 years of schooling average more children than persons with 20 years of schooling." ( )
A) State the null hypothesis being tested.
B) Is this a one-tailed or two-tailed hypothesis?
C) Are your sample results consistent with the null hypothesis or the research hypothesis? (null / research)
D) What is the significance level? (If this step in hypothesis testing can be skipped, write the word "SKIP".)
E) What is your conclusion? (In other words, do you "reject" or "not reject" the null hypothesis based on these results?)
F) Are your results statistically significant? (yes / no)
Question
Answer the questions that follow this SPSS output:
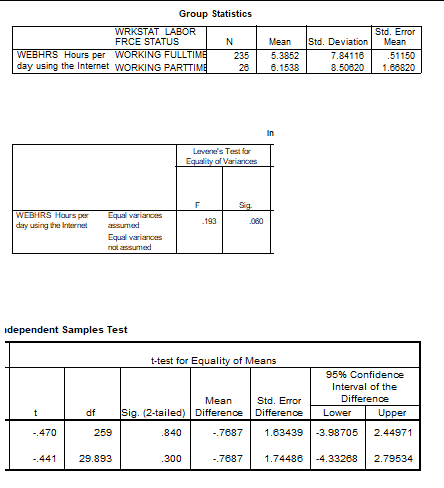
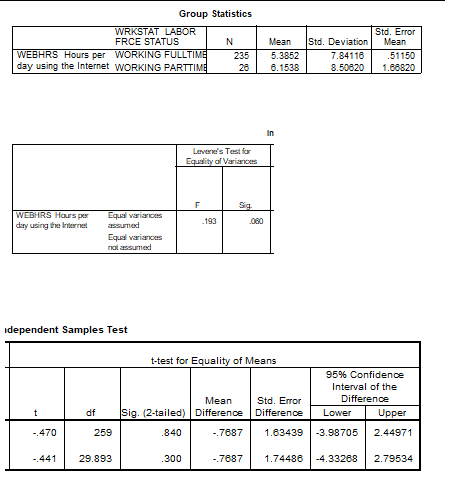
Your research hypothesis is "In the population, the average number of hours spent using the Internet by full-time workers is greater than by part-time workers." (¯HEALTHSCORE06≤¯HEALTHSCORE05)
A) State the null hypothesis being tested.
B) Is this a one-tailed or two-tailed hypothesis?
C) Are your sample results consistent with the null hypothesis or the research hypothesis? (null / research)
D) What is the significance level? (If this step in hypothesis testing can be skipped, write the word "SKIP".)
E) What is your conclusion? (In other words, do you "reject" or "not reject" the null hypothesis based on these results?)
F) Are your results statistically significant? (yes / no)
Question
Answer the questions that follow this SPSS output:
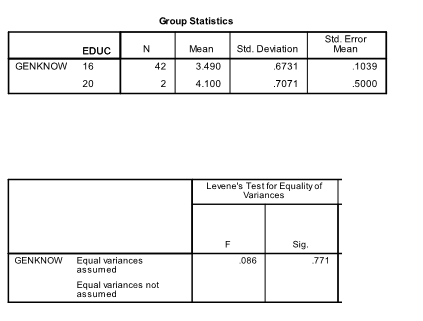
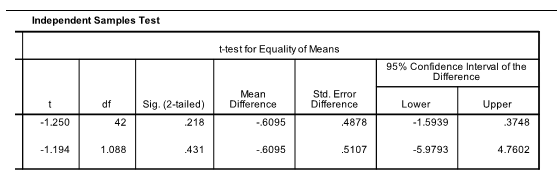
Your research hypothesis is "On average, persons in the population with 16 years of schooling have less general knowledge (GENKNOW) than persons with 20 years of schooling." (¯(〖GENKNOW〗_16 )<¯(〖GENKNOW〗_20 ) )
A) State the null hypothesis being tested.
B) Is this a one-tailed or two-tailed hypothesis?
C) Are your sample results consistent with the null hypothesis or the research hypothesis? (null / research)
D) What is the significance level? (If this step in hypothesis testing can be skipped, write the word "SKIP".)
E) What is your conclusion? (In other words, do you "reject" or "not reject" the null hypothesis based on these results?)
F) Are your results statistically significant? (yes / no)
Question
Question
Answer the questions that follow this SPSS output:
Your research hypothesis is "In the population, the average on the POSTTEST is higher than the average on the PRETEST." ( (POSTTEST) ̅>(PRETEST) ̅)
A) State the null hypothesis being tested.
B) Is this a one-tailed or two-tailed hypothesis?
C) Are your sample results consistent with the null hypothesis or the research hypothesis? (null / research)
D) What is the probability of getting the sample results you got if the null hypothesis is true? (If this step in hypothesis testing can be skipped, write the word "SKIP".)
E) What is your conclusion? (In other words, do you "reject" or "not reject" the null hypothesis based on these results?)
F) Are your results statistically significant? (yes / no)

Unlock Deck
Sign up to unlock the cards in this deck!
Unlock Deck
Unlock Deck
1/49
Play
Full screen (f)
Deck 13: Paired and Independent-Samples T Tests
1
Two researchers measure attitudes toward capital punishment in the year 2000 and again in the year 2005. One researcher uses a panel study design (the same persons are questioned in 2000 and in 2005); the other uses a trend study design (different samples from the population are questioned in 2000 and 2005). In analyzing the data that was collected,
A) both researchers should use paired-sample t tests
B) both researchers should use independent-samples t tests
C) the panel study researcher should use paired-sample t tests but the trend study researcher should use independent-samples t tests
D) the panel study researcher should use independent-samples t tests but the trend study researcher should use paired-samples t tests
the panel study researcher should use paired-sample t tests but the trend study researcher should use independent-samples t tests
2
You are testing a two-tailed hypothesis. Your SPSS output tells you that the two-tailed significance level of a particular t statistic is .01. What is the probability of making a Type I error if you reject the null hypothesis?
A) .99
B) .05
C) .01
D) cannot be determined
A) .99
B) .05
C) .01
D) cannot be determined
.01
3
Which would be an appropriate statistical procedure to test the hypothesis that Americans listen to radio an average of 200 minutes a day?
A) independent-samples t test
B) one-sample t test
C) paired-samples t test
A) independent-samples t test
B) one-sample t test
C) paired-samples t test
one-sample t test
4
You are doing a paired-samples t test with 694 valid cases. How many degrees of freedom will the t test have?
A) 692
B) 693
C) 694
D) 695
A) 692
B) 693
C) 694
D) 695
Unlock Deck
Unlock for access to all 49 flashcards in this deck.
Unlock Deck
k this deck
5
Without computing any new variables, which would be an appropriate statistical procedure to test the hypothesis that, on average, college students listen to less radio than they did when they were high school students?
A) independent-samples t test
B) one-sample t test
C) paired-samples t test
A) independent-samples t test
B) one-sample t test
C) paired-samples t test
Unlock Deck
Unlock for access to all 49 flashcards in this deck.
Unlock Deck
k this deck
6
You are doing a paired-samples t test. What level of measurement is required on the variables you are using?
A) They must be nominal.
B) They must be ordinal.
C) They must be interval/ratio.
D) They can be any level of measurement.
A) They must be nominal.
B) They must be ordinal.
C) They must be interval/ratio.
D) They can be any level of measurement.
Unlock Deck
Unlock for access to all 49 flashcards in this deck.
Unlock Deck
k this deck
7
What is the largest risk of making a Type I error that social scientists will usually take?
A) 5% chance
B) 68% chance
C) 95% chance
D) 99.7% chance
A) 5% chance
B) 68% chance
C) 95% chance
D) 99.7% chance
Unlock Deck
Unlock for access to all 49 flashcards in this deck.
Unlock Deck
k this deck
8
An author reports the following information about a two-tailed paired-samples t test: t = 5.43, df = 83, p = .001. Which of the following is true?
A) There were 82 valid cases.
B) The null hypothesis was rejected
C) The two means were not significantly different.
D) All of the above are true.
A) There were 82 valid cases.
B) The null hypothesis was rejected
C) The two means were not significantly different.
D) All of the above are true.
Unlock Deck
Unlock for access to all 49 flashcards in this deck.
Unlock Deck
k this deck
9
Which of the following correctly describes a Type I error?
A) not rejecting a null hypothesis that is false
B) not rejecting a null hypothesis that is true
C) rejecting a null hypothesis that is false
D) rejecting a null hypothesis that is true
A) not rejecting a null hypothesis that is false
B) not rejecting a null hypothesis that is true
C) rejecting a null hypothesis that is false
D) rejecting a null hypothesis that is true
Unlock Deck
Unlock for access to all 49 flashcards in this deck.
Unlock Deck
k this deck
10
Which of the following hypotheses should be tested using a paired-samples t test?
A) The average posttest score was 78.
B) Women had the same average pretest score as men.
C) On average, persons' posttest scores were the same as their pretest scores.
D) Pretest and posttest scores were not correlated.
A) The average posttest score was 78.
B) Women had the same average pretest score as men.
C) On average, persons' posttest scores were the same as their pretest scores.
D) Pretest and posttest scores were not correlated.
Unlock Deck
Unlock for access to all 49 flashcards in this deck.
Unlock Deck
k this deck
11
For an independent-samples t test, the test variable (the variable whose values will be averaged for each group) can be what level of measurement?
A) only interval/ratio
B) either interval/ratio or ordinal
C) interval/ratio, ordinal, or nominal
A) only interval/ratio
B) either interval/ratio or ordinal
C) interval/ratio, ordinal, or nominal
Unlock Deck
Unlock for access to all 49 flashcards in this deck.
Unlock Deck
k this deck
12
Any paired-samples t test could also be tested as a(n)
A) crosstab
B) independent-samples t test
C) multiple regression
D) one-sample t test
A) crosstab
B) independent-samples t test
C) multiple regression
D) one-sample t test
Unlock Deck
Unlock for access to all 49 flashcards in this deck.
Unlock Deck
k this deck
13
Your independent-samples t test research hypothesis is that, when asked the ideal number of children to have, men report a higher average than women. The following results are consistent with the _____ and you proceed to _____.
A) null hypothesis … Step 3 (check significance level)
B) null hypothesis … Step 4 (state conclusion)
C) research hypothesis … Step 3 (check significance level)
D) research hypothesis … Step 4 (state conclusion)
A) null hypothesis … Step 3 (check significance level)
B) null hypothesis … Step 4 (state conclusion)
C) research hypothesis … Step 3 (check significance level)
D) research hypothesis … Step 4 (state conclusion)
Unlock Deck
Unlock for access to all 49 flashcards in this deck.
Unlock Deck
k this deck
14
You are doing a two-tailed paired-samples t test and your results are statistically significant. The phrase "statistical significance" means the same as which of the following?
A) There is a large difference between the means in the population.
B) There is an important difference between the means in the population.
C) You are willing to reject the claim that there is no difference between the means in the population.
D) You are NOT willing to reject the claim that there is no difference between the means in the population.
Unlock Deck
Unlock for access to all 49 flashcards in this deck.
Unlock Deck
k this deck
15
Which of the following hypotheses should be tested using an independent-samples t test?
A) The average posttest score was 78.
B) Women had the same average pretest score as men.
C) On average, persons' posttest scores were the same as their pretest scores.
D) Pretest and posttest scores were not correlated.
A) The average posttest score was 78.
B) Women had the same average pretest score as men.
C) On average, persons' posttest scores were the same as their pretest scores.
D) Pretest and posttest scores were not correlated.
Unlock Deck
Unlock for access to all 49 flashcards in this deck.
Unlock Deck
k this deck
16
An author reports the following information about a one-tailed independent-samples t test: t = 1.71, df = 17, p = .111. The sample means were consistent with the research hypothesis. Which of the following is true?
A) The two-tailed significance level must have been .222.
B) The null hypothesis was rejected
C) The two groups were significantly different.
D) All of the above are true.
A) The two-tailed significance level must have been .222.
B) The null hypothesis was rejected
C) The two groups were significantly different.
D) All of the above are true.
Unlock Deck
Unlock for access to all 49 flashcards in this deck.
Unlock Deck
k this deck
17
For an independent-samples t test, the grouping variable (the variable whose attributes are used to identify the two groups to be compared) can be what level of measurement?
A) only interval/ratio
B) either interval/ratio or ordinal
C) interval/ratio, ordinal, or nominal
A) only interval/ratio
B) either interval/ratio or ordinal
C) interval/ratio, ordinal, or nominal
Unlock Deck
Unlock for access to all 49 flashcards in this deck.
Unlock Deck
k this deck
18
Your paired-samples t test research hypothesis is that, on average, persons wish they had fewer children (KIDSBEST) than they actually have (CHILDREN). The following results are consistent with the _____ and you proceed to _____.
A) null hypothesis … Step 3 (check significance level)
B) null hypothesis … Step 4 (state conclusion)
C) research hypothesis … Step 3 (check significance level)
D) research hypothesis … Step 4 (state conclusion)
A) null hypothesis … Step 3 (check significance level)
B) null hypothesis … Step 4 (state conclusion)
C) research hypothesis … Step 3 (check significance level)
D) research hypothesis … Step 4 (state conclusion)
Unlock Deck
Unlock for access to all 49 flashcards in this deck.
Unlock Deck
k this deck
19
If the significance level of Levene's Test is.050 or less,
A) you cannot test the null hypothesis as an independent-samples t test
B) you ignore the significance level of the t test, go to Step 4, and reject the null hypothesis
C) you use the upper line of results (Equal variances assumed)
D) you use the lower line of results (Equal variances not assumed)
A) you cannot test the null hypothesis as an independent-samples t test
B) you ignore the significance level of the t test, go to Step 4, and reject the null hypothesis
C) you use the upper line of results (Equal variances assumed)
D) you use the lower line of results (Equal variances not assumed)
Unlock Deck
Unlock for access to all 49 flashcards in this deck.
Unlock Deck
k this deck
20
You are testing a one-tailed paired-samples t test hypothesis. The sample means were consistent with the research hypothesis. Based on the following results, the significance level is _____ and you _____ the null hypothesis.
A) .056 … do not reject
B) .112 … do not reject
C) .112 … reject
D) .224 … do not reject
A) .056 … do not reject
B) .112 … do not reject
C) .112 … reject
D) .224 … do not reject
Unlock Deck
Unlock for access to all 49 flashcards in this deck.
Unlock Deck
k this deck
21
If the mean IQ of a sample of right-handed persons is significantly higher than the mean IQ of a sample of left-handed persons, then which of the following must be true?
A) All right-handed persons must have higher IQs than all left-handed persons.
B) Most right-handed persons must have higher IQs than most left-handed persons.
C) The median IQ of right-handed persons must be higher than the median IQ of left-handed persons.
D) None of the above must be true.
A) All right-handed persons must have higher IQs than all left-handed persons.
B) Most right-handed persons must have higher IQs than most left-handed persons.
C) The median IQ of right-handed persons must be higher than the median IQ of left-handed persons.
D) None of the above must be true.
Unlock Deck
Unlock for access to all 49 flashcards in this deck.
Unlock Deck
k this deck
22
Independent-samples t tests compare means for how many variables for how many groups of cases?
Unlock Deck
Unlock for access to all 49 flashcards in this deck.
Unlock Deck
k this deck
23
Write a research hypothesis and its companion null hypothesis that could be tested with a paired-samples t test.
Unlock Deck
Unlock for access to all 49 flashcards in this deck.
Unlock Deck
k this deck
24
If the significance of Levene's test is greater than .05, are "equal variances assumed" or "equal variances not assumed" for the independent-samples t test?
Unlock Deck
Unlock for access to all 49 flashcards in this deck.
Unlock Deck
k this deck
25
What kinds of questions can you answer using an independent-samples t test?
Unlock Deck
Unlock for access to all 49 flashcards in this deck.
Unlock Deck
k this deck
26
Which of the following correctly describes a Type II error?
A) not rejecting a null hypothesis that is false
B) not rejecting a null hypothesis that is true
C) rejecting a null hypothesis that is false
D) rejecting a null hypothesis that is true
A) not rejecting a null hypothesis that is false
B) not rejecting a null hypothesis that is true
C) rejecting a null hypothesis that is false
D) rejecting a null hypothesis that is true
Unlock Deck
Unlock for access to all 49 flashcards in this deck.
Unlock Deck
k this deck
27
Paired-samples t tests compare means for how many variables for how many groups of cases?
Unlock Deck
Unlock for access to all 49 flashcards in this deck.
Unlock Deck
k this deck
28
Which would be an appropriate statistical procedure to test the hypothesis that, on average, Democrats listen to more radio than Republicans?
A) independent-samples t test
B) one-sample t test
C) paired-samples t test
A) independent-samples t test
B) one-sample t test
C) paired-samples t test
Unlock Deck
Unlock for access to all 49 flashcards in this deck.
Unlock Deck
k this deck
29
Which one of the following is NOT a correct description of the number obtained at Step 3 in hypothesis testing?
A) the probability of making a Type I error if you reject the null hypothesis
B) the probability of making a Type II error if you do not reject the null hypothesis
C) the probability of getting the sample results you got if the null hypothesis is true
D) the significance level
A) the probability of making a Type I error if you reject the null hypothesis
B) the probability of making a Type II error if you do not reject the null hypothesis
C) the probability of getting the sample results you got if the null hypothesis is true
D) the significance level
Unlock Deck
Unlock for access to all 49 flashcards in this deck.
Unlock Deck
k this deck
30
When does a researcher risk making a Type II error?
Unlock Deck
Unlock for access to all 49 flashcards in this deck.
Unlock Deck
k this deck
31
You are testing a one-tailed independent-samples t test hypothesis. The sample results are consistent with the research hypothesis. Based on the following results, the significance level is _____ and you _____ the null hypothesis.
A) .701 … do not reject
B) .698 … do not reject
C) .3505 … do not reject
D) .349 … do not reject
A) .701 … do not reject
B) .698 … do not reject
C) .3505 … do not reject
D) .349 … do not reject
Unlock Deck
Unlock for access to all 49 flashcards in this deck.
Unlock Deck
k this deck
32
Why are paired samples called that?
Unlock Deck
Unlock for access to all 49 flashcards in this deck.
Unlock Deck
k this deck
33
Can two frequency distributions substantially overlap if their means are significantly different? Explain.
Unlock Deck
Unlock for access to all 49 flashcards in this deck.
Unlock Deck
k this deck
34
What kinds of questions can you answer using a paired-samples t test?
Unlock Deck
Unlock for access to all 49 flashcards in this deck.
Unlock Deck
k this deck
35
A researcher does a paired-samples t test with 39 cases. How many degrees of freedom does the t test have? __________
Unlock Deck
Unlock for access to all 49 flashcards in this deck.
Unlock Deck
k this deck
36
A researcher has done a paired-samples t-test. She reports the test's degrees of freedom to be 100. How many cases were there in the sample? __________
Unlock Deck
Unlock for access to all 49 flashcards in this deck.
Unlock Deck
k this deck
37
When does a researcher risk making a Type I error?
Unlock Deck
Unlock for access to all 49 flashcards in this deck.
Unlock Deck
k this deck
38
Write a research hypothesis and its companion null hypothesis that could be tested with an independent-samples t test.
Unlock Deck
Unlock for access to all 49 flashcards in this deck.
Unlock Deck
k this deck
39
Does statistical significance indicate substantive importance? Explain.
Unlock Deck
Unlock for access to all 49 flashcards in this deck.
Unlock Deck
k this deck
40
Why are independent samples called that?
Unlock Deck
Unlock for access to all 49 flashcards in this deck.
Unlock Deck
k this deck
41
Answer the questions that follow this SPSS output:
"Your research hypothesis is "In the population, persons' mothers average more years of schooling than do their fathers." (¯EDUCMOM>¯EDUCDAD)
A) State the null hypothesis being tested.
B) Is this a one-tailed or two-tailed hypothesis?
C) Are your sample results consistent with the null hypothesis or the research hypothesis? (null / research)
D) What is the probability of getting the sample results you got if the null hypothesis is true? (If this step in hypothesis testing can be skipped, write the word "SKIP".)
E) What is your conclusion? (In other words, do you "reject" or "not reject" the null hypothesis based on these results?)
F) Are your results statistically significant? (yes / no)
Unlock Deck
Unlock for access to all 49 flashcards in this deck.
Unlock Deck
k this deck
42
Answer the questions that follow this SPSS output:
Your research hypothesis is "In the population, there is a difference in the average SAT scores of persons who attended small high schools and persons who attended large high schools." (¯EDUCMOM≤¯EDUCDAD)
A) State the null hypothesis being tested.
B) Is this a one-tailed or two-tailed hypothesis?
C) Are your sample results consistent with the null hypothesis or the research hypothesis? (null / research)
D) What is the significance level? (If this step in hypothesis testing can be skipped, write the word "SKIP".)
E) What is your conclusion? (In other words, do you "reject" or "not reject" the null hypothesis based on these results?)
F) Are your results statistically significant? (yes / no)
Unlock Deck
Unlock for access to all 49 flashcards in this deck.
Unlock Deck
k this deck
43
Answer the questions that follow this SPSS output:
Your research hypothesis is "In the population, the average number of hours of TV watched is less than the average number of hours spent using the Internet." ((TVHOURS) ̅<(WEBHRS) ̅)
A) State the null hypothesis being tested.
B) Is this a one-tailed or two-tailed hypothesis?
C) Are your sample results consistent with the null hypothesis or the research hypothesis? (null / research)
D) What is the probability of getting the sample results you got if the null hypothesis is true? (If this step in hypothesis testing can be skipped, write the word "SKIP".)
E) What is your conclusion? (In other words, do you "reject" or "not reject" the null hypothesis based on these results?)
F) Are your results statistically significant? (yes / no)
Unlock Deck
Unlock for access to all 49 flashcards in this deck.
Unlock Deck
k this deck
44
Answer the questions that follow this SPSS output:
Your research hypothesis is "In the population, restaurants' average health inspection score in 2006 (HEALTHSCORE06) was higher than the average for those same restaurants in 2005 (HEALTHSCORE05)". (¯HEALTHSCORE06>¯HEALTHSCORE05)
A) State the null hypothesis being tested.
B) Is this a one-tailed or two-tailed hypothesis?
C) Are your sample results consistent with the null hypothesis or the research hypothesis? (null / research)
D) What is the probability of getting the sample results you got if the null hypothesis is true? (If this step in hypothesis testing can be skipped, write the word "SKIP".)
E) What is your conclusion? (In other words, do you "reject" or "not reject" the null hypothesis based on these results?)
F) Are your results statistically significant? (yes / no)
Unlock Deck
Unlock for access to all 49 flashcards in this deck.
Unlock Deck
k this deck
45
Answer the questions that follow this SPSS output:
Your research hypothesis is "In the population, persons with 16 years of schooling average more children than persons with 20 years of schooling." ( )
A) State the null hypothesis being tested.
B) Is this a one-tailed or two-tailed hypothesis?
C) Are your sample results consistent with the null hypothesis or the research hypothesis? (null / research)
D) What is the significance level? (If this step in hypothesis testing can be skipped, write the word "SKIP".)
E) What is your conclusion? (In other words, do you "reject" or "not reject" the null hypothesis based on these results?)
F) Are your results statistically significant? (yes / no)
Unlock Deck
Unlock for access to all 49 flashcards in this deck.
Unlock Deck
k this deck
46
Answer the questions that follow this SPSS output:
Your research hypothesis is "In the population, the average number of hours spent using the Internet by full-time workers is greater than by part-time workers." (¯HEALTHSCORE06≤¯HEALTHSCORE05)
A) State the null hypothesis being tested.
B) Is this a one-tailed or two-tailed hypothesis?
C) Are your sample results consistent with the null hypothesis or the research hypothesis? (null / research)
D) What is the significance level? (If this step in hypothesis testing can be skipped, write the word "SKIP".)
E) What is your conclusion? (In other words, do you "reject" or "not reject" the null hypothesis based on these results?)
F) Are your results statistically significant? (yes / no)
Unlock Deck
Unlock for access to all 49 flashcards in this deck.
Unlock Deck
k this deck
47
Answer the questions that follow this SPSS output:
Your research hypothesis is "On average, persons in the population with 16 years of schooling have less general knowledge (GENKNOW) than persons with 20 years of schooling." (¯(〖GENKNOW〗_16 )<¯(〖GENKNOW〗_20 ) )
A) State the null hypothesis being tested.
B) Is this a one-tailed or two-tailed hypothesis?
C) Are your sample results consistent with the null hypothesis or the research hypothesis? (null / research)
D) What is the significance level? (If this step in hypothesis testing can be skipped, write the word "SKIP".)
E) What is your conclusion? (In other words, do you "reject" or "not reject" the null hypothesis based on these results?)
F) Are your results statistically significant? (yes / no)
Unlock Deck
Unlock for access to all 49 flashcards in this deck.
Unlock Deck
k this deck
48
Whenever you reject a null hypothesis, you may be making a correct decision or you may be making a Type ___ error; whenever you do not reject a null hypothesis, you may be making a correct decision or you may be making a Type _____ error.
Unlock Deck
Unlock for access to all 49 flashcards in this deck.
Unlock Deck
k this deck
49
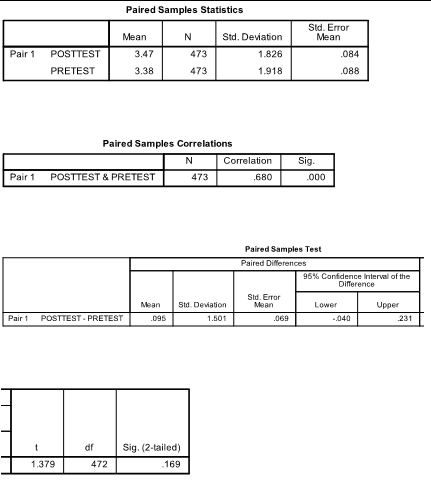
Answer the questions that follow this SPSS output:
Your research hypothesis is "In the population, the average on the POSTTEST is higher than the average on the PRETEST." ( (POSTTEST) ̅>(PRETEST) ̅)
A) State the null hypothesis being tested.
B) Is this a one-tailed or two-tailed hypothesis?
C) Are your sample results consistent with the null hypothesis or the research hypothesis? (null / research)
D) What is the probability of getting the sample results you got if the null hypothesis is true? (If this step in hypothesis testing can be skipped, write the word "SKIP".)
E) What is your conclusion? (In other words, do you "reject" or "not reject" the null hypothesis based on these results?)
F) Are your results statistically significant? (yes / no)
Unlock Deck
Unlock for access to all 49 flashcards in this deck.
Unlock Deck
k this deck
Unlock Deck
Unlock for access to all 49 flashcards in this deck.


