Deck 15: Describing Relationships: Regression, Prediction, and Causation
Full screen (f)
Question
Question
Question
Question
A random sample of patients who attended a clinic was selected. The age of the patient (years) and the number of days since the last visit were collected and are displayed in the figure below. The least-squares regression line for predicting number of days since the last visit from the age of the patient is y = 600.081 - 8.694x. 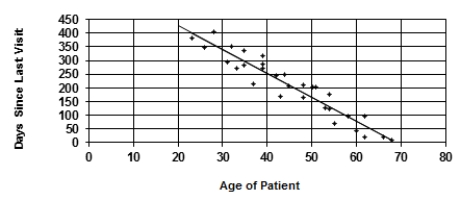 The slope of this line is
A) 600.081.
B) 8.694.
C) -8.694.
D) 600.081 - 8.694 = 591.387.
The slope of this line isA) 600.081.
B) 8.694.
C) -8.694.
D) 600.081 - 8.694 = 591.387.
Question
Question
Question
Question
Question
Question
Question
Question
Question
A random sample of patients who attended a clinic was selected. The age of the patient (years) and the number of days since the last visit were collected and are displayed in the figure below. The least-squares regression line for predicting number of days since the last visit from the age of the patient is y = 600.081 - 8.694x.  Using this line, you predict that the number of days since last visit to the clinic for a 50-year-old patient will be about
A) 63 days.
B) 78 days.
C) 165 days.
D) 200 days.
E) 252 days.
Using this line, you predict that the number of days since last visit to the clinic for a 50-year-old patient will be aboutA) 63 days.
B) 78 days.
C) 165 days.
D) 200 days.
E) 252 days.
Question
Question
Question
Question
Question
Question
A random sample of patients who attended a clinic was selected. The age of the patient (years) and the number of days since the last visit were collected and are displayed in the figure below. The least-squares regression line for predicting number of days since the last visit from the age of the patient is y = 600.081 - 8.694x.  The slope of this line tells us the
A) correlation between age of patient and days since last visit.
B) change in days since last visit for each year older a patient is, on average.
C) change in the age of the patient for each extra day since the last visit.
D) average days since last visit for all of the patients.
The slope of this line tells us theA) correlation between age of patient and days since last visit.
B) change in days since last visit for each year older a patient is, on average.
C) change in the age of the patient for each extra day since the last visit.
D) average days since last visit for all of the patients.
Question
Question
Question
Question
Question
Question
Question
Question
Question
Question
Question
Question
Question
Question
Question
A education researcher measured the IQ test scores of 78 seventh-grade students in a rural school, and also their school grade point average (GPA) measured on a 12-point scale. Here is a graph of GPA versus IQ for these students: 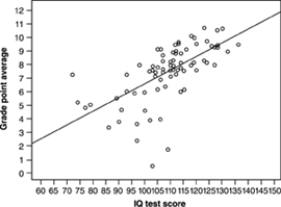 The line drawn on the graph is the least-squares regression line of GPA on IQ. Use this line to predict the GPA of a student with IQ 110. Your prediction is GPA about
A) 1.7.
B)6)
C) 7.5.
D) 9.
The line drawn on the graph is the least-squares regression line of GPA on IQ. Use this line to predict the GPA of a student with IQ 110. Your prediction is GPA aboutA) 1.7.
B)6)
C) 7.5.
D) 9.
Question
Question
Question

Unlock Deck
Sign up to unlock the cards in this deck!
Unlock Deck
Unlock Deck
1/37
Play
Full screen (f)
Deck 15: Describing Relationships: Regression, Prediction, and Causation
1
A variable such that its impact on the results cannot be separated from the impact of the explanatory variable on the outcome is called a
A) treatment.
B) confounding variable.
C) response variable.
D) correlation.
A) treatment.
B) confounding variable.
C) response variable.
D) correlation.
confounding variable.
2
One uses _________ to predict the value of a response variable for a given value of an explanatory variable.
A) correlation
B) standard deviation
C) association
D) regression
A) correlation
B) standard deviation
C) association
D) regression
regression
3
A study of 6,600 men found that those who consumed a moderate amount of alcohol (one drink or less per night) have lower mortality (on the average) than those who drink none. Is this good evidence that drinking a moderate amount causes lower mortality?
A) Yes, because the study is an experiment.
B) No, because people who drink a moderate amount may differ from nondrinkers in other ways, such as income and exercise, that affect mortality.
C) Yes, because the sample is so large that the margin of error will be quite small.
D) No, because we can't generalize from 6,600 people to the millions of adults in the country.
No, because people who drink a moderate amount may differ from nondrinkers in other ways, such as income and exercise, that affect mortality.
4
A random sample of patients who attended a clinic was selected. The age of the patient (years) and the number of days since the last visit were collected and are displayed in the figure below. The least-squares regression line for predicting number of days since the last visit from the age of the patient is y = 600.081 - 8.694x. The slope of this line is
A) 600.081.
B) 8.694.
C) -8.694.
D) 600.081 - 8.694 = 591.387.
The slope of this line isA) 600.081.
B) 8.694.
C) -8.694.
D) 600.081 - 8.694 = 591.387.
Unlock Deck
Unlock for access to all 37 flashcards in this deck.
Unlock Deck
k this deck
5
The correlation between two variables x and y is 0.5. If we used a regression line to predict y using x, what percent of the variation in y would be explained?
A) 50%
B) 25%
C) 2.23%
D) 75%
E) 70.7%
A) 50%
B) 25%
C) 2.23%
D) 75%
E) 70.7%
Unlock Deck
Unlock for access to all 37 flashcards in this deck.
Unlock Deck
k this deck
6
Consider a large number of countries around the world. There is a positive correlation between the number of cell phones per person x and the average life expectancy y. Does this mean that we could increase the life expectancy in Rwanda by shipping cell phones to that country?
A) Yes. The correlation says that as the number of cell phones per person goes up, so does life expectancy.
B) No. If the correlation were negative, we could accept that conclusion, but this correlation is positive.
C) Yes. Positive correlation means that, if we increase x, then y will automatically increase.
D) No. The positive correlation just shows that richer countries have both more cell phones per person and higher life expectancies.
E) It makes no sense to calculate correlation between these variables.
Unlock Deck
Unlock for access to all 37 flashcards in this deck.
Unlock Deck
k this deck
7
A social scientist wants to use subjects' number of hours of television watched to predict their score on a test of propensity to violence. Subjects who watch more television do tend to get higher scores on the test. But regressing their violence test score on their hours of television watch explained only 16 percent of the total score. What is the correlation between their hours of television watched and violence test scores?
A) 0.16
B) -0.16
C) 0.40
D) -0.40
E) 0.32
A) 0.16
B) -0.16
C) 0.40
D) -0.40
E) 0.32
Unlock Deck
Unlock for access to all 37 flashcards in this deck.
Unlock Deck
k this deck
8
A least-squares regression line is not just any line drawn through the points of a scatterplot. What is special about a least-squares regression line?
A) It passes through all the points.
B) It minimizes the squared values of the data.
C) It has slope equal to the correlation between the two variables.
D) It describes how a response variable y changes as an explanatory variable x takes different values.
E) It minimizes the sum of the squared vertical distances of the data points from the line.
Unlock Deck
Unlock for access to all 37 flashcards in this deck.
Unlock Deck
k this deck
9
Perfect correlation means all of the following except
A) r = -1 or r = +1.
B) all points on the scatterplot lie on a straight line.
C) all variation in one variable is explained by variation in the other variable.
D) there is a causal relationship between the variables.
E) each variable is a perfect predictor of the other.
A) r = -1 or r = +1.
B) all points on the scatterplot lie on a straight line.
C) all variation in one variable is explained by variation in the other variable.
D) there is a causal relationship between the variables.
E) each variable is a perfect predictor of the other.
Unlock Deck
Unlock for access to all 37 flashcards in this deck.
Unlock Deck
k this deck
10
Suppose that the least-squares regression line for predicting y from x is y = 100 + 1.3x. Which of the following is a possible value for the correlation between x and y?
A) 1.3
B) -1.3
C) 0
D) -0.5
E) 0.5
A) 1.3
B) -1.3
C) 0
D) -0.5
E) 0.5
Unlock Deck
Unlock for access to all 37 flashcards in this deck.
Unlock Deck
k this deck
11
In a fisheries researcher's experiment, the correlation between the number of eggs in the nest and the number of viable (surviving) eggs for a sample of nests is r = 0.67.
The correlation r = 0.67 shows that the fact that the nests have different number of eggs explains
A) about 27% of the observed variation in the number of surviving eggs.
B) about 45% of the observed variation in the number of surviving eggs.
C) about 67% of the observed variation in the number of surviving eggs.
D) about 95% of the observed variation in the number of surviving eggs.
E) why some people fish at different places in the river.
Unlock Deck
Unlock for access to all 37 flashcards in this deck.
Unlock Deck
k this deck
12
A social scientist learns, upon analyzing her data, that the correlation between a subject's hours of television watched and their score on a test that measures propensity to violence is r = 0.3. One way to use r is to compute the percent of the variation in the violence test score that can be explained by the straight-line relationship between that violence test score and hours of television watched. This percent is about
A) 30%.
B) 70%.
C) 9%.
D) 21%.
E) 7%.
A) 30%.
B) 70%.
C) 9%.
D) 21%.
E) 7%.
Unlock Deck
Unlock for access to all 37 flashcards in this deck.
Unlock Deck
k this deck
13
A random sample of patients who attended a clinic was selected. The age of the patient (years) and the number of days since the last visit were collected and are displayed in the figure below. The least-squares regression line for predicting number of days since the last visit from the age of the patient is y = 600.081 - 8.694x. Using this line, you predict that the number of days since last visit to the clinic for a 50-year-old patient will be about
A) 63 days.
B) 78 days.
C) 165 days.
D) 200 days.
E) 252 days.
Using this line, you predict that the number of days since last visit to the clinic for a 50-year-old patient will be aboutA) 63 days.
B) 78 days.
C) 165 days.
D) 200 days.
E) 252 days.
Unlock Deck
Unlock for access to all 37 flashcards in this deck.
Unlock Deck
k this deck
14
If the least-squares regression line for predicting y from x is y = 500 - 20x, what is the predicted value of y when x = 10?
A) 300
B) 500
C) 4800
D) 700
E) 20
A) 300
B) 500
C) 4800
D) 700
E) 20
Unlock Deck
Unlock for access to all 37 flashcards in this deck.
Unlock Deck
k this deck
15
What can we say about the relationship between a correlation r and the slope b of the least-squares line for the same set of data?
A) r is always larger than b.
B) r and b always have the same sign (+ or -).
C) b is always larger than r.
D) b and r are measured in the same units.
E) Both "b is always larger than r" and "b and r are measured in the same units" are correct.
A) r is always larger than b.
B) r and b always have the same sign (+ or -).
C) b is always larger than r.
D) b and r are measured in the same units.
E) Both "b is always larger than r" and "b and r are measured in the same units" are correct.
Unlock Deck
Unlock for access to all 37 flashcards in this deck.
Unlock Deck
k this deck
16
A high correlation between two variables does not always mean that changes in one cause changes in the other. The best way to get good evidence that cause-and-effect is present is to
A) select a simple random sample from the population of interest.
B) arrange the data in a two-way table.
C) carry out a randomized comparative experiment.
D) make a scatterplot and look for a strong association.
E) make a histogram and look for outliers.
A) select a simple random sample from the population of interest.
B) arrange the data in a two-way table.
C) carry out a randomized comparative experiment.
D) make a scatterplot and look for a strong association.
E) make a histogram and look for outliers.
Unlock Deck
Unlock for access to all 37 flashcards in this deck.
Unlock Deck
k this deck
17
A report in a medical journal notes that the risk of developing Alzheimer's disease among subjects who (voluntarily) regularly took the anti-inflammatory drug ibuprofen (the active ingredient in Advil) was about half the risk among those who did not. Is this good evidence that ibuprofen is effective in preventing Alzheimer's disease?
A) Yes, because the study was a randomized, comparative experiment.
B) No, because the effect of ibuprofen is confounded with the placebo effect.
C) Yes, because the results were published in a reputable professional journal.
D) No, because this is an observational study. A clinical trial would be needed to confirm (or not confirm) the observed effect.
E) Yes, because a 50% reduction can't happen just by chance.
Unlock Deck
Unlock for access to all 37 flashcards in this deck.
Unlock Deck
k this deck
18
If there were something genetic which made people simultaneously more susceptible to both smoking and lung cancer, that would be an instance of
A) causation.
B) common response.
C) the placebo effect.
D) confounding.
A) causation.
B) common response.
C) the placebo effect.
D) confounding.
Unlock Deck
Unlock for access to all 37 flashcards in this deck.
Unlock Deck
k this deck
19
A random sample of patients who attended a clinic was selected. The age of the patient (years) and the number of days since the last visit were collected and are displayed in the figure below. The least-squares regression line for predicting number of days since the last visit from the age of the patient is y = 600.081 - 8.694x. The slope of this line tells us the
A) correlation between age of patient and days since last visit.
B) change in days since last visit for each year older a patient is, on average.
C) change in the age of the patient for each extra day since the last visit.
D) average days since last visit for all of the patients.
The slope of this line tells us theA) correlation between age of patient and days since last visit.
B) change in days since last visit for each year older a patient is, on average.
C) change in the age of the patient for each extra day since the last visit.
D) average days since last visit for all of the patients.
Unlock Deck
Unlock for access to all 37 flashcards in this deck.
Unlock Deck
k this deck
20
In a fisheries researcher's experiment, the correlation between the number of eggs in the nest and the number of viable (surviving) eggs for a sample of nests is r = 0.67.
The equation of the regression line for number of viable eggs y versus number of eggs in the nest x is y = 0.72x + 17.07. For a nest with 140 eggs, what is the predicted number of viable eggs?
A) 114 eggs
B) 116 eggs
C) 118 eggs
D) 120 eggs
E) None of these answers are correct
The equation of the regression line for number of viable eggs y versus number of eggs in the nest x is y = 0.72x + 17.07. For a nest with 140 eggs, what is the predicted number of viable eggs?
A) 114 eggs
B) 116 eggs
C) 118 eggs
D) 120 eggs
E) None of these answers are correct
Unlock Deck
Unlock for access to all 37 flashcards in this deck.
Unlock Deck
k this deck
21
Students who study statistics in college tend to score higher on the Graduate Record Examinations (GRE) math section than students who do not study statistics. Which is true?
A) This shows that studying statistics improves your knowledge for the GRE.
B) Students who choose to study statistics are probably already good at math, so we can't conclude anything about cause-and-effect.
C) This makes no sense because you can't compute the correlation between studying statistics and GRE math section test scores.
D) There is a positive correlation between whether or not a student studied statistics and the student's GRE math section test score.
Unlock Deck
Unlock for access to all 37 flashcards in this deck.
Unlock Deck
k this deck
22
The correlation between two variables x and y is -0.6. If we used a regression line to predict y using x, what percent of the variation in y would be explained?
A) 77%
B) -36%
C) 36%
D) -6%
E) 6%
A) 77%
B) -36%
C) 36%
D) -6%
E) 6%
Unlock Deck
Unlock for access to all 37 flashcards in this deck.
Unlock Deck
k this deck
23
Lean body mass (your weight leaving out fat) helps predict metabolic rate (how many calories of energy you burn in an hour). The relationship is roughly a straight line. The least-squares regression line for predicting metabolic rate (y in calories) from lean body mass (x in kilograms) is y = 113.2 + 26.9x.
The slope of the regression line is
A) 113.2-that is, when x = 0, y = 113.2.
B) 113.2-that is, the mean metabolic rate is 113.2 calories per hour.
C) 26.9-that is, the mean metabolic rate is 26.9 calories per hour.
D) 26.9-that is, when lean body mass goes up by 1 kg, metabolic rate goes up by 26.9 calories.
E) 26.9-that is, when a person weighs 26.9 more kg, metabolic rate goes up by 1 calorie.
Unlock Deck
Unlock for access to all 37 flashcards in this deck.
Unlock Deck
k this deck
24
A year-long fitness center study sought to determine if there is a relationship between the amount of muscle mass gained y (kilograms) and the weekly time spent working out under the guidance of a trainer x (minutes.) The resulting least-squares regression line for the study is y = 2.04 + 0.12x.
Suppose you worked out for two hours (120 minutes) per week, how much muscle mass gain would you predict?
A) 14.40 kg
B) 750.84 kg
C) 16.44 kg
D) 18.48 kg
E) None of the answers are correct
Suppose you worked out for two hours (120 minutes) per week, how much muscle mass gain would you predict?
A) 14.40 kg
B) 750.84 kg
C) 16.44 kg
D) 18.48 kg
E) None of the answers are correct
Unlock Deck
Unlock for access to all 37 flashcards in this deck.
Unlock Deck
k this deck
25
The evidence that smoking causes lung cancer is very strong. But it is not the strongest possible statistical evidence because
A) we can't do experiments to compare smokers and non-smokers.
B) only smokers have been studied.
C) the studies of the effects of smoking are not double-blind.
D) all the studies of the effects of smoking involve animals, not humans.
A) we can't do experiments to compare smokers and non-smokers.
B) only smokers have been studied.
C) the studies of the effects of smoking are not double-blind.
D) all the studies of the effects of smoking involve animals, not humans.
Unlock Deck
Unlock for access to all 37 flashcards in this deck.
Unlock Deck
k this deck
26
A study of child development measures the age (in months) at which a child begins to talk and also the child's score on an ability test given several years later. The study asks whether the age at which a child talks helps predict the later test score. The least- squares regression line of test score y on age x is y = 110 - 1.3x. According to this regression line, what happens (on the average) when a child starts talking one month later?
A) The test score goes down 110 points.
B) The test score goes down 1.3 points.
C) The test score goes up 110 points.
D) The test score goes up 1.3 points.
E) The test score is 108.7.
A) The test score goes down 110 points.
B) The test score goes down 1.3 points.
C) The test score goes up 110 points.
D) The test score goes up 1.3 points.
E) The test score is 108.7.
Unlock Deck
Unlock for access to all 37 flashcards in this deck.
Unlock Deck
k this deck
27
A year-long fitness center study sought to determine if there is a relationship between the amount of muscle mass gained y (kilograms) and the weekly time spent working out under the guidance of a trainer x (minutes.) The resulting least-squares regression line for the study is y = 2.04 + 0.12x.
The correlation coefficient for these data is r = 0.95. Which of the following statements is true?
A) Predictions using this equation will be fairly good since about 95% of the variation in muscle mass can be explained by the linear relationship with time spent working out.
B) Predictions using this equation will be fairly poor since only about 95% of the variation in muscle mass can be explained by the linear relationship with time spent working out.
C) Predictions using this equation will be fairly poor since only about 90.25% of the variation in muscle mass can be explained by the linear relationship with time spent working out.
D) Predictions using this equation will be fairly good since about 90.25% of the variation in muscle mass can be explained by the linear relationship with time spent working out.
Unlock Deck
Unlock for access to all 37 flashcards in this deck.
Unlock Deck
k this deck
28
Lean body mass (your weight leaving out fat) helps predict metabolic rate (how many calories of energy you burn in an hour). The relationship is roughly a straight line. The least-squares regression line for predicting metabolic rate (y in calories) from lean body mass (x in kilograms) is y = 113.2 + 26.9x.
Using this regression line, you predict that a person with lean body mass 50 kilograms will have metabolic rate equal to about how many calories?
A) 140
B) 1232
C) 1345
D) 1458
E) 5687
Using this regression line, you predict that a person with lean body mass 50 kilograms will have metabolic rate equal to about how many calories?
A) 140
B) 1232
C) 1345
D) 1458
E) 5687
Unlock Deck
Unlock for access to all 37 flashcards in this deck.
Unlock Deck
k this deck
29
A study of many countries finds a strong positive correlation between the life expectancy in a country and the number of Facebook users in the country. This means that:
A) Facebook use is a major contributing cause of longer life.
B) life expectancy could be significantly increased by having more people start Facebook accounts.
C) in countries where life expectancy is high, the number of Facebook accounts tends to be low.
D) in countries where the number of Facebook accounts is low, life expectancy tends to be high.
E) None of the answer choices are correct.
Unlock Deck
Unlock for access to all 37 flashcards in this deck.
Unlock Deck
k this deck
30
A year-long fitness center study sought to determine if there is a relationship between the amount of muscle mass gained y (kilograms) and the weekly time spent working out under the guidance of a trainer x (minutes.) The resulting least-squares regression line for the study is y = 2.04 + 0.12x.
For each additional minute (weekly) spent working out, the average muscle mass changed by
A) 2.04 kg
B) 0.12 kg
C) 204 kg.
D) 12 kg.
For each additional minute (weekly) spent working out, the average muscle mass changed by
A) 2.04 kg
B) 0.12 kg
C) 204 kg.
D) 12 kg.
Unlock Deck
Unlock for access to all 37 flashcards in this deck.
Unlock Deck
k this deck
31
The best way to settle questions of causation is
A) a careful observational study.
B) a properly designed experiment.
C) to draw a scatterplot.
D) to draw a line graph.
E) to calculate a correlation.
A) a careful observational study.
B) a properly designed experiment.
C) to draw a scatterplot.
D) to draw a line graph.
E) to calculate a correlation.
Unlock Deck
Unlock for access to all 37 flashcards in this deck.
Unlock Deck
k this deck
32
A study of the effects of television measured how many hours of television each of 125 grade school children watched per week during a school year and their reading scores. The study found that children who watch more television tend to have lower reading scores than children who watch fewer hours of television. The study report says that "Hours of television watched explained 9% of the observed variation in the reading scores of the 125 subjects." The correlation between hours of TV and reading score must be
A) r = 0.09.
B) r = -0.09.
C) r = 0.3.
D) r = -0.3.
E) Can't tell from the information given.
A) r = 0.09.
B) r = -0.09.
C) r = 0.3.
D) r = -0.3.
E) Can't tell from the information given.
Unlock Deck
Unlock for access to all 37 flashcards in this deck.
Unlock Deck
k this deck
33
If the least-squares regression line for predicting y from x is y = 40 + 10x, what is the predicted value of y when x = 5?
A) 250
B) 90
C) 50
D) 40
E) 10
A) 250
B) 90
C) 50
D) 40
E) 10
Unlock Deck
Unlock for access to all 37 flashcards in this deck.
Unlock Deck
k this deck
34
A education researcher measured the IQ test scores of 78 seventh-grade students in a rural school, and also their school grade point average (GPA) measured on a 12-point scale. Here is a graph of GPA versus IQ for these students: The line drawn on the graph is the least-squares regression line of GPA on IQ. Use this line to predict the GPA of a student with IQ 110. Your prediction is GPA about
A) 1.7.
B)6)
C) 7.5.
D) 9.
The line drawn on the graph is the least-squares regression line of GPA on IQ. Use this line to predict the GPA of a student with IQ 110. Your prediction is GPA aboutA) 1.7.
B)6)
C) 7.5.
D) 9.
Unlock Deck
Unlock for access to all 37 flashcards in this deck.
Unlock Deck
k this deck
35
A year-long fitness center study sought to determine if there is a relationship between the amount of muscle mass gained y (kilograms) and the weekly time spent working out under the guidance of a trainer x (minutes.) The resulting least-squares regression line for the study is y = 2.04 + 0.12x.
We can see from the equation of the line that, as the weekly time spent working out x goes up,
A) muscle mass gained y tends to go up because the slope 2.04 is positive.
B) muscle mass gained y tends to go up because the slope 0.12 is positive.
C) muscle mass gained y tends to go down because the slope 0.12 is less than 2.04.
D) muscle mass gained y tends to go down, because the slope 0.12 is less than 52.
Unlock Deck
Unlock for access to all 37 flashcards in this deck.
Unlock Deck
k this deck
36
Deaths from highway accidents went down after the adoption of a national 55 mile-per-hour speed limit. Can we be confident that the lower speed limit caused the drop in deaths?
A) Yes, because the study was a randomized, comparative experiment.
B) No, because the effect of lower speed limits is confounded with the effect of better highways and safer cars.
C) Yes, because a drop in deaths over several years can't happen just by chance.
D) No, because of the placebo effect.
E) Yes, because correlation implies causation.
Unlock Deck
Unlock for access to all 37 flashcards in this deck.
Unlock Deck
k this deck
37
A study found correlation r = 0.43 between high school math grades (on a 0 to 100 scale) and income 10 years after school. This says that the fact that hot dogs have different amounts of salt explains about
A) 18.5% of the observed variation in their calorie counts.
B) 43% of the observed variation in their calorie counts.
C) 65.6% of the observed variation in their calorie counts.
D) 98% of the observed variation in their calorie counts.
A) 18.5% of the observed variation in their calorie counts.
B) 43% of the observed variation in their calorie counts.
C) 65.6% of the observed variation in their calorie counts.
D) 98% of the observed variation in their calorie counts.
Unlock Deck
Unlock for access to all 37 flashcards in this deck.
Unlock Deck
k this deck
Unlock Deck
Unlock for access to all 37 flashcards in this deck.


