Deck 24: Two-Way Tables and the Chi-Square Test
Full screen (f)
Question
Consider the following data on college enrollment by field of study and the sex of the students:
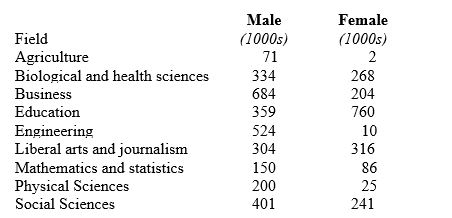
About what percent of all female college students were enrolled in liberal arts and journalism?
A) 5%
B) 6%
C) 16%
D) 49%
E) 51%
About what percent of all female college students were enrolled in liberal arts and journalism?
A) 5%
B) 6%
C) 16%
D) 49%
E) 51%
Question
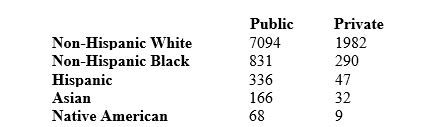
Here is a two-way table of the numbers of college students (U.S. citizens only) classified by racial/ethnic group and by whether they attend a public or a private college. The entries are in thousands of students.
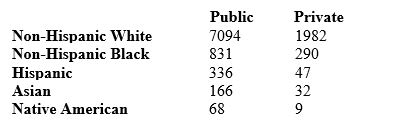
What percent of public college students are non-Hispanic blacks?
A) 9.8%
B) 10.4%
C) 13.3%
D) 26%
E) 74%
What percent of public college students are non-Hispanic blacks?
A) 9.8%
B) 10.4%
C) 13.3%
D) 26%
E) 74%
Question
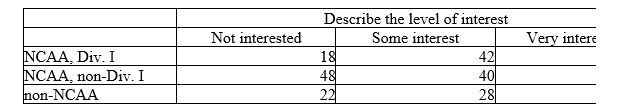
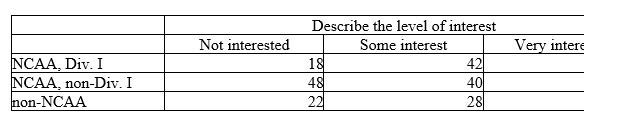
A study of college football players' involvement with sports agents interviews a sample of college sports information directors. One question concerns revamping rules concerning timing and level of player-agent contact. Here is a two-way table of the results:
How many sports information directors were interviewed?
A) 125
B) 332
C) 4
D) 9
How many sports information directors were interviewed?
A) 125
B) 332
C) 4
D) 9
Question
Question
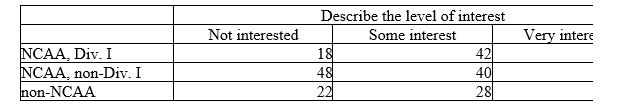
A study of college football players' involvement with sports agents interviews a sample of college sports information directors. One question concerns revamping rules concerning timing and level of player-agent contact. Here is a two-way table of the results:
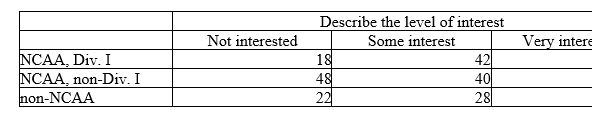
We can summarize the relationship between the school the sports information director is from and his or her level of interest in revamping the rules by saying:
A) few of the directors are from the non-NCAA schools, more are from non-Div. I NCAA schools, and the most are from NCAA Div. I schools.
B) directors from Div. I NCAA schools are much more likely to have some interest (contrasted with none or being very interested) than the other two groups of directors.
C) the non-Div. I NCAA directors were the least likely to be very interested and the Div. I NCAA directors the least likely to be "not interested."
D) almost three-quarters of the sports information directors had at least some interest in revamping the rules.
Question
Here is a two-way table of the numbers of college students (U.S. citizens only) classified by racial/ethnic group and by whether they attend a public or a private college. The entries are in thousands of students.
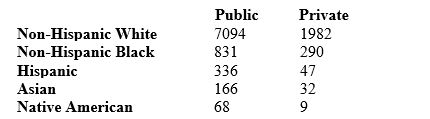
What percent of non-Hispanic black students attend public colleges?
A) 9.8%
B) 10.4%
C) 13.3%
D) 26%
E) 74%
What percent of non-Hispanic black students attend public colleges?
A) 9.8%
B) 10.4%
C) 13.3%
D) 26%
E) 74%
Question
A study of college football players' involvement with sports agents interviews a sample of college sports information directors. One question concerns revamping rules concerning timing and level of player-agent contact. Here is a two-way table of the results:
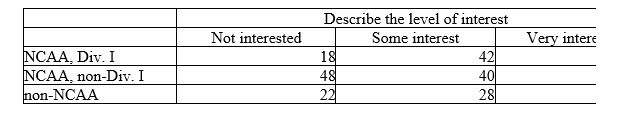
What is the expected number of NCAA Div. I sports information directors who have some interest in revamping the rules?
A) 42
B) 120
C) 39.76
D) 110
E) 3.55
What is the expected number of NCAA Div. I sports information directors who have some interest in revamping the rules?
A) 42
B) 120
C) 39.76
D) 110
E) 3.55
Question
During basketball practice, Ulrich made 80% of his free throws, while Franz made only 70%. Ulrich also did better in the game, making 60%, while Franz made only 50%. Here are the data:
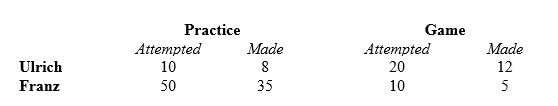
Overall (practice plus game),
A) Ulrich made a higher percent of his free throws than Franz did.
B) Franz made a higher percent of his free throws than Ulrich did.
C) both Ulrich and Franz made exactly the same percent of their free throws.
D) Ulrich made 70% of his free throws.
E) Ulrich made a higher percent of his free throws than Franz did, and Ulrich made 70% of his free throws.
Question
Consider the following data on college enrollment by field of study and the sex of the students:
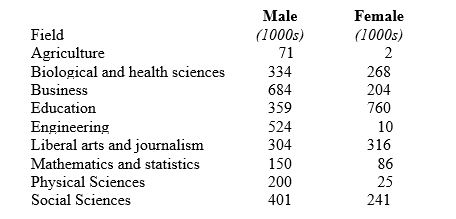
About how many college students were studying engineering?
A) 524
B) 534
C) 53,400
D) 524,000
E) 534,000
About how many college students were studying engineering?
A) 524
B) 534
C) 53,400
D) 524,000
E) 534,000
Question
A study of college football players' involvement with sports agents interviews a sample of college sports information directors. One question concerns revamping rules concerning timing and level of player-agent contact. Here is a two-way table of the results:
The chi-square statistic for this two-way table is 2 = 19.4 with P-value < 0.001. We can conclude that:
A) there is very strong evidence that type of college and interest in revamping student athlete/agent contact rules are related in the population of all sports information directors.
B) there is very strong evidence that type of college and interest in revamping student athlete/agent contact rules are related among the sports information directors in this sample.
C) we lack strong evidence that type of college and interest in revamping student athlete/agent contact rules are related in the population of all sports information directors.
D) we lack strong evidence that type of college and interest in revamping student athlete/agent contact rules are related among the sports information directors in this sample.
Question
Question
A sample of 123 respondents is asked, "Should corporations attempt to use their financial resources to influence public policy, especially with respect to social issues?" The responses are as follows:

What is the chi-square statistic for this table?
A) 2.741
B) 1
C) 0.9276
D) 4
E) 2
What is the chi-square statistic for this table?
A) 2.741
B) 1
C) 0.9276
D) 4
E) 2
Question
Consider the following data on college enrollment by field of study and the sex of the students:
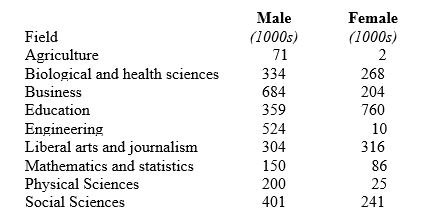
What percent of college students were studying engineering?
A) 0.5%
B) 5%
C) 11%
D) 17%
E) 28%
What percent of college students were studying engineering?
A) 0.5%
B) 5%
C) 11%
D) 17%
E) 28%
Question
Question
Here is a two-way table of the numbers of college students (U.S. citizens only) classified by racial/ethnic group and by whether they attend a public or a private college. The entries are in thousands of students.
There is no reason to use the chi-square test on these data, because
A) the hypothesis that chi-square tests makes no sense here.
B) the data describe the entire population of college students, so there is no inference from sample to population.
C) the sample size is so large that any test will certainly be highly significant.
D) the sample size is too small to allow use of the chi-square test.
Question
Question
A sample of 123 respondents is asked, "Should corporations attempt to use their financial resources to influence public policy, especially with respect to social issues?" The responses are as follows:

The chi-square statistic for this table has how many degrees of freedom?
A) 1
B) 2
C) 3
D) 4
E) 6
The chi-square statistic for this table has how many degrees of freedom?
A) 1
B) 2
C) 3
D) 4
E) 6
Question
Here is a two-way table of the numbers of college students (U.S. citizens only) classified by racial/ethnic group and by whether they attend a public or a private college. The entries are in thousands of students.
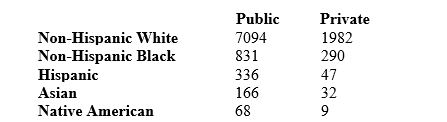
How many non-Hispanic black college students are there?
A) 1121
B) 11,210
C) 112,100
D) 1,121,000
E) 11,210,000
How many non-Hispanic black college students are there?
A) 1121
B) 11,210
C) 112,100
D) 1,121,000
E) 11,210,000
Question
A study of college football players' involvement with sports agents interviews a sample of college sports information directors. One question concerns revamping rules concerning timing and level of player-agent contact. Here is a two-way table of the results:
A chi-square statistic for this table will have how many degrees of freedom?
A) 3
B) 4
C) 6
D) 9
E) 12
A chi-square statistic for this table will have how many degrees of freedom?
A) 3
B) 4
C) 6
D) 9
E) 12
Question
A sample of 123 respondents is asked, "Should corporations attempt to use their financial resources to influence public policy, especially with respect to social issues?" The responses are as follows:
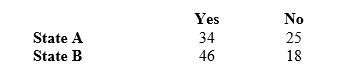
What is the expected number of respondents in State A who said Yes?
A) 59
B) 34
C) 38.37
D) 80
E) 231
What is the expected number of respondents in State A who said Yes?
A) 59
B) 34
C) 38.37
D) 80
E) 231
Question
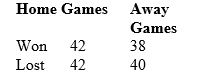
In 2015 the Tampa Bay Rays had the following record for the season:
What is the chi-square statistic for this table?
A) 0.027
B) 1.32
C) 5.99
D) 7.43
E) 4.61
What is the chi-square statistic for this table?
A) 0.027
B) 1.32
C) 5.99
D) 7.43
E) 4.61
Question
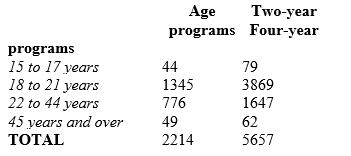
Here is a two-way table showing enrollment data for full-time undergraduate students in U.S. colleges and universities. The entries are thousands of students:

The chi-square statistic for this table has how many degrees of freedom?
A) 1
B) 2
C) 3
D) 4
E) 8
The chi-square statistic for this table has how many degrees of freedom?
A) 1
B) 2
C) 3
D) 4
E) 8
Question
Here is a two-way table showing enrollment data for full-time undergraduate students in U.S. colleges and universities. The entries are thousands of students:

What percent of students in 4-year programs were 18 to 21 years old?
A) about 0.684%
B) about 3869%
C) about 49.2%
D) about 68.4%
E) None of these.
What percent of students in 4-year programs were 18 to 21 years old?
A) about 0.684%
B) about 3869%
C) about 49.2%
D) about 68.4%
E) None of these.
Question
In 2015 the Tampa Bay Rays had the following record for the season:

The P-value for this table's chi-square statistic is:
A) between 0.01 and 0.05.
B) between 0.05 and 0.10.
C) between 0.10 and 0.15.
D) between 0.15 and 0.25.
E) greater than 0.25.
The P-value for this table's chi-square statistic is:
A) between 0.01 and 0.05.
B) between 0.05 and 0.10.
C) between 0.10 and 0.15.
D) between 0.15 and 0.25.
E) greater than 0.25.
Question
Here is a two-way table showing enrollment data for full-time undergraduate students in U.S. colleges and universities. The entries are thousands of students:

What is the expected number (in thousands) of 18 to 21 year olds in 4-year programs?
A) 3869
B) 684
C) 3747.4
D) 2607
E) 5214
What is the expected number (in thousands) of 18 to 21 year olds in 4-year programs?
A) 3869
B) 684
C) 3747.4
D) 2607
E) 5214
Question
A sample of 123 respondents is asked, "Should corporations attempt to use their financial resources to influence public policy, especially with respect to social issues?" The responses are as follows:

The P-value for this table's chi-square statistic is:
A) less than 0.001.
B) between 0.01 and 0.05.
C) between 0.05 and 0.10.
D) between 0.10 and 0.25..
E) greater than 0.25.
The P-value for this table's chi-square statistic is:
A) less than 0.001.
B) between 0.01 and 0.05.
C) between 0.05 and 0.10.
D) between 0.10 and 0.25..
E) greater than 0.25.
Question
Here is a two-way table showing enrollment data for full-time undergraduate students in U.S. colleges and universities. The entries are thousands of students:

The P-value for this table's chi-square statistic is
A) less than 0.001.
B) between 0.001 and 0.01.
C) between 0.01 and 0.05.
D) between 0.05 and 0.10.
E) between 0.10 and 0.15.
The P-value for this table's chi-square statistic is
A) less than 0.001.
B) between 0.001 and 0.01.
C) between 0.01 and 0.05.
D) between 0.05 and 0.10.
E) between 0.10 and 0.15.
Question
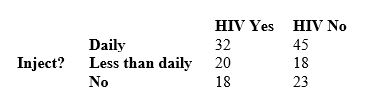
A study of drug addicts in Amsterdam recorded how often each addict had recently injected drugs and whether or not the addict was infected with HIV, the virus that causes AIDS. Here is a two-way table of the numbers of addicts in each condition:

The chi-square statistic for this table has how many degrees of freedom?
A) 1
B) 2
C) 3
D) 4
E) 6
The chi-square statistic for this table has how many degrees of freedom?
A) 1
B) 2
C) 3
D) 4
E) 6
Question
In 2015 the Tampa Bay Rays had the following record for the season:

What percent of their home games did the team win?
A) 35.19 percent
B) 49.38 percent
C) 50.00 percent
D) 59.88 percent
E) 70.37 percent
What percent of their home games did the team win?
A) 35.19 percent
B) 49.38 percent
C) 50.00 percent
D) 59.88 percent
E) 70.37 percent
Question
Question
In 2015 the Tampa Bay Rays had the following record for the season:

What is the expected number of home games to be won?
A) 32.5
B) 41.48
C) 57
D) 81
E) 97
What is the expected number of home games to be won?
A) 32.5
B) 41.48
C) 57
D) 81
E) 97
Question
A sample of 123 respondents is asked, "Should corporations attempt to use their financial resources to influence public policy, especially with respect to social issues?" The responses are as follows:

Based on the P-value for the chi-square statistic, we can conclude that:
A) there is very strong evidence that response is related to state.
B) there is very strong evidence that response is not related to state.
C) there is very little evidence that response is related to state.
D) there is very little evidence that response is not related to state.
Question
A study of drug addicts in Amsterdam recorded how often each addict had recently injected drugs and whether or not the addict was infected with HIV, the virus that causes AIDS. Here is a two-way table of the numbers of addicts in each condition:

How many addicts did the study gather data from?
A) 156
B) 86
C) 77
D) 70
E) Can't tell from the table.
How many addicts did the study gather data from?
A) 156
B) 86
C) 77
D) 70
E) Can't tell from the table.
Question
In 2015 the Tampa Bay Rays had the following record for the season:

The chi-square statistic for this table has how many degrees of freedom?
A) 1
B) 2
C) 3
D) 4
E) 6
The chi-square statistic for this table has how many degrees of freedom?
A) 1
B) 2
C) 3
D) 4
E) 6
Question
In 2015 the Tampa Bay Rays had the following record for the season:

The previous questions lead to this conclusion about the relationship between where the team played and how well it did:
A) the team is more likely to win when it plays at home.
B) the team is less likely to win when it plays away.
C) there is no evidence of an association between where the team played and whether it won or lost.
D) the team is more likely to win when it plays at home, and the team is less likely to win when it plays away.
Question
In 2015 the Tampa Bay Rays had the following record for the season:

What percent of their games did the team win for the season?
A) 35.19 percent
B) 49.38 percent
C) 58.76 percent
D) 59.88 percent
E) 70.37 percent
What percent of their games did the team win for the season?
A) 35.19 percent
B) 49.38 percent
C) 58.76 percent
D) 59.88 percent
E) 70.37 percent
Question
Here is a two-way table showing enrollment data for full-time undergraduate students in U.S. colleges and universities. The entries are thousands of students:
What is the chi-square statistic for this table?
A) 49.88
B) 7.81
C) 5.99
D) 9.49
E) 16.27
What is the chi-square statistic for this table?
A) 49.88
B) 7.81
C) 5.99
D) 9.49
E) 16.27
Question
A study of drug addicts in Amsterdam recorded how often each addict had recently injected drugs and whether or not the addict was infected with HIV, the virus that causes AIDS. Here is a two-way table of the numbers of addicts in each condition:
What is the chi-square statistic for this table?
A) 1.28
B) 2.77
C) 5.99
D) 7.81
E) 9.21
What is the chi-square statistic for this table?
A) 1.28
B) 2.77
C) 5.99
D) 7.81
E) 9.21
Question
A study of drug addicts in Amsterdam recorded how often each addict had recently injected drugs and whether or not the addict was infected with HIV, the virus that causes AIDS. Here is a two-way table of the numbers of addicts in each condition:

What is the expected number of addicts with HIV that inject drugs daily?
A) 32
B) 34.6
C) 42.4
D) 70
E) 77
What is the expected number of addicts with HIV that inject drugs daily?
A) 32
B) 34.6
C) 42.4
D) 70
E) 77
Question
Here is a two-way table showing enrollment data for full-time undergraduate students in U.S. colleges and universities. The entries are thousands of students:

How many students were 18 to 21 years old?
A) 1345
B) 5214
C) 521,400
D) 3,869,000
E) 5,214,000
How many students were 18 to 21 years old?
A) 1345
B) 5214
C) 521,400
D) 3,869,000
E) 5,214,000
Question
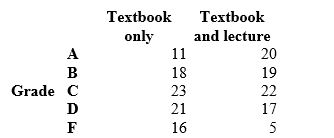
A professor wants to know if students who regularly attend lecture and read the textbook perform differently in her introductory statistics course than the students who only read the textbook. The results are as follows:
The chi-square statistic for this table has how many degrees of freedom?
A) 2
B) 4
C) 5
D) 8
E) 10
The chi-square statistic for this table has how many degrees of freedom?
A) 2
B) 4
C) 5
D) 8
E) 10
Question
A study of drug addicts in Amsterdam recorded how often each addict had recently injected drugs and whether or not the addict was infected with HIV, the virus that causes AIDS. Here is a two-way table of the numbers of addicts in each condition:

From the data in the two-way table, about what is the value of the correlation between whether an addict is infected with HIV and how often he or she injects drugs?
A) Small but positive, say, r = 0.2.
B) Quite large and positive, say, r = 0.8.
C) Very small, close to r = 0.
D) Small but negative, say, r = -0.2.
E) r makes no sense for these data.
Question
Question
A professor wants to know if students who regularly attend lecture and read the textbook perform differently in her introductory statistics course than the students who only read the textbook. The results are as follows:

Based on the P-value for the chi-square statistic, we can conclude (at = 0.10) that
A) there is strong evidence that grade is related to attending lecture or not.
B) there is strong evidence that grade is not related to attending lecture or not.
C) there is almost no evidence that grade is related to attending lecture or not.
D) there is almost no evidence that grade is not related to attending lecture or not.
Question
A professor wants to know if students who regularly attend lecture and read the textbook perform differently in her introductory statistics course than the students who only read the textbook. The results are as follows:

The P-value for this table's chi-square statistic is
A) less than 0.001.
B) between 0.001 and 0.01.
C) between 0.01 and 0.05.
D) between 0.05 and 0.10.
E) between 0.10 and 0.15.
The P-value for this table's chi-square statistic is
A) less than 0.001.
B) between 0.001 and 0.01.
C) between 0.01 and 0.05.
D) between 0.05 and 0.10.
E) between 0.10 and 0.15.
Question
A study of drug addicts in Amsterdam recorded how often each addict had recently injected drugs and whether or not the addict was infected with HIV, the virus that causes AIDS. Here is a two-way table of the numbers of addicts in each condition:

The P-value for this table's chi-square statistic is
A) less than 0.001.
B) between 0.01 and 0.05.
C) between 0.10 and 0.15.
D) less than 0.25.
E) greater than 0.25.
The P-value for this table's chi-square statistic is
A) less than 0.001.
B) between 0.01 and 0.05.
C) between 0.10 and 0.15.
D) less than 0.25.
E) greater than 0.25.
Question
A professor wants to know if students who regularly attend lecture and read the textbook perform differently in her introductory statistics course than the students who only read the textbook. The results are as follows:

What is the chi-square statistic for this table?
A) 5.99
B) 7.78
C) 8.65
D) 9.49
E) 13.28
What is the chi-square statistic for this table?
A) 5.99
B) 7.78
C) 8.65
D) 9.49
E) 13.28

Unlock Deck
Sign up to unlock the cards in this deck!
Unlock Deck
Unlock Deck
1/47
Play
Full screen (f)
Deck 24: Two-Way Tables and the Chi-Square Test
1
Consider the following data on college enrollment by field of study and the sex of the students:
About what percent of all female college students were enrolled in liberal arts and journalism?
A) 5%
B) 6%
C) 16%
D) 49%
E) 51%
About what percent of all female college students were enrolled in liberal arts and journalism?
A) 5%
B) 6%
C) 16%
D) 49%
E) 51%
16%
2
Here is a two-way table of the numbers of college students (U.S. citizens only) classified by racial/ethnic group and by whether they attend a public or a private college. The entries are in thousands of students.
What percent of public college students are non-Hispanic blacks?
A) 9.8%
B) 10.4%
C) 13.3%
D) 26%
E) 74%
What percent of public college students are non-Hispanic blacks?
A) 9.8%
B) 10.4%
C) 13.3%
D) 26%
E) 74%
9.8%
3
A study of college football players' involvement with sports agents interviews a sample of college sports information directors. One question concerns revamping rules concerning timing and level of player-agent contact. Here is a two-way table of the results:
How many sports information directors were interviewed?
A) 125
B) 332
C) 4
D) 9
How many sports information directors were interviewed?
A) 125
B) 332
C) 4
D) 9
332
4
Simpson's paradox occurs
A) when association and causation are both present.
B) when we analyze data using multiple regression.
C) when the chi-square statistic's value is smaller than the P-value.
D) when the nature of the observed relationship between two variables changes radically when we take into account other variables.
Unlock Deck
Unlock for access to all 47 flashcards in this deck.
Unlock Deck
k this deck
5
A study of college football players' involvement with sports agents interviews a sample of college sports information directors. One question concerns revamping rules concerning timing and level of player-agent contact. Here is a two-way table of the results:
We can summarize the relationship between the school the sports information director is from and his or her level of interest in revamping the rules by saying:
A) few of the directors are from the non-NCAA schools, more are from non-Div. I NCAA schools, and the most are from NCAA Div. I schools.
B) directors from Div. I NCAA schools are much more likely to have some interest (contrasted with none or being very interested) than the other two groups of directors.
C) the non-Div. I NCAA directors were the least likely to be very interested and the Div. I NCAA directors the least likely to be "not interested."
D) almost three-quarters of the sports information directors had at least some interest in revamping the rules.
Unlock Deck
Unlock for access to all 47 flashcards in this deck.
Unlock Deck
k this deck
6
Here is a two-way table of the numbers of college students (U.S. citizens only) classified by racial/ethnic group and by whether they attend a public or a private college. The entries are in thousands of students.
What percent of non-Hispanic black students attend public colleges?
A) 9.8%
B) 10.4%
C) 13.3%
D) 26%
E) 74%
What percent of non-Hispanic black students attend public colleges?
A) 9.8%
B) 10.4%
C) 13.3%
D) 26%
E) 74%
Unlock Deck
Unlock for access to all 47 flashcards in this deck.
Unlock Deck
k this deck
7
A study of college football players' involvement with sports agents interviews a sample of college sports information directors. One question concerns revamping rules concerning timing and level of player-agent contact. Here is a two-way table of the results:
What is the expected number of NCAA Div. I sports information directors who have some interest in revamping the rules?
A) 42
B) 120
C) 39.76
D) 110
E) 3.55
What is the expected number of NCAA Div. I sports information directors who have some interest in revamping the rules?
A) 42
B) 120
C) 39.76
D) 110
E) 3.55
Unlock Deck
Unlock for access to all 47 flashcards in this deck.
Unlock Deck
k this deck
8
During basketball practice, Ulrich made 80% of his free throws, while Franz made only 70%. Ulrich also did better in the game, making 60%, while Franz made only 50%. Here are the data:
Overall (practice plus game),
A) Ulrich made a higher percent of his free throws than Franz did.
B) Franz made a higher percent of his free throws than Ulrich did.
C) both Ulrich and Franz made exactly the same percent of their free throws.
D) Ulrich made 70% of his free throws.
E) Ulrich made a higher percent of his free throws than Franz did, and Ulrich made 70% of his free throws.
Unlock Deck
Unlock for access to all 47 flashcards in this deck.
Unlock Deck
k this deck
9
Consider the following data on college enrollment by field of study and the sex of the students:
About how many college students were studying engineering?
A) 524
B) 534
C) 53,400
D) 524,000
E) 534,000
About how many college students were studying engineering?
A) 524
B) 534
C) 53,400
D) 524,000
E) 534,000
Unlock Deck
Unlock for access to all 47 flashcards in this deck.
Unlock Deck
k this deck
10
A study of college football players' involvement with sports agents interviews a sample of college sports information directors. One question concerns revamping rules concerning timing and level of player-agent contact. Here is a two-way table of the results:
The chi-square statistic for this two-way table is 2 = 19.4 with P-value < 0.001. We can conclude that:
A) there is very strong evidence that type of college and interest in revamping student athlete/agent contact rules are related in the population of all sports information directors.
B) there is very strong evidence that type of college and interest in revamping student athlete/agent contact rules are related among the sports information directors in this sample.
C) we lack strong evidence that type of college and interest in revamping student athlete/agent contact rules are related in the population of all sports information directors.
D) we lack strong evidence that type of college and interest in revamping student athlete/agent contact rules are related among the sports information directors in this sample.
Unlock Deck
Unlock for access to all 47 flashcards in this deck.
Unlock Deck
k this deck
11
Which of these would be an example of Simpson's paradox?
A) Teachers' salaries and sales of alcoholic beverages have risen together over time, but paying teachers more does not cause higher alcohol sales.
B) Chicago Cubs have a higher winning percentage than the St. Louis Cardinals versus every N. L. Central team, but St. Louis has a higher winning percentage when we combine all N. L. Central teams.
C) The percent of surgery patients who are given Anesthetic A and who die is higher than the percent for Anesthetic B, but this is because Anesthetic A is used in more serious surgeries.
D) States in which a smaller percent of students take the SAT exam have higher median scores on the SAT.
Unlock Deck
Unlock for access to all 47 flashcards in this deck.
Unlock Deck
k this deck
12
A sample of 123 respondents is asked, "Should corporations attempt to use their financial resources to influence public policy, especially with respect to social issues?" The responses are as follows:
What is the chi-square statistic for this table?
A) 2.741
B) 1
C) 0.9276
D) 4
E) 2
What is the chi-square statistic for this table?
A) 2.741
B) 1
C) 0.9276
D) 4
E) 2
Unlock Deck
Unlock for access to all 47 flashcards in this deck.
Unlock Deck
k this deck
13
Consider the following data on college enrollment by field of study and the sex of the students:
What percent of college students were studying engineering?
A) 0.5%
B) 5%
C) 11%
D) 17%
E) 28%
What percent of college students were studying engineering?
A) 0.5%
B) 5%
C) 11%
D) 17%
E) 28%
Unlock Deck
Unlock for access to all 47 flashcards in this deck.
Unlock Deck
k this deck
14
If surgical procedure A has a higher success rate than surgical procedure B in every hospital where they are used and yet procedure B has a higher overall success rate, then we suspect that
A) Statement I: this is nonsense and it can't possibly be true.
B) Statement II: this is an example of Simpson's paradox.
C) Statement III: it must be easier to achieve success at some hospitals than at others, whatever procedure is used.
D) Statement IV: procedure B must be used predominantly in hospitals where it is easier to achieve success, while procedure A must be used predominantly where it is harder to achieve success.
E) Statments II, III, and IV are true.
Unlock Deck
Unlock for access to all 47 flashcards in this deck.
Unlock Deck
k this deck
15
Here is a two-way table of the numbers of college students (U.S. citizens only) classified by racial/ethnic group and by whether they attend a public or a private college. The entries are in thousands of students.
There is no reason to use the chi-square test on these data, because
A) the hypothesis that chi-square tests makes no sense here.
B) the data describe the entire population of college students, so there is no inference from sample to population.
C) the sample size is so large that any test will certainly be highly significant.
D) the sample size is too small to allow use of the chi-square test.
Unlock Deck
Unlock for access to all 47 flashcards in this deck.
Unlock Deck
k this deck
16
Simpson's paradox refers to the fact that
A) the direction of an association can reverse when we separate the data by the values of a third variable.
B) high correlation may not involve any cause-and-effect link between the variables.
C) the mean of a group of observations can be larger than all but one or two of the observations.
D) variables with a very strong curved relationship can have a correlation near zero.
Unlock Deck
Unlock for access to all 47 flashcards in this deck.
Unlock Deck
k this deck
17
A sample of 123 respondents is asked, "Should corporations attempt to use their financial resources to influence public policy, especially with respect to social issues?" The responses are as follows:
The chi-square statistic for this table has how many degrees of freedom?
A) 1
B) 2
C) 3
D) 4
E) 6
The chi-square statistic for this table has how many degrees of freedom?
A) 1
B) 2
C) 3
D) 4
E) 6
Unlock Deck
Unlock for access to all 47 flashcards in this deck.
Unlock Deck
k this deck
18
Here is a two-way table of the numbers of college students (U.S. citizens only) classified by racial/ethnic group and by whether they attend a public or a private college. The entries are in thousands of students.
How many non-Hispanic black college students are there?
A) 1121
B) 11,210
C) 112,100
D) 1,121,000
E) 11,210,000
How many non-Hispanic black college students are there?
A) 1121
B) 11,210
C) 112,100
D) 1,121,000
E) 11,210,000
Unlock Deck
Unlock for access to all 47 flashcards in this deck.
Unlock Deck
k this deck
19
A study of college football players' involvement with sports agents interviews a sample of college sports information directors. One question concerns revamping rules concerning timing and level of player-agent contact. Here is a two-way table of the results:
A chi-square statistic for this table will have how many degrees of freedom?
A) 3
B) 4
C) 6
D) 9
E) 12
A chi-square statistic for this table will have how many degrees of freedom?
A) 3
B) 4
C) 6
D) 9
E) 12
Unlock Deck
Unlock for access to all 47 flashcards in this deck.
Unlock Deck
k this deck
20
A sample of 123 respondents is asked, "Should corporations attempt to use their financial resources to influence public policy, especially with respect to social issues?" The responses are as follows:
What is the expected number of respondents in State A who said Yes?
A) 59
B) 34
C) 38.37
D) 80
E) 231
What is the expected number of respondents in State A who said Yes?
A) 59
B) 34
C) 38.37
D) 80
E) 231
Unlock Deck
Unlock for access to all 47 flashcards in this deck.
Unlock Deck
k this deck
21
In 2015 the Tampa Bay Rays had the following record for the season:
What is the chi-square statistic for this table?
A) 0.027
B) 1.32
C) 5.99
D) 7.43
E) 4.61
What is the chi-square statistic for this table?
A) 0.027
B) 1.32
C) 5.99
D) 7.43
E) 4.61
Unlock Deck
Unlock for access to all 47 flashcards in this deck.
Unlock Deck
k this deck
22
Here is a two-way table showing enrollment data for full-time undergraduate students in U.S. colleges and universities. The entries are thousands of students:
The chi-square statistic for this table has how many degrees of freedom?
A) 1
B) 2
C) 3
D) 4
E) 8
The chi-square statistic for this table has how many degrees of freedom?
A) 1
B) 2
C) 3
D) 4
E) 8
Unlock Deck
Unlock for access to all 47 flashcards in this deck.
Unlock Deck
k this deck
23
Here is a two-way table showing enrollment data for full-time undergraduate students in U.S. colleges and universities. The entries are thousands of students:
What percent of students in 4-year programs were 18 to 21 years old?
A) about 0.684%
B) about 3869%
C) about 49.2%
D) about 68.4%
E) None of these.
What percent of students in 4-year programs were 18 to 21 years old?
A) about 0.684%
B) about 3869%
C) about 49.2%
D) about 68.4%
E) None of these.
Unlock Deck
Unlock for access to all 47 flashcards in this deck.
Unlock Deck
k this deck
24
In 2015 the Tampa Bay Rays had the following record for the season:
The P-value for this table's chi-square statistic is:
A) between 0.01 and 0.05.
B) between 0.05 and 0.10.
C) between 0.10 and 0.15.
D) between 0.15 and 0.25.
E) greater than 0.25.
The P-value for this table's chi-square statistic is:
A) between 0.01 and 0.05.
B) between 0.05 and 0.10.
C) between 0.10 and 0.15.
D) between 0.15 and 0.25.
E) greater than 0.25.
Unlock Deck
Unlock for access to all 47 flashcards in this deck.
Unlock Deck
k this deck
25
Here is a two-way table showing enrollment data for full-time undergraduate students in U.S. colleges and universities. The entries are thousands of students:
What is the expected number (in thousands) of 18 to 21 year olds in 4-year programs?
A) 3869
B) 684
C) 3747.4
D) 2607
E) 5214
What is the expected number (in thousands) of 18 to 21 year olds in 4-year programs?
A) 3869
B) 684
C) 3747.4
D) 2607
E) 5214
Unlock Deck
Unlock for access to all 47 flashcards in this deck.
Unlock Deck
k this deck
26
A sample of 123 respondents is asked, "Should corporations attempt to use their financial resources to influence public policy, especially with respect to social issues?" The responses are as follows:
The P-value for this table's chi-square statistic is:
A) less than 0.001.
B) between 0.01 and 0.05.
C) between 0.05 and 0.10.
D) between 0.10 and 0.25..
E) greater than 0.25.
The P-value for this table's chi-square statistic is:
A) less than 0.001.
B) between 0.01 and 0.05.
C) between 0.05 and 0.10.
D) between 0.10 and 0.25..
E) greater than 0.25.
Unlock Deck
Unlock for access to all 47 flashcards in this deck.
Unlock Deck
k this deck
27
Here is a two-way table showing enrollment data for full-time undergraduate students in U.S. colleges and universities. The entries are thousands of students:
The P-value for this table's chi-square statistic is
A) less than 0.001.
B) between 0.001 and 0.01.
C) between 0.01 and 0.05.
D) between 0.05 and 0.10.
E) between 0.10 and 0.15.
The P-value for this table's chi-square statistic is
A) less than 0.001.
B) between 0.001 and 0.01.
C) between 0.01 and 0.05.
D) between 0.05 and 0.10.
E) between 0.10 and 0.15.
Unlock Deck
Unlock for access to all 47 flashcards in this deck.
Unlock Deck
k this deck
28
A study of drug addicts in Amsterdam recorded how often each addict had recently injected drugs and whether or not the addict was infected with HIV, the virus that causes AIDS. Here is a two-way table of the numbers of addicts in each condition:
The chi-square statistic for this table has how many degrees of freedom?
A) 1
B) 2
C) 3
D) 4
E) 6
The chi-square statistic for this table has how many degrees of freedom?
A) 1
B) 2
C) 3
D) 4
E) 6
Unlock Deck
Unlock for access to all 47 flashcards in this deck.
Unlock Deck
k this deck
29
In 2015 the Tampa Bay Rays had the following record for the season:
What percent of their home games did the team win?
A) 35.19 percent
B) 49.38 percent
C) 50.00 percent
D) 59.88 percent
E) 70.37 percent
What percent of their home games did the team win?
A) 35.19 percent
B) 49.38 percent
C) 50.00 percent
D) 59.88 percent
E) 70.37 percent
Unlock Deck
Unlock for access to all 47 flashcards in this deck.
Unlock Deck
k this deck
30
How can Igor have a higher GPA than Desdemona in hard courses, also have a higher GPA in easy courses, and yet have an overall GPA which is lower than hers?
A) Statement I: It's impossible.
B) Statement II: It could happen. Igor could have taken mostly hard courses while Desdemona took mostly easy courses.
C) Statement III: It could happen. Igor could have taken mostly easy courses while Desdemona took mostly hard courses.
D) Statement IV: It would happen if Igor took more credit hours than Desdemona.
E) Statements III and IV are true.
Unlock Deck
Unlock for access to all 47 flashcards in this deck.
Unlock Deck
k this deck
31
In 2015 the Tampa Bay Rays had the following record for the season:
What is the expected number of home games to be won?
A) 32.5
B) 41.48
C) 57
D) 81
E) 97
What is the expected number of home games to be won?
A) 32.5
B) 41.48
C) 57
D) 81
E) 97
Unlock Deck
Unlock for access to all 47 flashcards in this deck.
Unlock Deck
k this deck
32
A sample of 123 respondents is asked, "Should corporations attempt to use their financial resources to influence public policy, especially with respect to social issues?" The responses are as follows:
Based on the P-value for the chi-square statistic, we can conclude that:
A) there is very strong evidence that response is related to state.
B) there is very strong evidence that response is not related to state.
C) there is very little evidence that response is related to state.
D) there is very little evidence that response is not related to state.
Unlock Deck
Unlock for access to all 47 flashcards in this deck.
Unlock Deck
k this deck
33
A study of drug addicts in Amsterdam recorded how often each addict had recently injected drugs and whether or not the addict was infected with HIV, the virus that causes AIDS. Here is a two-way table of the numbers of addicts in each condition:
How many addicts did the study gather data from?
A) 156
B) 86
C) 77
D) 70
E) Can't tell from the table.
How many addicts did the study gather data from?
A) 156
B) 86
C) 77
D) 70
E) Can't tell from the table.
Unlock Deck
Unlock for access to all 47 flashcards in this deck.
Unlock Deck
k this deck
34
In 2015 the Tampa Bay Rays had the following record for the season:
The chi-square statistic for this table has how many degrees of freedom?
A) 1
B) 2
C) 3
D) 4
E) 6
The chi-square statistic for this table has how many degrees of freedom?
A) 1
B) 2
C) 3
D) 4
E) 6
Unlock Deck
Unlock for access to all 47 flashcards in this deck.
Unlock Deck
k this deck
35
In 2015 the Tampa Bay Rays had the following record for the season:
The previous questions lead to this conclusion about the relationship between where the team played and how well it did:
A) the team is more likely to win when it plays at home.
B) the team is less likely to win when it plays away.
C) there is no evidence of an association between where the team played and whether it won or lost.
D) the team is more likely to win when it plays at home, and the team is less likely to win when it plays away.
Unlock Deck
Unlock for access to all 47 flashcards in this deck.
Unlock Deck
k this deck
36
In 2015 the Tampa Bay Rays had the following record for the season:
What percent of their games did the team win for the season?
A) 35.19 percent
B) 49.38 percent
C) 58.76 percent
D) 59.88 percent
E) 70.37 percent
What percent of their games did the team win for the season?
A) 35.19 percent
B) 49.38 percent
C) 58.76 percent
D) 59.88 percent
E) 70.37 percent
Unlock Deck
Unlock for access to all 47 flashcards in this deck.
Unlock Deck
k this deck
37
Here is a two-way table showing enrollment data for full-time undergraduate students in U.S. colleges and universities. The entries are thousands of students:
What is the chi-square statistic for this table?
A) 49.88
B) 7.81
C) 5.99
D) 9.49
E) 16.27
What is the chi-square statistic for this table?
A) 49.88
B) 7.81
C) 5.99
D) 9.49
E) 16.27
Unlock Deck
Unlock for access to all 47 flashcards in this deck.
Unlock Deck
k this deck
38
A study of drug addicts in Amsterdam recorded how often each addict had recently injected drugs and whether or not the addict was infected with HIV, the virus that causes AIDS. Here is a two-way table of the numbers of addicts in each condition:
What is the chi-square statistic for this table?
A) 1.28
B) 2.77
C) 5.99
D) 7.81
E) 9.21
What is the chi-square statistic for this table?
A) 1.28
B) 2.77
C) 5.99
D) 7.81
E) 9.21
Unlock Deck
Unlock for access to all 47 flashcards in this deck.
Unlock Deck
k this deck
39
A study of drug addicts in Amsterdam recorded how often each addict had recently injected drugs and whether or not the addict was infected with HIV, the virus that causes AIDS. Here is a two-way table of the numbers of addicts in each condition:
What is the expected number of addicts with HIV that inject drugs daily?
A) 32
B) 34.6
C) 42.4
D) 70
E) 77
What is the expected number of addicts with HIV that inject drugs daily?
A) 32
B) 34.6
C) 42.4
D) 70
E) 77
Unlock Deck
Unlock for access to all 47 flashcards in this deck.
Unlock Deck
k this deck
40
Here is a two-way table showing enrollment data for full-time undergraduate students in U.S. colleges and universities. The entries are thousands of students:
How many students were 18 to 21 years old?
A) 1345
B) 5214
C) 521,400
D) 3,869,000
E) 5,214,000
How many students were 18 to 21 years old?
A) 1345
B) 5214
C) 521,400
D) 3,869,000
E) 5,214,000
Unlock Deck
Unlock for access to all 47 flashcards in this deck.
Unlock Deck
k this deck
41
A professor wants to know if students who regularly attend lecture and read the textbook perform differently in her introductory statistics course than the students who only read the textbook. The results are as follows:
The chi-square statistic for this table has how many degrees of freedom?
A) 2
B) 4
C) 5
D) 8
E) 10
The chi-square statistic for this table has how many degrees of freedom?
A) 2
B) 4
C) 5
D) 8
E) 10
Unlock Deck
Unlock for access to all 47 flashcards in this deck.
Unlock Deck
k this deck
42
A study of drug addicts in Amsterdam recorded how often each addict had recently injected drugs and whether or not the addict was infected with HIV, the virus that causes AIDS. Here is a two-way table of the numbers of addicts in each condition:
From the data in the two-way table, about what is the value of the correlation between whether an addict is infected with HIV and how often he or she injects drugs?
A) Small but positive, say, r = 0.2.
B) Quite large and positive, say, r = 0.8.
C) Very small, close to r = 0.
D) Small but negative, say, r = -0.2.
E) r makes no sense for these data.
Unlock Deck
Unlock for access to all 47 flashcards in this deck.
Unlock Deck
k this deck
43
But starting salaries for men and women are nearly the same when we look at each of Mountain Tech's schools (engineering, liberal arts, and so on) separately. This is an example of
A) using the mean when the median would be more appropriate.
B) an experiment without a control group.
C) internal inconsistency and an arithmetic mistake.
D) Simpson's paradox and more men in the schools whose graduates earn higher salaries.
A) using the mean when the median would be more appropriate.
B) an experiment without a control group.
C) internal inconsistency and an arithmetic mistake.
D) Simpson's paradox and more men in the schools whose graduates earn higher salaries.
Unlock Deck
Unlock for access to all 47 flashcards in this deck.
Unlock Deck
k this deck
44
A professor wants to know if students who regularly attend lecture and read the textbook perform differently in her introductory statistics course than the students who only read the textbook. The results are as follows:
Based on the P-value for the chi-square statistic, we can conclude (at = 0.10) that
A) there is strong evidence that grade is related to attending lecture or not.
B) there is strong evidence that grade is not related to attending lecture or not.
C) there is almost no evidence that grade is related to attending lecture or not.
D) there is almost no evidence that grade is not related to attending lecture or not.
Unlock Deck
Unlock for access to all 47 flashcards in this deck.
Unlock Deck
k this deck
45
A professor wants to know if students who regularly attend lecture and read the textbook perform differently in her introductory statistics course than the students who only read the textbook. The results are as follows:
The P-value for this table's chi-square statistic is
A) less than 0.001.
B) between 0.001 and 0.01.
C) between 0.01 and 0.05.
D) between 0.05 and 0.10.
E) between 0.10 and 0.15.
The P-value for this table's chi-square statistic is
A) less than 0.001.
B) between 0.001 and 0.01.
C) between 0.01 and 0.05.
D) between 0.05 and 0.10.
E) between 0.10 and 0.15.
Unlock Deck
Unlock for access to all 47 flashcards in this deck.
Unlock Deck
k this deck
46
A study of drug addicts in Amsterdam recorded how often each addict had recently injected drugs and whether or not the addict was infected with HIV, the virus that causes AIDS. Here is a two-way table of the numbers of addicts in each condition:
The P-value for this table's chi-square statistic is
A) less than 0.001.
B) between 0.01 and 0.05.
C) between 0.10 and 0.15.
D) less than 0.25.
E) greater than 0.25.
The P-value for this table's chi-square statistic is
A) less than 0.001.
B) between 0.01 and 0.05.
C) between 0.10 and 0.15.
D) less than 0.25.
E) greater than 0.25.
Unlock Deck
Unlock for access to all 47 flashcards in this deck.
Unlock Deck
k this deck
47
A professor wants to know if students who regularly attend lecture and read the textbook perform differently in her introductory statistics course than the students who only read the textbook. The results are as follows:
What is the chi-square statistic for this table?
A) 5.99
B) 7.78
C) 8.65
D) 9.49
E) 13.28
What is the chi-square statistic for this table?
A) 5.99
B) 7.78
C) 8.65
D) 9.49
E) 13.28
Unlock Deck
Unlock for access to all 47 flashcards in this deck.
Unlock Deck
k this deck
Unlock Deck
Unlock for access to all 47 flashcards in this deck.


