Deck 22: Consumer Preferences
Full screen (f)
Question
Question
Question
Question
Question
Question
Question
Question
Question
Question
Use the following to answer question 3:
Figure and Table: An Indifference Curve Map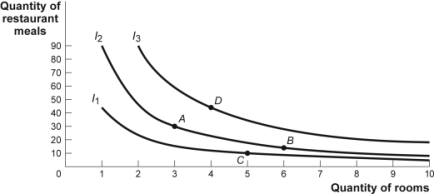
-(Figure and Table: Indifference Curve Map)Use Figure and Table An Indifference Curve Map.Combination _____ is preferred to combination _____.
A) A;B
B) B;D
C) C;A
D) B;C
Figure and Table: An Indifference Curve Map
-(Figure and Table: Indifference Curve Map)Use Figure and Table An Indifference Curve Map.Combination _____ is preferred to combination _____.
A) A;B
B) B;D
C) C;A
D) B;C
Question
Question
Question
Question
Question
Question
Question
Question
Question
Question
Question
Question
Question
Question
Question
Question
Use the following to answer question 109: 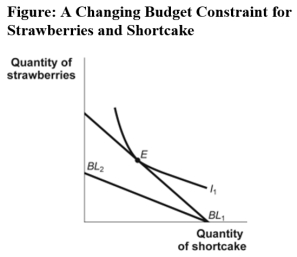
(Figure: A Changing Budget Constraint for Strawberries and Shortcake)Use Figure A Changing Budget Constraint for Strawberries and Shortcake.Seb's original budget line is given by BL1 and his original indifference curve is given by I1.Which of the following would have caused his budget line to move to BL2?
A) The price of strawberries increased.
B) The price of shortcake increased.
C) Seb's income decreased.
D) The price of strawberries decreased.
Question
Use the following to answer questions : 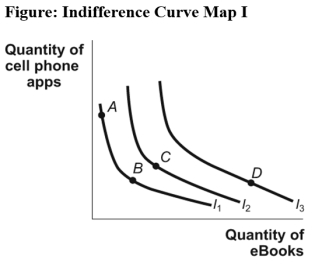
(Figure: Indifference Curve Map I)Use Figure Indifference Curve Map I.It shows that:
A) utility is higher at point A than at point B.
B) utility is diminishing on I1,constant on I2,and increasing on I3.
C) utility is higher at point D than at point A.
D) the marginal utility of e-books is positive,while the marginal utility of cell phone apps is negative.
Question
Question
Question
Question
Use the following to answer questions :
For most goods,indifference curves:
A) may intersect.
B) slope upward.
C) are concave from the origin.
D) slope downward.
For most goods,indifference curves:
A) may intersect.
B) slope upward.
C) are concave from the origin.
D) slope downward.
Question
Question
Question
Question
Question
Question
Question
Question
Use the following to answer questions :
(Figure: Indifference Curve Map I)Use Figure Indifference Curve Map I.It shows that:
A) bundles B and D provide the same level of utility.
B) bundle A is preferred to bundle B.
C) bundle D is preferred to bundle C,which is preferred to bundles A and B.
D) bundle C provides the highest level of utility.
Question
Question
Use the following to answer questions : 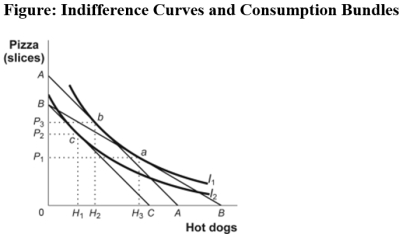
(Figure: Indifference Curves and Consumption Bundles)Use Figure Indifference Curves and Consumption Bundles.In the figure,the initial optimum is at a.The price of hot dogs now increases.The change in hot dog consumption due to the substitution effect is:
A) H3 to H2.
B) H3 to H1.
C) H2 to H1.
D) H1 to H2.
Question
Use the following to answer questions : 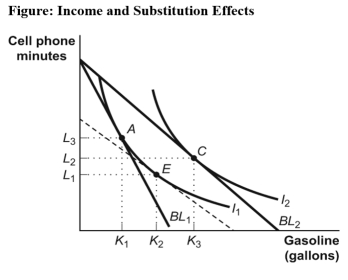
(Figure: Income and Substitution Effects)Use Figure Income and Substitution Effects.Carlos is originally consuming his optimal consumption bundle at point A when the price of gasoline falls.The movement from K1 to K2 reflects the _____ the decrease in the price of gasoline.
A) total change in quantity demanded due to
B) income effect of
C) substitution effect of
D) income and substitution effects of
Question
Use the following to answer questions :
In terms of indifference curves,a demand curve is generated by changes in:
A) the income effect.
B) the substitution effect.
C) the price of one good.
D) the price of both goods simultaneously.
In terms of indifference curves,a demand curve is generated by changes in:
A) the income effect.
B) the substitution effect.
C) the price of one good.
D) the price of both goods simultaneously.
Question
Question
Use the following to answer questions :
(Figure: Income and Substitution Effects)Use Figure Income and Substitution Effects.Carlos is consuming his optimal consumption bundle at point A when the price of gasoline falls.The dashed line tangent to I1 shows a hypothetical budget line reflecting:
A) the original income,the original price of cell phone minutes,and the new price of gasoline.
B) the new price of gasoline in terms of cell phone minutes and a change in income to keep Carlos on the original indifference curve.
C) the new price of gasoline in terms of cell phone minutes and a change in income to allow Carlos to reach an indifference curve higher than I1.
D) the income and substitution effects.
Question
Use the following to answer questions :
(Figure: Income and Substitution Effects)Use Figure Income and Substitution Effects.Carlos is consuming his optimal consumption bundle at point A when the price of gasoline falls.As Carlos moves to his new optimal consumption bundle,we observe that gasoline:
A) is not an ordinary good.
B) is a normal good.
C) is an inferior good.
D) and good L are complements.
Question
Question
Use the following to answer questions :
(Figure: Income and Substitution Effects)Use Figure Income and Substitution Effects.Carlos is consuming his optimal consumption bundle at point A when the price of gasoline falls.The movement from K2 to K3 reflects the _____ the decrease in the price of gasoline.
A) total change in quantity demanded due to
B) income effect of
C) substitution effect of
D) income and substitution effects of
Question
Use the following to answer questions :
A _____ can be generated from indifference curves by changing _____.
A) supply curve;the price of both goods simultaneously
B) demand curve;the price of one good
C) demand curve;income
D) budget line;utility
A _____ can be generated from indifference curves by changing _____.
A) supply curve;the price of both goods simultaneously
B) demand curve;the price of one good
C) demand curve;income
D) budget line;utility
Question
Question
Question
Use the following to answer questions :
Suppose peanut butter is an inferior good for Ilya and the price of peanut butter rises.What will happen to Ilya's consumption of peanut butter?
A) The substitution effect will cause an increase in the consumption of peanut butter.
B) The substitution effect will cause a decrease in the consumption of peanut butter,and the income effect will cause an increase in the consumption of peanut butter.
C) The substitution effect will cause a decrease in the consumption of peanut butter.
D) The income effect will cause an increase in the consumption of peanut butter.
Question
Question
Question
Use the following to answer questions :
(Figure: Indifference Curves and Consumption Bundles)Use Figure Indifference Curves and Consumption Bundles.In the figure,the initial optimum is at a.The price of hot dogs increases,and the new equilibrium point is c.The change in hot dog consumption due to the income effect of the price change is:
A) H3 to H2.
B) H3 to H1.
C) H2 to H1.
D) H1 to H2.
Question
Use the following to answer questions :
Javon is consuming his optimal utility-maximizing consumption bundle of lobster and macaroni-and-cheese dinners.Call this bundle A.His income is $100,the price of a macaroni-and-cheese dinner is $5,and the price of a lobster is $20.Put lobsters on the vertical axis and put macaroni-and-cheese dinners on the horizontal axis.His income increases to $500 and the prices of macaroni-and-cheese dinners and lobster remain constant.With the increase in income,Javon changes his consumption of the two goods and now maximizes utility at bundle B.If macaroni-and-cheese dinners are an inferior good for Javon:
A) at bundle B,Javon consumes more macaroni-and-cheese dinners.
B) at bundle B,Javon consumes less lobster.
C) at bundle A and bundle B,the marginal utility of lobster is 5.
D) at bundle B,Javon consumes more lobster.
Question
Question
Use the following to answer questions :
(Figure: Indifference Curves and Consumption Bundles)Use Figure Indifference Curves and Consumption Bundles.For this consumer,pizza is a(n)_____ good and hot dogs are a(n)_____ good.
A) normal;inferior
B) inferior;normal
C) normal;normal
D) inferior;inferior
(Figure: Indifference Curves and Consumption Bundles)Use Figure Indifference Curves and Consumption Bundles.For this consumer,pizza is a(n)_____ good and hot dogs are a(n)_____ good.
A) normal;inferior
B) inferior;normal
C) normal;normal
D) inferior;inferior
Question
Use the following to answer questions :
(Figure: Indifference Curves and Consumption Bundles)Use Figure Indifference Curves and Consumption Bundles.The lines AA and BC are parallel.The optimal consumption point could shift from b to c as a result of any of the following EXCEPT:
A) an equal percentage increase in the prices of hot dogs and pizza while income is unchanged.
B) a decrease in income with prices constant.
C) a change in tastes.
D) an equal percentage increase in the prices of hot dogs and pizza while income is unchanged or a decrease in income with prices constant.
Question
Use the following to answer questions :
Consumers buy both alcoholic and non-alcoholic beverages.If the government tries to discourage people from drinking alcoholic beverages by imposing an excise tax on them but gives consumers an income subsidy to keep the consumers on their original indifference curves:
A) the same amount of both goods will be consumed.
B) fewer alcoholic and more non-alcoholic beverages will be consumed.
C) more alcoholic and fewer non-alcoholic beverages will be consumed.
D) it is impossible to determine what will happen to the consumption of alcoholic and more non-alcoholic beverages.
Question
Use the following to answer questions :
Figure: Harold's Indifference Curves
The figure shows three of Harold's indifference curves for bread and cheese.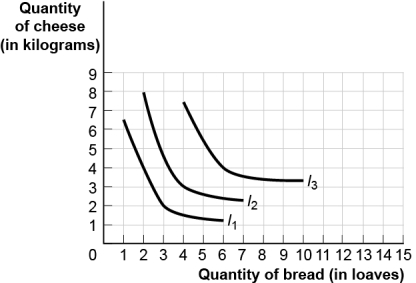
(Figure: Harold's Indifference Curves)Use Figure Harold's Indifference Curves.If the price of cheese is $2 per kilogram and Harold has $10 to spend on bread and cheese,Harold _____ his consumption of cheese as the price of bread rises from $1 to $2 per loaf,indicating that bread and cheese are _____.
A) increases;substitutes
B) increases;complements
C) decreases;substitutes
D) decreases;complements
Question
Use the following to answer questions : 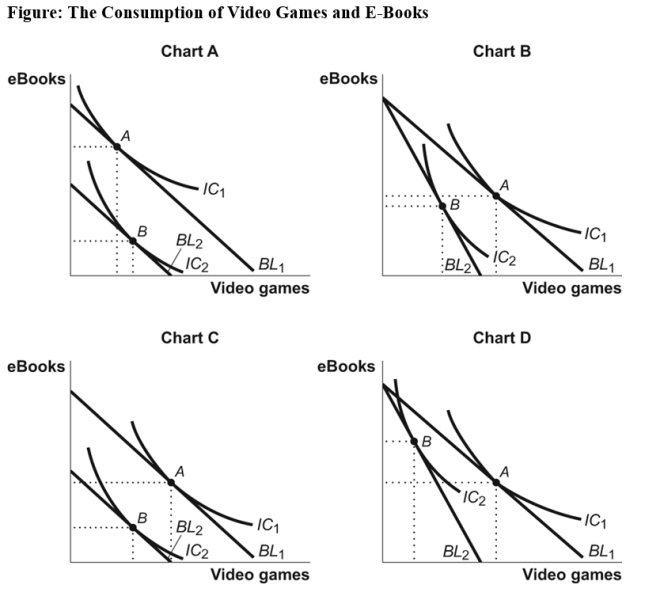
(Figure: The Consumption of Video Games and E-Books)Use Figure The Consumption of Video Games and E-Books.Which chart shows the effect of a decrease in income when both video games and e-books are normal goods?
A) a
B) b
C) c
D) d
(Figure: The Consumption of Video Games and E-Books)Use Figure The Consumption of Video Games and E-Books.Which chart shows the effect of a decrease in income when both video games and e-books are normal goods?
A) a
B) b
C) c
D) d
Question
Use the following to answer questions :
(Figure: The Consumption of Video Games and E-Books)Use Figure The Consumption of Video Games and E-Books.Which chart in the figure shows the effects of an increase in the price of video games when video games and e-books are complements but not perfect complements?
A) a
B) b
C) c
D) d
(Figure: The Consumption of Video Games and E-Books)Use Figure The Consumption of Video Games and E-Books.Which chart in the figure shows the effects of an increase in the price of video games when video games and e-books are complements but not perfect complements?
A) a
B) b
C) c
D) d
Question
Use the following to answer questions :
Figure: Harold's Indifference Curves
The figure shows three of Harold's indifference curves for bread and cheese.
(Figure: Harold's Indifference Curves)Use Figure Harold's Indifference Curves.Given that the price of bread is $1 per loaf and the price of cheese is $2 per kilogram,as Harold's income increases from $10 to $14,we can determine that bread is a(n)_____ good and cheese is a(n)_____ good.
A) inferior;inferior
B) normal;inferior
C) inferior;normal
D) normal;normal
Question
Use the following to answer questions :
Figure: The Optimal Consumption Bundle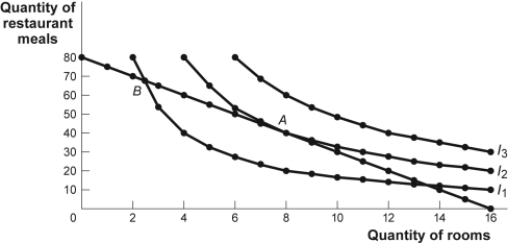
(Figure: The Optimal Consumption Bundle)Use Figure The Optimal Consumption Bundle.Which of the following could lead to an optimal consumption bundle on indifference curve I3?
A) a decrease in income
B) a decrease in the price of restaurant meals
C) an increase in the price of rooms
D) an increase in the price of restaurant meals
Question
Use the following to answer questions :
Figure: The Optimal Consumption Bundle
(Figure: The Optimal Consumption Bundle)Use Figure The Optimal Consumption Bundle.Which of the following could lead to an optimal consumption bundle on indifference curve I1?
A) an increase in income
B) a decrease in the price of restaurant meals
C) a decrease in the price of rooms
D) a decrease in income
Question
Use the following to answer questions :
Figure: Harold's Indifference Curves
The figure shows three of Harold's indifference curves for bread and cheese.
(Figure: Harold's Indifference Curves)Use Figure Harold's Indifference Curves.If the price of bread is $1 per loaf,the price of cheese is $2 per kilogram,and Harold has $14 to spend on bread and cheese,Harold's optimal consumption bundle is _____ loaves of bread and _____ kilograms of cheese.
A) 6;4
B) 4;3
C) 3;2
D) 2;8
Question
Use the following to answer questions :
Figure: The Optimal Consumption Bundle
(Figure: The Optimal Consumption Bundle)Use Figure The Optimal Consumption Bundle.Which of the following could lead to an optimal consumption bundle on indifference curve I3?
A) a decrease in income
B) an increase in the price of restaurant meals
C) a decrease in the price of rooms
D) an increase in the price of rooms
Question
Use the following to answer questions :
Figure: The Optimal Consumption Bundle
(Figure: The Optimal Consumption Bundle)Use Figure The Optimal Consumption Bundle.If the price of restaurant meals _____,then the optimal consumption bundle will be on _____ indifference curve.
A) increases;a higher
B) decreases;a higher
C) decreases;a lower
D) increases;the same
Question
Use the following to answer questions :
Figure: Harold's Indifference Curves
The figure shows three of Harold's indifference curves for bread and cheese.
(Figure: Harold's Indifference Curves)Use Figure Harold's Indifference Curves.The price of cheese is $2 per kilogram and Harold has $10 to spend on bread and cheese.As the price of bread rises from $1 to $2 per loaf,his consumption of bread:
A) increases from 2 to 3 loaves.
B) decreases from 3 to 2 loaves.
C) increases from 3 to 4 loaves.
D) decreases from 4 to 3 loaves.
Question
Use the following to answer questions : 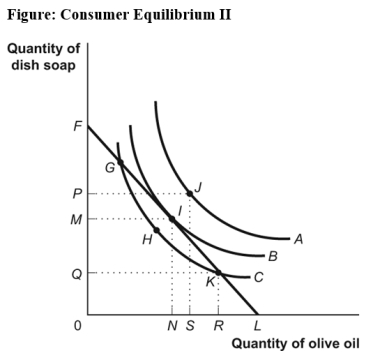
(Figure: Consumer Equilibrium II)Use Figure Consumer Equilibrium II.The HIGHEST level of total utility is associated with point _____ on indifference curve _____.
A) H;C
B) I;B
C) G;B
D) J;A
(Figure: Consumer Equilibrium II)Use Figure Consumer Equilibrium II.The HIGHEST level of total utility is associated with point _____ on indifference curve _____.
A) H;C
B) I;B
C) G;B
D) J;A
Question
Use the following to answer questions :
Figure: The Optimal Consumption Bundle
(Figure: The Optimal Consumption Bundle)Use Figure The Optimal Consumption Bundle.Which of the following could lead to an optimal consumption bundle on indifference curve I3?
A) an increase in income
B) an increase in the price of restaurant meals
C) an increase in the price of rooms
D) a decrease in income
Question
Use the following to answer questions :
(Figure: Consumer Equilibrium II)Use Figure Consumer Equilibrium II.The LOWEST level of total utility shown in the figure is associated with point _____ on curve _____.
A) H;A
B) I;B
C) G;C
D) J;A
(Figure: Consumer Equilibrium II)Use Figure Consumer Equilibrium II.The LOWEST level of total utility shown in the figure is associated with point _____ on curve _____.
A) H;A
B) I;B
C) G;C
D) J;A
Question
Use the following to answer questions :
Figure: Harold's Indifference Curves
The figure shows three of Harold's indifference curves for bread and cheese.
(Figure: Harold's Indifference Curves)Use Figure Harold's Indifference Curves.If the price of bread is $0.50 per loaf,the price of cheese is $1 per kilogram,and Harold has $7 to spend on bread and cheese,Harold's optimal consumption bundle is _____ loaves of bread and _____ kilograms of cheese.
A) 6;4
B) 4;3
C) 3;2
D) 2;8
Question
Use the following to answer questions :
Figure: Harold's Indifference Curves
The figure shows three of Harold's indifference curves for bread and cheese.
(Figure: Harold's Indifference Curves)Use Figure Harold's Indifference Curves.If the price of bread is $2 per loaf,the price of cheese is $2 per kilogram,and Harold has $10 to spend on bread and cheese,Harold's optimal consumption bundle is _____ loaves of bread and _____ kilograms of cheese.
A) 6;4
B) 4;3
C) 3;2
D) 2;8
Question
Use the following to answer questions :
Figure: Harold's Indifference Curves
The figure shows three of Harold's indifference curves for bread and cheese.
(Figure: Harold's Indifference Curves)Use Figure Harold's Indifference Curves.If the price of bread is $2 per loaf,the price of cheese is $4 per kilogram,and Harold has $28 to spend on bread and cheese,Harold's optimal consumption bundle is _____ loaves of bread and _____ kilograms of cheese.
A) 6;4
B) 4;3
C) 3;2
D) 2;8
Question
Use the following to answer questions :
Figure: The Optimal Consumption Bundle
(Figure: The Optimal Consumption Bundle)Use Figure The Optimal Consumption Bundle.Which of the following could lead to an optimal consumption bundle on indifference curve I1?
A) an increase in income
B) an increase in the price of restaurant meals
C) a decrease in the price of rooms
D) a decrease in the price of restaurant meals
Question
Use the following to answer questions :
Figure: Harold's Indifference Curves
The figure shows three of Harold's indifference curves for bread and cheese.
(Figure: Harold's Indifference Curves)Use Figure Harold's Indifference Curves.If the price of bread is $1 per loaf,the price of cheese is $2 per kilogram,and Harold has $10 to spend on bread and cheese,Harold's optimal consumption bundle is _____ loaves of bread and _____ kilograms of cheese.
A) 6;4
B) 4;3
C) 3;2
D) 2;8
Question
Use the following to answer questions :
(Figure: The Consumption of Video Games and E-Books)Use Figure The Consumption of Video Games and E-Books.Which chart shows the effects of an increase in the price of video games when video games and e-books are substitutes but not perfect substitutes?
A) a
B) b
C) c
D) d
(Figure: The Consumption of Video Games and E-Books)Use Figure The Consumption of Video Games and E-Books.Which chart shows the effects of an increase in the price of video games when video games and e-books are substitutes but not perfect substitutes?
A) a
B) b
C) c
D) d
Question
Use the following to answer questions :
(Figure: The Consumption of Video Games and E-Books)Use Figure The Consumption of Video Games and E-Books.Which chart shows the effects of a decrease in income when video games are an inferior good and e-books are a normal good?
A) a
B) b
C) c
D) d
(Figure: The Consumption of Video Games and E-Books)Use Figure The Consumption of Video Games and E-Books.Which chart shows the effects of a decrease in income when video games are an inferior good and e-books are a normal good?
A) a
B) b
C) c
D) d

Unlock Deck
Sign up to unlock the cards in this deck!
Unlock Deck
Unlock Deck
1/153
Play
Full screen (f)
Deck 22: Consumer Preferences
1
An indifference curve is a line showing all of the consumption bundles that:
A) an individual can purchase with a given income.
B) yield the same total utility for an individual.
C) yield the same marginal utility.
D) have the same marginal rate of substitution.
A) an individual can purchase with a given income.
B) yield the same total utility for an individual.
C) yield the same marginal utility.
D) have the same marginal rate of substitution.
yield the same total utility for an individual.
2
An indifference curve shows combinations of two goods that yield:
A) equal prices.
B) equal money income.
C) equal satisfaction.
D) increasing prices.
A) equal prices.
B) equal money income.
C) equal satisfaction.
D) increasing prices.
equal satisfaction.
3
If a consumer moves upward along an indifference curve,his or her total utility:
A) remains constant.
B) first decreases,then increases.
C) increases.
D) first increases,then decreases.
A) remains constant.
B) first decreases,then increases.
C) increases.
D) first increases,then decreases.
remains constant.
4
If two combinations of two goods yield the same level of satisfaction,then they are on:
A) the same price line.
B) the same budget constraint.
C) the same indifference curve.
D) different indifference curves.
A) the same price line.
B) the same budget constraint.
C) the same indifference curve.
D) different indifference curves.
Unlock Deck
Unlock for access to all 153 flashcards in this deck.
Unlock Deck
k this deck
5
Combinations of two goods that yield equal levels of utility are shown on a(n)_____ curve.
A) indifference
B) budget
C) marginal utility
D) utility-maximizing
A) indifference
B) budget
C) marginal utility
D) utility-maximizing
Unlock Deck
Unlock for access to all 153 flashcards in this deck.
Unlock Deck
k this deck
6
Higher indifference curves represent _____ lower curves.
A) less utility than
B) more utility than
C) the same utility as
D) either more or less utility than
A) less utility than
B) more utility than
C) the same utility as
D) either more or less utility than
Unlock Deck
Unlock for access to all 153 flashcards in this deck.
Unlock Deck
k this deck
7
If combination A lies on a higher indifference curve than combination B and combination B lies on a higher indifference curve than combination C,it must be that the total utility associated with combination A is _____ the total utility associated with combination C.
A) less than
B) more than
C) equal to
D) more than or equal to
A) less than
B) more than
C) equal to
D) more than or equal to
Unlock Deck
Unlock for access to all 153 flashcards in this deck.
Unlock Deck
k this deck
8
Use the following to answer questions :
-(Table: Bundles of X and Y)Use Table Bundles of X and Y.According to the table:
A) bundle D is preferred to bundles A and B.
B) the consumer is indifferent among bundles A,B,and C.
C) bundles C and D are both preferred to bundles A and B.
D) bundle C is preferred to all other bundles.
-(Table: Bundles of X and Y)Use Table Bundles of X and Y.According to the table:
A) bundle D is preferred to bundles A and B.
B) the consumer is indifferent among bundles A,B,and C.
C) bundles C and D are both preferred to bundles A and B.
D) bundle C is preferred to all other bundles.
Unlock Deck
Unlock for access to all 153 flashcards in this deck.
Unlock Deck
k this deck
9
In terms of indifference curves,an increase in total utility is represented by a _____ indifference curve.
A) shift to the right to a higher
B) shift to the left to a lower
C) movement upward along an
D) movement downward along an
A) shift to the right to a higher
B) shift to the left to a lower
C) movement upward along an
D) movement downward along an
Unlock Deck
Unlock for access to all 153 flashcards in this deck.
Unlock Deck
k this deck
10
Use the following to answer question 3:
Figure and Table: An Indifference Curve Map
-(Figure and Table: Indifference Curve Map)Use Figure and Table An Indifference Curve Map.Combination _____ is preferred to combination _____.
A) A;B
B) B;D
C) C;A
D) B;C
Figure and Table: An Indifference Curve Map
-(Figure and Table: Indifference Curve Map)Use Figure and Table An Indifference Curve Map.Combination _____ is preferred to combination _____.
A) A;B
B) B;D
C) C;A
D) B;C
Unlock Deck
Unlock for access to all 153 flashcards in this deck.
Unlock Deck
k this deck
11
When Laurie asks Matt if he wants a large popcorn and small soda or a large soda and small popcorn,Matt says,"Oh,I'm indifferent." This means Matt:
A) doesn't want popcorn and soda.
B) thinks both bundles give him the same utility.
C) thinks neither bundle gives him utility.
D) thinks the utility he gained from popcorn and soda exactly equals their cost.
A) doesn't want popcorn and soda.
B) thinks both bundles give him the same utility.
C) thinks neither bundle gives him utility.
D) thinks the utility he gained from popcorn and soda exactly equals their cost.
Unlock Deck
Unlock for access to all 153 flashcards in this deck.
Unlock Deck
k this deck
12
A curve that represents combinations of two goods that yield equal levels of satisfaction is a(n):
A) indifference curve.
B) budget curve.
C) marginal utility curve.
D) price-consumption curve.
A) indifference curve.
B) budget curve.
C) marginal utility curve.
D) price-consumption curve.
Unlock Deck
Unlock for access to all 153 flashcards in this deck.
Unlock Deck
k this deck
13
A(n)_____ is a curve that shows all of the consumption bundles that yield the same level of total utility for an individual.
A) budget line
B) indifference curve
C) utility function
D) marginal rate of substitution
A) budget line
B) indifference curve
C) utility function
D) marginal rate of substitution
Unlock Deck
Unlock for access to all 153 flashcards in this deck.
Unlock Deck
k this deck
14
Use the following to answer questions :
-(Table: Bundles of X and Y)Use Table Bundles of X and Y.Bundle(s):
A) A and B are on the same indifference curve.
B) A and C are on the same indifference curve.
C) D is on the highest indifference curve.
D) C is on the highest indifference curve,and bundles A and B are on the lowest indifference curve.
Unlock Deck
Unlock for access to all 153 flashcards in this deck.
Unlock Deck
k this deck
15
Higher total utility is represented by _____ indifference curve.
A) a higher
B) a lower
C) movement leftward along an
D) movement rightward along an
A) a higher
B) a lower
C) movement leftward along an
D) movement rightward along an
Unlock Deck
Unlock for access to all 153 flashcards in this deck.
Unlock Deck
k this deck
16
Higher indifference curves represent:
A) less utility than lower indifference curves.
B) more utility than lower indifference curves.
C) the same level of utility as lower indifference curves.
D) unknown levels of utility compared to lower indifference curves.
A) less utility than lower indifference curves.
B) more utility than lower indifference curves.
C) the same level of utility as lower indifference curves.
D) unknown levels of utility compared to lower indifference curves.
Unlock Deck
Unlock for access to all 153 flashcards in this deck.
Unlock Deck
k this deck
17
Use the following to answer questions :
-If a consumer moves downward along an indifference curve,his or her total utility:
A) remains constant.
B) first decreases,then increases.
C) decreases.
D) first increases,then decreases.
-If a consumer moves downward along an indifference curve,his or her total utility:
A) remains constant.
B) first decreases,then increases.
C) decreases.
D) first increases,then decreases.
Unlock Deck
Unlock for access to all 153 flashcards in this deck.
Unlock Deck
k this deck
18
Assume that two combinations of two goods yield the same level of satisfaction.We can conclude that these combinations are always on:
A) the same price line.
B) the same budget constraint.
C) the same indifference curve.
D) different indifference curves.
A) the same price line.
B) the same budget constraint.
C) the same indifference curve.
D) different indifference curves.
Unlock Deck
Unlock for access to all 153 flashcards in this deck.
Unlock Deck
k this deck
19
Use the following to answer questions :
-Consumption bundles that yield equal levels of total utility are shown on the same:
A) budget line.
B) marginal utility curve.
C) indifference curve.
D) utility-maximizing curve.
-Consumption bundles that yield equal levels of total utility are shown on the same:
A) budget line.
B) marginal utility curve.
C) indifference curve.
D) utility-maximizing curve.
Unlock Deck
Unlock for access to all 153 flashcards in this deck.
Unlock Deck
k this deck
20
The slope of a(n)_____ curve shows the rate at which two goods can be exchanged _____ the consumer's _____.
A) marginal utility;by increasing;marginal utility
B) indifference;without affecting;total utility
C) utility;without affecting;budget
D) indifference;without affecting;budget
A) marginal utility;by increasing;marginal utility
B) indifference;without affecting;total utility
C) utility;without affecting;budget
D) indifference;without affecting;budget
Unlock Deck
Unlock for access to all 153 flashcards in this deck.
Unlock Deck
k this deck
21
One point on a standard indifference curve is eight cookies and two brownies;another is six cookies and four brownies.Which of the following combinations of cookies and brownies could lie on this indifference curve?
A) six cookies and 10 brownies
B) seven cookies and six brownies
C) four cookies and four brownies
D) four cookies and eight brownies
A) six cookies and 10 brownies
B) seven cookies and six brownies
C) four cookies and four brownies
D) four cookies and eight brownies
Unlock Deck
Unlock for access to all 153 flashcards in this deck.
Unlock Deck
k this deck
22
Increases in the price of the good measured on the horizontal axis will make the horizontal intercept _____ and make the budget line _____.
A) larger;steeper
B) larger;flatter
C) smaller;steeper
D) smaller;flatter
A) larger;steeper
B) larger;flatter
C) smaller;steeper
D) smaller;flatter
Unlock Deck
Unlock for access to all 153 flashcards in this deck.
Unlock Deck
k this deck
23
An indifference curve typically:
A) slopes downward.
B) shows combinations of two goods that yield equal money income.
C) slopes upward.
D) is concave.
A) slopes downward.
B) shows combinations of two goods that yield equal money income.
C) slopes upward.
D) is concave.
Unlock Deck
Unlock for access to all 153 flashcards in this deck.
Unlock Deck
k this deck
24
Decreases in the price of the good measured on the vertical axis will make the vertical intercept _____ and make the budget line _____.
A) larger;steeper
B) larger;flatter
C) smaller;steeper
D) smaller;flatter
A) larger;steeper
B) larger;flatter
C) smaller;steeper
D) smaller;flatter
Unlock Deck
Unlock for access to all 153 flashcards in this deck.
Unlock Deck
k this deck
25
Manny consumes only bananas and DVDs,and he is on his highest possible indifference curve.Two bundles on this indifference curve are bundle A (five bananas and two DVDs)and bundle B (three bananas and three DVDs).Between points A and B,what is Manny's marginal rate of substitution of bananas for DVDs?
A) 1
B) 2
C) 0.5
D) 1.33
A) 1
B) 2
C) 0.5
D) 1.33
Unlock Deck
Unlock for access to all 153 flashcards in this deck.
Unlock Deck
k this deck
26
Use the following to answer question 109:
(Figure: A Changing Budget Constraint for Strawberries and Shortcake)Use Figure A Changing Budget Constraint for Strawberries and Shortcake.Seb's original budget line is given by BL1 and his original indifference curve is given by I1.Which of the following would have caused his budget line to move to BL2?
A) The price of strawberries increased.
B) The price of shortcake increased.
C) Seb's income decreased.
D) The price of strawberries decreased.
Unlock Deck
Unlock for access to all 153 flashcards in this deck.
Unlock Deck
k this deck
27
Use the following to answer questions :
(Figure: Indifference Curve Map I)Use Figure Indifference Curve Map I.It shows that:
A) utility is higher at point A than at point B.
B) utility is diminishing on I1,constant on I2,and increasing on I3.
C) utility is higher at point D than at point A.
D) the marginal utility of e-books is positive,while the marginal utility of cell phone apps is negative.
Unlock Deck
Unlock for access to all 153 flashcards in this deck.
Unlock Deck
k this deck
28
Decreases in the price of the good measured on the horizontal axis will make the horizontal intercept _____ and make the budget line _____.
A) larger;steeper
B) larger;flatter
C) smaller;steeper
D) smaller;flatter
A) larger;steeper
B) larger;flatter
C) smaller;steeper
D) smaller;flatter
Unlock Deck
Unlock for access to all 153 flashcards in this deck.
Unlock Deck
k this deck
29
Suppose the government decides to help poor families with kids by subsidizing the purchase of milk.The subsidy takes the form of a 50% discount on the price of milk.Suppose also that poor families buy only milk and soda,which are substitutes,although not perfect substitutes.What happens to the amount of milk poor families buy?
A) It increases.
B) It decreases.
C) It stays the same.
D) It depends on the shape of the family's indifference curve.
A) It increases.
B) It decreases.
C) It stays the same.
D) It depends on the shape of the family's indifference curve.
Unlock Deck
Unlock for access to all 153 flashcards in this deck.
Unlock Deck
k this deck
30
Max consumes only yoghurt and almonds,and he is on his highest possible indifference curve.Bundle A (four yoghurts and two almonds)and bundle B (three yoghurts and three almonds)are on this indifference curve.Between points A and B,what is Max's marginal rate of substitution of yoghurt for almonds?
A) 1
B) 2
C) 3
D) 1.33
A) 1
B) 2
C) 3
D) 1.33
Unlock Deck
Unlock for access to all 153 flashcards in this deck.
Unlock Deck
k this deck
31
Use the following to answer questions :
For most goods,indifference curves:
A) may intersect.
B) slope upward.
C) are concave from the origin.
D) slope downward.
For most goods,indifference curves:
A) may intersect.
B) slope upward.
C) are concave from the origin.
D) slope downward.
Unlock Deck
Unlock for access to all 153 flashcards in this deck.
Unlock Deck
k this deck
32
Which of the following is NOT TRUE of indifference curves for ordinary goods?
A) They never cross.
B) They slope downward.
C) They are convex from the origin.
D) Indifference curves farther from the origin have lower levels of utility.
A) They never cross.
B) They slope downward.
C) They are convex from the origin.
D) Indifference curves farther from the origin have lower levels of utility.
Unlock Deck
Unlock for access to all 153 flashcards in this deck.
Unlock Deck
k this deck
33
Increases in the price of the good measured on the vertical axis will make the vertical intercept _____ and make the budget line _____.
A) larger;steeper
B) larger;flatter
C) smaller;steeper
D) smaller;flatter
A) larger;steeper
B) larger;flatter
C) smaller;steeper
D) smaller;flatter
Unlock Deck
Unlock for access to all 153 flashcards in this deck.
Unlock Deck
k this deck
34
Greater levels of utility are represented by:
A) indifference curves that are farther from the origin.
B) indifference curves that are closer to the origin.
C) moving up to the left on the same indifference curve.
D) moving down to the right on the same indifference curve.
A) indifference curves that are farther from the origin.
B) indifference curves that are closer to the origin.
C) moving up to the left on the same indifference curve.
D) moving down to the right on the same indifference curve.
Unlock Deck
Unlock for access to all 153 flashcards in this deck.
Unlock Deck
k this deck
35
Suppose the government decides to help poor families with kids by subsidizing the purchase of milk.The subsidy takes the form of a 50% discount in the price of milk.Suppose also that poor families buy only milk and Spam (an inferior good).What happens to the amount of Spam poor families buy?
A) It increases.
B) It decreases.
C) It stays the same.
D) It depends on the shape of the family's indifference curve.
A) It increases.
B) It decreases.
C) It stays the same.
D) It depends on the shape of the family's indifference curve.
Unlock Deck
Unlock for access to all 153 flashcards in this deck.
Unlock Deck
k this deck
36
Gwen is consuming the optimal consumption bundle of potatoes and steak.Call this bundle A.Her income is $100,the price of steak is $10,and the price of potatoes is $1.Put potatoes on the vertical axis and put steak on the horizontal axis.Her income increases to $500,and the prices of steak and potatoes remain constant.With the increase in income,Gwen changes her consumption of the two goods and now maximizes utility at bundle B.If potatoes are inferior goods for Gwen,
A) at bundle B,Gwen consumes more potatoes.
B) at bundle B,Gwen consumes fewer steaks.
C) at both bundles,the relative price is 10.
D) at both bundles,Gwen consumes the same amount of potatoes and steaks.
A) at bundle B,Gwen consumes more potatoes.
B) at bundle B,Gwen consumes fewer steaks.
C) at both bundles,the relative price is 10.
D) at both bundles,Gwen consumes the same amount of potatoes and steaks.
Unlock Deck
Unlock for access to all 153 flashcards in this deck.
Unlock Deck
k this deck
37
For most goods,as we move down an indifference curve:
A) the slope gets flatter.
B) the slope gets steeper.
C) the slope stays the same.
D) total utility decreases.
A) the slope gets flatter.
B) the slope gets steeper.
C) the slope stays the same.
D) total utility decreases.
Unlock Deck
Unlock for access to all 153 flashcards in this deck.
Unlock Deck
k this deck
38
One point on an indifference curve that displays a diminishing marginal rate of substitution between apples and oranges is 10 apples and two oranges;another is eight apples and four oranges.Which of the following combinations of apples and oranges could also lie on this indifference curve?
A) 10 apples and six oranges
B) six apples and seven oranges
C) nine apples and four oranges
D) eight apples and three oranges
A) 10 apples and six oranges
B) six apples and seven oranges
C) nine apples and four oranges
D) eight apples and three oranges
Unlock Deck
Unlock for access to all 153 flashcards in this deck.
Unlock Deck
k this deck
39
Use the following to answer questions :
(Figure: Indifference Curve Map I)Use Figure Indifference Curve Map I.It shows that:
A) bundles B and D provide the same level of utility.
B) bundle A is preferred to bundle B.
C) bundle D is preferred to bundle C,which is preferred to bundles A and B.
D) bundle C provides the highest level of utility.
Unlock Deck
Unlock for access to all 153 flashcards in this deck.
Unlock Deck
k this deck
40
The slope of a(n)_____ curve shows the rate at which two goods can be exchanged _____.
A) indifference;without changing the total budget
B) utility;without changing the total budget
C) indifference;without changing total utility
D) marginal utility;to increase the consumer's marginal utility
A) indifference;without changing the total budget
B) utility;without changing the total budget
C) indifference;without changing total utility
D) marginal utility;to increase the consumer's marginal utility
Unlock Deck
Unlock for access to all 153 flashcards in this deck.
Unlock Deck
k this deck
41
Use the following to answer questions :
(Figure: Indifference Curves and Consumption Bundles)Use Figure Indifference Curves and Consumption Bundles.In the figure,the initial optimum is at a.The price of hot dogs now increases.The change in hot dog consumption due to the substitution effect is:
A) H3 to H2.
B) H3 to H1.
C) H2 to H1.
D) H1 to H2.
Unlock Deck
Unlock for access to all 153 flashcards in this deck.
Unlock Deck
k this deck
42
Use the following to answer questions :
(Figure: Income and Substitution Effects)Use Figure Income and Substitution Effects.Carlos is originally consuming his optimal consumption bundle at point A when the price of gasoline falls.The movement from K1 to K2 reflects the _____ the decrease in the price of gasoline.
A) total change in quantity demanded due to
B) income effect of
C) substitution effect of
D) income and substitution effects of
Unlock Deck
Unlock for access to all 153 flashcards in this deck.
Unlock Deck
k this deck
43
Use the following to answer questions :
In terms of indifference curves,a demand curve is generated by changes in:
A) the income effect.
B) the substitution effect.
C) the price of one good.
D) the price of both goods simultaneously.
In terms of indifference curves,a demand curve is generated by changes in:
A) the income effect.
B) the substitution effect.
C) the price of one good.
D) the price of both goods simultaneously.
Unlock Deck
Unlock for access to all 153 flashcards in this deck.
Unlock Deck
k this deck
44
A demand curve is generated from indifference curves by changing:
A) the price of both goods simultaneously.
B) the price of one good.
C) income.
D) utility.
A) the price of both goods simultaneously.
B) the price of one good.
C) income.
D) utility.
Unlock Deck
Unlock for access to all 153 flashcards in this deck.
Unlock Deck
k this deck
45
Use the following to answer questions :
(Figure: Income and Substitution Effects)Use Figure Income and Substitution Effects.Carlos is consuming his optimal consumption bundle at point A when the price of gasoline falls.The dashed line tangent to I1 shows a hypothetical budget line reflecting:
A) the original income,the original price of cell phone minutes,and the new price of gasoline.
B) the new price of gasoline in terms of cell phone minutes and a change in income to keep Carlos on the original indifference curve.
C) the new price of gasoline in terms of cell phone minutes and a change in income to allow Carlos to reach an indifference curve higher than I1.
D) the income and substitution effects.
Unlock Deck
Unlock for access to all 153 flashcards in this deck.
Unlock Deck
k this deck
46
Use the following to answer questions :
(Figure: Income and Substitution Effects)Use Figure Income and Substitution Effects.Carlos is consuming his optimal consumption bundle at point A when the price of gasoline falls.As Carlos moves to his new optimal consumption bundle,we observe that gasoline:
A) is not an ordinary good.
B) is a normal good.
C) is an inferior good.
D) and good L are complements.
Unlock Deck
Unlock for access to all 153 flashcards in this deck.
Unlock Deck
k this deck
47
Frank buys only milk and cereal,both of which are normal goods,and he always maximizes his utility.Frank's boss cuts Frank's pay by $200 per month.What happens to Frank's marginal rate of substitution between milk and cereal?
A) It fluctuates randomly.
B) It decreases.
C) It increases.
D) It stays constant.
A) It fluctuates randomly.
B) It decreases.
C) It increases.
D) It stays constant.
Unlock Deck
Unlock for access to all 153 flashcards in this deck.
Unlock Deck
k this deck
48
Use the following to answer questions :
(Figure: Income and Substitution Effects)Use Figure Income and Substitution Effects.Carlos is consuming his optimal consumption bundle at point A when the price of gasoline falls.The movement from K2 to K3 reflects the _____ the decrease in the price of gasoline.
A) total change in quantity demanded due to
B) income effect of
C) substitution effect of
D) income and substitution effects of
Unlock Deck
Unlock for access to all 153 flashcards in this deck.
Unlock Deck
k this deck
49
Use the following to answer questions :
A _____ can be generated from indifference curves by changing _____.
A) supply curve;the price of both goods simultaneously
B) demand curve;the price of one good
C) demand curve;income
D) budget line;utility
A _____ can be generated from indifference curves by changing _____.
A) supply curve;the price of both goods simultaneously
B) demand curve;the price of one good
C) demand curve;income
D) budget line;utility
Unlock Deck
Unlock for access to all 153 flashcards in this deck.
Unlock Deck
k this deck
50
If ramen is a Giffen good and the price of ramen decreases:
A) the substitution effect will cause a decrease in the consumption of ramen.
B) the income effect will cause a decrease in the consumption of ramen.
C) the income effect will reinforce the substitution effect,and the consumption of ramen will decrease.
D) the demand curve for ramen will still be downward sloping.
Unlock Deck
Unlock for access to all 153 flashcards in this deck.
Unlock Deck
k this deck
51
If potatoes are an inferior good and the price of potatoes decreases,the _____ effect(s)will cause a(n)_____ in the consumption of potatoes.
A) substitution;decrease
B) income;increase
C) income;decrease
D) substitution and income;decrease
A) substitution;decrease
B) income;increase
C) income;decrease
D) substitution and income;decrease
Unlock Deck
Unlock for access to all 153 flashcards in this deck.
Unlock Deck
k this deck
52
Use the following to answer questions :
Suppose peanut butter is an inferior good for Ilya and the price of peanut butter rises.What will happen to Ilya's consumption of peanut butter?
A) The substitution effect will cause an increase in the consumption of peanut butter.
B) The substitution effect will cause a decrease in the consumption of peanut butter,and the income effect will cause an increase in the consumption of peanut butter.
C) The substitution effect will cause a decrease in the consumption of peanut butter.
D) The income effect will cause an increase in the consumption of peanut butter.
Unlock Deck
Unlock for access to all 153 flashcards in this deck.
Unlock Deck
k this deck
53
Javon is consuming his optimal utility-maximizing consumption bundle of lobster and macaroni-and-cheese dinners when he loses his job and has less money to spend.Both are normal goods.When he adjusts his consumption to reflect the new level of income,the number of macaroni-and-cheese dinners he consumes:
A) rises.
B) falls.
C) stays the same.
D) changes,but it is impossible to determine in what way.
A) rises.
B) falls.
C) stays the same.
D) changes,but it is impossible to determine in what way.
Unlock Deck
Unlock for access to all 153 flashcards in this deck.
Unlock Deck
k this deck
54
If good A is a normal good and its price decreases,the _____ effect(s)will cause a(n)_____ in consumption of it.
A) substitution;decrease
B) income;decrease
C) income;increase
D) substitution and income ;decrease
A) substitution;decrease
B) income;decrease
C) income;increase
D) substitution and income ;decrease
Unlock Deck
Unlock for access to all 153 flashcards in this deck.
Unlock Deck
k this deck
55
Use the following to answer questions :
(Figure: Indifference Curves and Consumption Bundles)Use Figure Indifference Curves and Consumption Bundles.In the figure,the initial optimum is at a.The price of hot dogs increases,and the new equilibrium point is c.The change in hot dog consumption due to the income effect of the price change is:
A) H3 to H2.
B) H3 to H1.
C) H2 to H1.
D) H1 to H2.
Unlock Deck
Unlock for access to all 153 flashcards in this deck.
Unlock Deck
k this deck
56
Use the following to answer questions :
Javon is consuming his optimal utility-maximizing consumption bundle of lobster and macaroni-and-cheese dinners.Call this bundle A.His income is $100,the price of a macaroni-and-cheese dinner is $5,and the price of a lobster is $20.Put lobsters on the vertical axis and put macaroni-and-cheese dinners on the horizontal axis.His income increases to $500 and the prices of macaroni-and-cheese dinners and lobster remain constant.With the increase in income,Javon changes his consumption of the two goods and now maximizes utility at bundle B.If macaroni-and-cheese dinners are an inferior good for Javon:
A) at bundle B,Javon consumes more macaroni-and-cheese dinners.
B) at bundle B,Javon consumes less lobster.
C) at bundle A and bundle B,the marginal utility of lobster is 5.
D) at bundle B,Javon consumes more lobster.
Unlock Deck
Unlock for access to all 153 flashcards in this deck.
Unlock Deck
k this deck
57
Karen consumes gasoline and other goods.A new excise tax on gasoline raises the price.However,the government pays Karen an income subsidy that is just enough for her to stay on her original (pre-tax)indifference curve.Her new optimal consumption bundle will have:
A) the same amount of both goods as before.
B) less gas and more of other goods.
C) less of other goods and more gas.
D) This question can't be answered,since some essential information (such as Karen's income and the pre-tax and taxed prices of gas)is missing.
A) the same amount of both goods as before.
B) less gas and more of other goods.
C) less of other goods and more gas.
D) This question can't be answered,since some essential information (such as Karen's income and the pre-tax and taxed prices of gas)is missing.
Unlock Deck
Unlock for access to all 153 flashcards in this deck.
Unlock Deck
k this deck
58
Use the following to answer questions :
(Figure: Indifference Curves and Consumption Bundles)Use Figure Indifference Curves and Consumption Bundles.For this consumer,pizza is a(n)_____ good and hot dogs are a(n)_____ good.
A) normal;inferior
B) inferior;normal
C) normal;normal
D) inferior;inferior
(Figure: Indifference Curves and Consumption Bundles)Use Figure Indifference Curves and Consumption Bundles.For this consumer,pizza is a(n)_____ good and hot dogs are a(n)_____ good.
A) normal;inferior
B) inferior;normal
C) normal;normal
D) inferior;inferior
Unlock Deck
Unlock for access to all 153 flashcards in this deck.
Unlock Deck
k this deck
59
Use the following to answer questions :
(Figure: Indifference Curves and Consumption Bundles)Use Figure Indifference Curves and Consumption Bundles.The lines AA and BC are parallel.The optimal consumption point could shift from b to c as a result of any of the following EXCEPT:
A) an equal percentage increase in the prices of hot dogs and pizza while income is unchanged.
B) a decrease in income with prices constant.
C) a change in tastes.
D) an equal percentage increase in the prices of hot dogs and pizza while income is unchanged or a decrease in income with prices constant.
Unlock Deck
Unlock for access to all 153 flashcards in this deck.
Unlock Deck
k this deck
60
Use the following to answer questions :
Consumers buy both alcoholic and non-alcoholic beverages.If the government tries to discourage people from drinking alcoholic beverages by imposing an excise tax on them but gives consumers an income subsidy to keep the consumers on their original indifference curves:
A) the same amount of both goods will be consumed.
B) fewer alcoholic and more non-alcoholic beverages will be consumed.
C) more alcoholic and fewer non-alcoholic beverages will be consumed.
D) it is impossible to determine what will happen to the consumption of alcoholic and more non-alcoholic beverages.
Unlock Deck
Unlock for access to all 153 flashcards in this deck.
Unlock Deck
k this deck
61
Use the following to answer questions :
Figure: Harold's Indifference Curves
The figure shows three of Harold's indifference curves for bread and cheese.
(Figure: Harold's Indifference Curves)Use Figure Harold's Indifference Curves.If the price of cheese is $2 per kilogram and Harold has $10 to spend on bread and cheese,Harold _____ his consumption of cheese as the price of bread rises from $1 to $2 per loaf,indicating that bread and cheese are _____.
A) increases;substitutes
B) increases;complements
C) decreases;substitutes
D) decreases;complements
Unlock Deck
Unlock for access to all 153 flashcards in this deck.
Unlock Deck
k this deck
62
Use the following to answer questions :
(Figure: The Consumption of Video Games and E-Books)Use Figure The Consumption of Video Games and E-Books.Which chart shows the effect of a decrease in income when both video games and e-books are normal goods?
A) a
B) b
C) c
D) d
(Figure: The Consumption of Video Games and E-Books)Use Figure The Consumption of Video Games and E-Books.Which chart shows the effect of a decrease in income when both video games and e-books are normal goods?
A) a
B) b
C) c
D) d
Unlock Deck
Unlock for access to all 153 flashcards in this deck.
Unlock Deck
k this deck
63
Use the following to answer questions :
(Figure: The Consumption of Video Games and E-Books)Use Figure The Consumption of Video Games and E-Books.Which chart in the figure shows the effects of an increase in the price of video games when video games and e-books are complements but not perfect complements?
A) a
B) b
C) c
D) d
(Figure: The Consumption of Video Games and E-Books)Use Figure The Consumption of Video Games and E-Books.Which chart in the figure shows the effects of an increase in the price of video games when video games and e-books are complements but not perfect complements?
A) a
B) b
C) c
D) d
Unlock Deck
Unlock for access to all 153 flashcards in this deck.
Unlock Deck
k this deck
64
Use the following to answer questions :
Figure: Harold's Indifference Curves
The figure shows three of Harold's indifference curves for bread and cheese.
(Figure: Harold's Indifference Curves)Use Figure Harold's Indifference Curves.Given that the price of bread is $1 per loaf and the price of cheese is $2 per kilogram,as Harold's income increases from $10 to $14,we can determine that bread is a(n)_____ good and cheese is a(n)_____ good.
A) inferior;inferior
B) normal;inferior
C) inferior;normal
D) normal;normal
Unlock Deck
Unlock for access to all 153 flashcards in this deck.
Unlock Deck
k this deck
65
Use the following to answer questions :
Figure: The Optimal Consumption Bundle
(Figure: The Optimal Consumption Bundle)Use Figure The Optimal Consumption Bundle.Which of the following could lead to an optimal consumption bundle on indifference curve I3?
A) a decrease in income
B) a decrease in the price of restaurant meals
C) an increase in the price of rooms
D) an increase in the price of restaurant meals
Unlock Deck
Unlock for access to all 153 flashcards in this deck.
Unlock Deck
k this deck
66
Use the following to answer questions :
Figure: The Optimal Consumption Bundle
(Figure: The Optimal Consumption Bundle)Use Figure The Optimal Consumption Bundle.Which of the following could lead to an optimal consumption bundle on indifference curve I1?
A) an increase in income
B) a decrease in the price of restaurant meals
C) a decrease in the price of rooms
D) a decrease in income
Unlock Deck
Unlock for access to all 153 flashcards in this deck.
Unlock Deck
k this deck
67
Use the following to answer questions :
Figure: Harold's Indifference Curves
The figure shows three of Harold's indifference curves for bread and cheese.
(Figure: Harold's Indifference Curves)Use Figure Harold's Indifference Curves.If the price of bread is $1 per loaf,the price of cheese is $2 per kilogram,and Harold has $14 to spend on bread and cheese,Harold's optimal consumption bundle is _____ loaves of bread and _____ kilograms of cheese.
A) 6;4
B) 4;3
C) 3;2
D) 2;8
Unlock Deck
Unlock for access to all 153 flashcards in this deck.
Unlock Deck
k this deck
68
Use the following to answer questions :
Figure: The Optimal Consumption Bundle
(Figure: The Optimal Consumption Bundle)Use Figure The Optimal Consumption Bundle.Which of the following could lead to an optimal consumption bundle on indifference curve I3?
A) a decrease in income
B) an increase in the price of restaurant meals
C) a decrease in the price of rooms
D) an increase in the price of rooms
Unlock Deck
Unlock for access to all 153 flashcards in this deck.
Unlock Deck
k this deck
69
Use the following to answer questions :
Figure: The Optimal Consumption Bundle
(Figure: The Optimal Consumption Bundle)Use Figure The Optimal Consumption Bundle.If the price of restaurant meals _____,then the optimal consumption bundle will be on _____ indifference curve.
A) increases;a higher
B) decreases;a higher
C) decreases;a lower
D) increases;the same
Unlock Deck
Unlock for access to all 153 flashcards in this deck.
Unlock Deck
k this deck
70
Use the following to answer questions :
Figure: Harold's Indifference Curves
The figure shows three of Harold's indifference curves for bread and cheese.
(Figure: Harold's Indifference Curves)Use Figure Harold's Indifference Curves.The price of cheese is $2 per kilogram and Harold has $10 to spend on bread and cheese.As the price of bread rises from $1 to $2 per loaf,his consumption of bread:
A) increases from 2 to 3 loaves.
B) decreases from 3 to 2 loaves.
C) increases from 3 to 4 loaves.
D) decreases from 4 to 3 loaves.
Unlock Deck
Unlock for access to all 153 flashcards in this deck.
Unlock Deck
k this deck
71
Use the following to answer questions :
(Figure: Consumer Equilibrium II)Use Figure Consumer Equilibrium II.The HIGHEST level of total utility is associated with point _____ on indifference curve _____.
A) H;C
B) I;B
C) G;B
D) J;A
(Figure: Consumer Equilibrium II)Use Figure Consumer Equilibrium II.The HIGHEST level of total utility is associated with point _____ on indifference curve _____.
A) H;C
B) I;B
C) G;B
D) J;A
Unlock Deck
Unlock for access to all 153 flashcards in this deck.
Unlock Deck
k this deck
72
Use the following to answer questions :
Figure: The Optimal Consumption Bundle
(Figure: The Optimal Consumption Bundle)Use Figure The Optimal Consumption Bundle.Which of the following could lead to an optimal consumption bundle on indifference curve I3?
A) an increase in income
B) an increase in the price of restaurant meals
C) an increase in the price of rooms
D) a decrease in income
Unlock Deck
Unlock for access to all 153 flashcards in this deck.
Unlock Deck
k this deck
73
Use the following to answer questions :
(Figure: Consumer Equilibrium II)Use Figure Consumer Equilibrium II.The LOWEST level of total utility shown in the figure is associated with point _____ on curve _____.
A) H;A
B) I;B
C) G;C
D) J;A
(Figure: Consumer Equilibrium II)Use Figure Consumer Equilibrium II.The LOWEST level of total utility shown in the figure is associated with point _____ on curve _____.
A) H;A
B) I;B
C) G;C
D) J;A
Unlock Deck
Unlock for access to all 153 flashcards in this deck.
Unlock Deck
k this deck
74
Use the following to answer questions :
Figure: Harold's Indifference Curves
The figure shows three of Harold's indifference curves for bread and cheese.
(Figure: Harold's Indifference Curves)Use Figure Harold's Indifference Curves.If the price of bread is $0.50 per loaf,the price of cheese is $1 per kilogram,and Harold has $7 to spend on bread and cheese,Harold's optimal consumption bundle is _____ loaves of bread and _____ kilograms of cheese.
A) 6;4
B) 4;3
C) 3;2
D) 2;8
Unlock Deck
Unlock for access to all 153 flashcards in this deck.
Unlock Deck
k this deck
75
Use the following to answer questions :
Figure: Harold's Indifference Curves
The figure shows three of Harold's indifference curves for bread and cheese.
(Figure: Harold's Indifference Curves)Use Figure Harold's Indifference Curves.If the price of bread is $2 per loaf,the price of cheese is $2 per kilogram,and Harold has $10 to spend on bread and cheese,Harold's optimal consumption bundle is _____ loaves of bread and _____ kilograms of cheese.
A) 6;4
B) 4;3
C) 3;2
D) 2;8
Unlock Deck
Unlock for access to all 153 flashcards in this deck.
Unlock Deck
k this deck
76
Use the following to answer questions :
Figure: Harold's Indifference Curves
The figure shows three of Harold's indifference curves for bread and cheese.
(Figure: Harold's Indifference Curves)Use Figure Harold's Indifference Curves.If the price of bread is $2 per loaf,the price of cheese is $4 per kilogram,and Harold has $28 to spend on bread and cheese,Harold's optimal consumption bundle is _____ loaves of bread and _____ kilograms of cheese.
A) 6;4
B) 4;3
C) 3;2
D) 2;8
Unlock Deck
Unlock for access to all 153 flashcards in this deck.
Unlock Deck
k this deck
77
Use the following to answer questions :
Figure: The Optimal Consumption Bundle
(Figure: The Optimal Consumption Bundle)Use Figure The Optimal Consumption Bundle.Which of the following could lead to an optimal consumption bundle on indifference curve I1?
A) an increase in income
B) an increase in the price of restaurant meals
C) a decrease in the price of rooms
D) a decrease in the price of restaurant meals
Unlock Deck
Unlock for access to all 153 flashcards in this deck.
Unlock Deck
k this deck
78
Use the following to answer questions :
Figure: Harold's Indifference Curves
The figure shows three of Harold's indifference curves for bread and cheese.
(Figure: Harold's Indifference Curves)Use Figure Harold's Indifference Curves.If the price of bread is $1 per loaf,the price of cheese is $2 per kilogram,and Harold has $10 to spend on bread and cheese,Harold's optimal consumption bundle is _____ loaves of bread and _____ kilograms of cheese.
A) 6;4
B) 4;3
C) 3;2
D) 2;8
Unlock Deck
Unlock for access to all 153 flashcards in this deck.
Unlock Deck
k this deck
79
Use the following to answer questions :
(Figure: The Consumption of Video Games and E-Books)Use Figure The Consumption of Video Games and E-Books.Which chart shows the effects of an increase in the price of video games when video games and e-books are substitutes but not perfect substitutes?
A) a
B) b
C) c
D) d
(Figure: The Consumption of Video Games and E-Books)Use Figure The Consumption of Video Games and E-Books.Which chart shows the effects of an increase in the price of video games when video games and e-books are substitutes but not perfect substitutes?
A) a
B) b
C) c
D) d
Unlock Deck
Unlock for access to all 153 flashcards in this deck.
Unlock Deck
k this deck
80
Use the following to answer questions :
(Figure: The Consumption of Video Games and E-Books)Use Figure The Consumption of Video Games and E-Books.Which chart shows the effects of a decrease in income when video games are an inferior good and e-books are a normal good?
A) a
B) b
C) c
D) d
(Figure: The Consumption of Video Games and E-Books)Use Figure The Consumption of Video Games and E-Books.Which chart shows the effects of a decrease in income when video games are an inferior good and e-books are a normal good?
A) a
B) b
C) c
D) d
Unlock Deck
Unlock for access to all 153 flashcards in this deck.
Unlock Deck
k this deck
Unlock Deck
Unlock for access to all 153 flashcards in this deck.


