Deck 24: Inferences for Regression
Full screen (f)
Question
Question
Question
The index of exposure to radioactive waste and the cancer mortality rates (deaths per 100,000)were recorded for nine different geographic regions. Dependent variable is: Cancer Mortality Rate
R-squared = 85.8%
S = 14.00993 with 9 - 2 = 7 degrees of freedom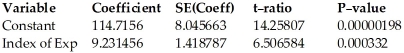
A)Cancer Mortality Rate = 114.7156 + 9.231456 × Index of Exp; The cancer mortality rates in these counties increase by about 9.231456 deaths per 100,000 for each 1 point increase in the index of exposure to radioactive waste.
B)Cancer Mortality Rate = 114.7156 + 9.231456 × Index of Exp; The cancer mortality rates in these counties increase by about 114.7156 deaths per 100,000 for each 1 point increase in the index of exposure to radioactive waste.
C)Cancer Mortality Rate = 114.7156 × Index of Exp + 9.231456; The cancer mortality rates in these counties increase by about 114.7156 deaths per 100,000 for each 1 point increase in the index of exposure to radioactive waste.
D)Cancer Mortality Rate = 114.7156 × Index of Exp + 9.231456; The cancer mortality rates in these counties increase by about 9.231456 deaths per 100,000 for each 1 point increase in the index of exposure to radioactive waste.
E)Index of Exp = 114.7156 + 9.231456 × Cancer Mortality Rate; The index of exposure to radioactive waste in these counties increases by about 9.231456 points for every 1 death per 100,000 increase in the cancer mortality rate.
Question
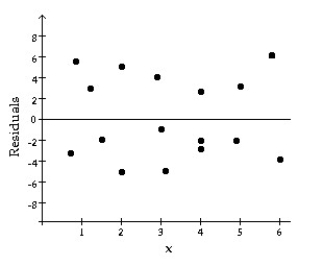
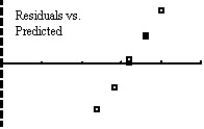
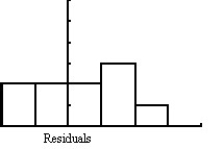
Decide whether or not the conditions and assumptions for regression inference are satisfied. Explain your answer.
Question
Determine which plot shows the strongest linear correlation.
A)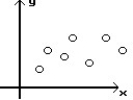
B)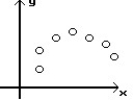
C)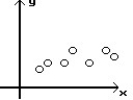
A)
B)
C)
Question
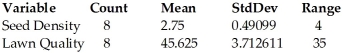
A grass seed company conducts a study to determine the relationship between the density of seeds planted (in pounds per 500 sq ft)and the quality of the resulting lawn.Eight similar plots of land are selected and each is planted with a particular density of seed.One month later the quality of each lawn is rated on a scale of 0 to 100.The regression analysis is given below. Dependent variable is: Lawn Quality
R-squared = 36.0%
S = 9.073602 with 8 - 2 = 6 degrees of freedom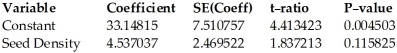
A)Lawn Quality = 33.14815 + 4.537037 × Seed Density; We estimate that the lawn quality of these plots increases about 4.537037 points for each 1 pound per 500 square foot increase in seed density.
B)Lawn Quality = 33.14815 × Seed Density + 4.537037; We estimate that the lawn quality of these plots increases about 4.537037 points for each 1 pound per 500 square foot increase in seed density.
C)Seed Density = 33.14815 + 4.537037 × Lawn Quality; We estimate that the seed density of these plots increases about 4.537037 pounds per 500 square feet for each 1 point increase in lawn quality.
D)Lawn Quality = 33.14815 × Seed Density + 4.537037; We estimate that the lawn quality of these plots increases about 33.14815 points for each 1 pound per 500 square foot increase in seed density.
E)Lawn Quality = 33.14815 + 4.537037 × Seed Density; We estimate that the lawn quality of these plots increases about 33.14815 points for each 1 pound per 500 square foot increase in seed density.
Question
A Regression Model
Decide whether or not the conditions and assumptions for regression inference are satisfied. Explain your answer.
Decide whether or not the conditions and assumptions for regression inference are satisfied. Explain your answer.
Question
Applicants for a particular job,which involves extensive travel in Spanish-speaking countries,must take a proficiency test in Spanish.The sample data below were obtained in a study of the relationship between the numbers of years applicants have studied Spanish and their score on the test.Use the regression analysis below to explain what the R-squared in this regression means.
Dependent variable is: Score
R-squared = 83.0%
s = 5.65138 with 10 - 2 = 8 degrees of freedom
Dependent variable is: Score
R-squared = 83.0%
s = 5.65138 with 10 - 2 = 8 degrees of freedom
Question
The index of exposure to radioactive waste and the cancer mortality rates (deaths per 100,000)were recorded for nine different geographic regions.Explain what the R-squared in this regression means.
Dependent variable is: Cancer Mortality Rate
R-squared = 85.8%
s = 14.00993 with 9 - 2 = 7 degrees of freedom
Dependent variable is: Cancer Mortality Rate
R-squared = 85.8%
s = 14.00993 with 9 - 2 = 7 degrees of freedom
Question
Decide whether or not the conditions and assumptions for regression inference are satisfied. Explain your answer.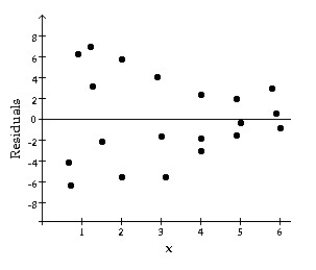
Question
Determine which plot shows the strongest linear correlation.
A)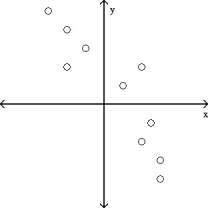
B)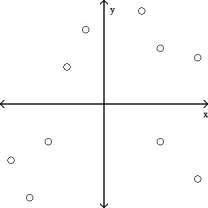
C)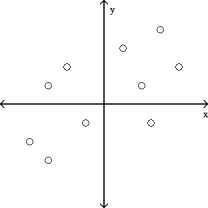
A)
B)
C)
Question
Question
Applicants for a particular job,which involves extensive travel in Spanish-speaking countries,must take a proficiency test in Spanish.The sample data below were obtained in a study of the relationship between the numbers of years applicants have studied Spanish and their score on the test. 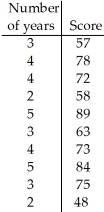 Using a 1% level of significance,do the data provide sufficient evidence to conclude that the slope of the regression line is not 0 and hence that number of years of study is useful as a predictor of score on the test?
Using a 1% level of significance,do the data provide sufficient evidence to conclude that the slope of the regression line is not 0 and hence that number of years of study is useful as a predictor of score on the test? Question
Ten students in a graduate program at the University of Toronto were randomly selected.Their grade point averages (GPAs)when they entered the program were between 3.5 and 4.0.The data consist of the students' GPAs on entering the program and their current GPAs.Several graphs are shown below. 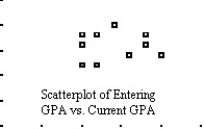
Question
Question
Applicants for a particular job,which involves extensive travel in Spanish-speaking countries,must take a proficiency test in Spanish.The sample data were obtained in a study of the relationship between the numbers of years applicants have studied Spanish and their score on the test.
Dependent variable is: Score
R-squared = 83.0%
S = 5.65138 with 10 - 2 = 8 degrees of freedom
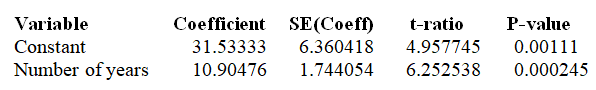
A)Score = 31.53333 × Number of Years + 10.90476; We estimate that the scores on the proficiency test for these applicants increase about 10.90476 points for each additional year spent studying Spanish.
B)Score = 31.53333 + 10.90476 × Number of Years; We estimate that the scores on the proficiency test for these applicants increase about 31.53333 points for each additional year spent studying Spanish.
C)Score = 31.53333 + 10.90476 × Number of Years; We estimate that the scores on the proficiency test for these applicants increase about 10.90476 points for each additional year spent studying Spanish.
D)Number of Years = 31.53333 + 10.90476 × Score; We estimate that the number of years spent studying Spanish increases about 10.90476 years for each additional point scored on the test.
E)Score = 31.53333 × Number of Years + 10.90476; We estimate that the scores on the proficiency test for these applicants increase about 31.53333 points for each additional year spent studying Spanish.
Dependent variable is: Score
R-squared = 83.0%
S = 5.65138 with 10 - 2 = 8 degrees of freedom
A)Score = 31.53333 × Number of Years + 10.90476; We estimate that the scores on the proficiency test for these applicants increase about 10.90476 points for each additional year spent studying Spanish.
B)Score = 31.53333 + 10.90476 × Number of Years; We estimate that the scores on the proficiency test for these applicants increase about 31.53333 points for each additional year spent studying Spanish.
C)Score = 31.53333 + 10.90476 × Number of Years; We estimate that the scores on the proficiency test for these applicants increase about 10.90476 points for each additional year spent studying Spanish.
D)Number of Years = 31.53333 + 10.90476 × Score; We estimate that the number of years spent studying Spanish increases about 10.90476 years for each additional point scored on the test.
E)Score = 31.53333 × Number of Years + 10.90476; We estimate that the scores on the proficiency test for these applicants increase about 31.53333 points for each additional year spent studying Spanish.
Question
Ten students in a graduate program at the University of Toronto were randomly selected.Their grade point averages (GPAs)when they entered the program were between 3.5 and 4.0.The students' GPAs on entering the program and their current GPAs were recorded. Dependent variable is: Current GPA
R-squared = 0.677968
S =0.024768 with 10 - 2 = 8 degrees of freedom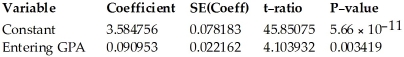
A)Entering GPA = 3.584756 + 0.090953 × Current GPA; We estimate that the entering GPA for these students increases by 0.090953 points for each 1 point increase in their current GPA.
B)Current GPA = 3.584756 + 0.090953 × Entering GPA; We estimate that the current GPA for these students increases by 3.584756 points for each 1 point increase in their entering GPA.
C)Current GPA = 3.584756 × Entering GPA + 0.090953; We estimate that the current GPA for these students increases by 3.584756 points for each 1 point increase in their entering GPA.
D)Current GPA = 3.584756 + 0.090953 × Entering GPA; We estimate that the current GPA for these students increases by 0.090953 points for each 1 point increase in their entering GPA.
E)Current GPA = 3.584756 × Entering GPA + 0.090953; We estimate that the current GPA for these students increases by 0.090953 points for each 1 point increase in their entering GPA.
Question
Question
The reading speeds (in tens of words per minute)and typing speeds (in words per minute)of nine randomly selected secretaries were recorded. Dependent variable is: Reading speed
R-squared = 97.9521%
S = 2.094847 with 9 - 2 = 7 degrees of freedom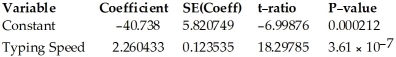
A)Reading speed = -40.738 + 2.260433 × Typing speed; We estimate that the reading speeds for these secretaries increase about 2.260433 words per minute for each 10 word per minute increase in their typing speed.
B)Typing speed = -40.738 × Reading speed + 2.260433; We estimate that the typing speeds for these secretaries increase about 2.260433 words per minute for each 10 word per minute increase in their reading speed.
C)Reading speed = -40.738 + 2.260433 × Typing speed; We estimate that the reading speeds for these secretaries increase about 22.60433 words per minute for each 1 word per minute increase in their typing speed.
D)Typing speed = -40.738 + 2.260433 × Reading speed; We estimate that the typing speeds for these secretaries decrease about 40.738 words per minute for each 10 word per minute increase in their reading speed.
E)Typing speed = -40.738 × Reading speed + 2.260433; We estimate that the typing speeds for these secretaries decrease about 40.738 words per minute for each 10 word per minute increase in their reading speed.
Question
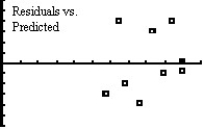
Ten students from a large lecture course were randomly sampled to see how many hours they studied for the final exam and their grade on the final exam.The professor wants to conduct a linear regression to determine if there is an association between the amount of time spent studying and the student's grade on the exam.Several plots are shown below. 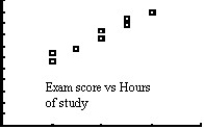
Question
The sample data below are the typing speeds (in words per minute)and reading speeds (in words per minute)of nine randomly selected secretaries. 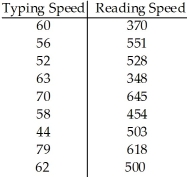 Using a 10% level of significance,do the data provide sufficient evidence of an association between typing speed and reading speed?
Using a 10% level of significance,do the data provide sufficient evidence of an association between typing speed and reading speed? Question
The index of exposure to radioactive waste and the cancer mortality rates (deaths per 100,000)were recorded for nine different geographic regions.A 99% confidence interval for the slope of the regression line was determined to be (4.27,14.20).Give an interpretation of this interval. Dependent variable is: Cancer Mortality Rate
R-squared = 85.8%
S = 14.00993 with 9 - 2 = 7 degrees of freedom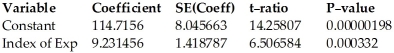
A)Based on this regression,we are 99% confident that the mean cancer mortality rate is between 4.27 and 14.20 deaths per 100,000.
B)We can be 99% confident that with each unit increase in the index of exposure,the decrease in mean cancer mortality rate is between 4.27 and 14.20 deaths per 100,000.
C)We can be 99% confident that with each unit increase in the index of exposure,the increase in mean cancer mortality rate is between 4.27 and 14.20 deaths per 100,000.
D)Based on this regression,we are 99% confident that the mean cancer mortality rate is increasing between 4.27 and 14.20 deaths per 100,000 per year.
E)We are 99% confident that with each unit increase in the cancer mortality rate,the increase in the mean index of exposure is between 4.27 and 14.20 deaths per 100,000.
Question
A grass seed company conducts a study to determine the relationship between the density of seeds planted (in pounds per 500 sq ft)and the quality of the resulting lawn.Eight similar plots of land are selected and each is planted with a particular density of seed.One month later the quality of each lawn is rated on a scale of 0 to 100.The sample data are given below. 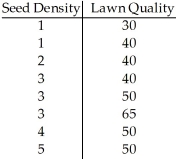 Using a 10% level of significance,is there evidence of an association between seed density and lawn quality?
Using a 10% level of significance,is there evidence of an association between seed density and lawn quality? Question
The typing speeds (in words per minute)and reading speeds (in words per minute)of nine randomly selected secretaries were recorded.Use the regression analysis and summary statistics provided below to determine a 90% prediction interval for the reading speed of a secretary whose typing speed is 50. 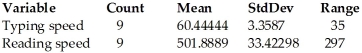 Dependent variable is: Reading speed R-squared = 12.385%
S = 100.3348 with 9 - 2 = 7 degrees of freedom
A)371.1 to 559.5 words per minute
B)253.1 to 677.5 words per minute
C)405.9 to 450.9 words per minute
D)257.1 to 673.6 words per minute
E)458.6 to 472.0 words per minute
Dependent variable is: Reading speed R-squared = 12.385%S = 100.3348 with 9 - 2 = 7 degrees of freedom
A)371.1 to 559.5 words per minute
B)253.1 to 677.5 words per minute
C)405.9 to 450.9 words per minute
D)257.1 to 673.6 words per minute
E)458.6 to 472.0 words per minute
Question
Applicants for a particular job,which involves extensive travel in Spanish-speaking countries,must take a proficiency test in Spanish.The sample data below were obtained in a study of the relationship between the numbers of years applicants have studied Spanish and their score on the test.Using a 1% level of significance,do the data provide sufficient evidence to conclude that the slope of the regression line is not 0 and hence that number of years of study is useful as a predictor of score on the test? The regression analysis is given below.
Dependent variable is: Score
R-squared = 83.0%
s = 5.65138 with 10 - 2 = 8 degrees of freedom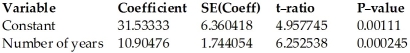
Dependent variable is: Score
R-squared = 83.0%
s = 5.65138 with 10 - 2 = 8 degrees of freedom
Question
Ten students in a graduate program at the University of Toronto were randomly selected.Their grade point averages (GPAs)when they entered the program were between 3.5 and 4.0.The following data consist of the students' GPAs on entering the program and their current GPAs. 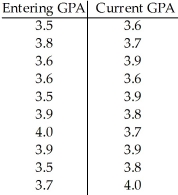 Using a 10% level of significance,do the data below provide evidence of the conclusion that higher entering GPAs are associated with higher current GPAs?
Using a 10% level of significance,do the data below provide evidence of the conclusion that higher entering GPAs are associated with higher current GPAs? Question
The typing speeds (in words per minute)and reading speeds (in words per minute)of nine randomly selected secretaries were recorded.Using a 10% level of significance,use the regression analysis provided below to determine if there is sufficient evidence of an association between typing speed and reading speed.
Dependent variable is: Reading speed
R-squared = 12.385%
s = 100.3348 with 9 - 2 = 7 degrees of freedom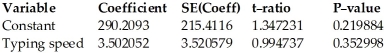
Dependent variable is: Reading speed
R-squared = 12.385%
s = 100.3348 with 9 - 2 = 7 degrees of freedom
Question
Ten students in a graduate program at the University of Toronto were randomly selected.Their grade point averages (GPAs)when they entered the program were between 3.5 and 4.0.The students' GPAs on entering the program and their current GPAs were recorded.Use the regression analysis provided below to find a 95% confidence interval for the slope of the regression line. Dependent variable is: Current GPA
R-squared = 0.001849
S = 0.1452 with 10 - 2 = 8 degrees of freedom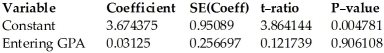
A)(-0.45,0.51)
B)(-0.83,0.89)
C)(-0.56,0.62)
D)(1.48,5.87)
E)(-0.44,0.50)
R-squared = 0.001849
S = 0.1452 with 10 - 2 = 8 degrees of freedom
A)(-0.45,0.51)
B)(-0.83,0.89)
C)(-0.56,0.62)
D)(1.48,5.87)
E)(-0.44,0.50)
Question
Applicants for a particular job,which involves extensive travel in Spanish-speaking countries,must take a proficiency test in Spanish.The sample data were obtained in a study of the relationship between the numbers of years applicants have studied Spanish and their score on the test.Use the regression analysis and summary statistics given below to find a 95% prediction interval for the score of an applicant who has studied Spanish for 2.2 years.  Dependent variable is: Score R-squared = 83.0%
S = 5.65138 with 10 - 2 = 8 degrees of freedom
A)43.7 to 67.3
B)40.9 to 70.2
C)43.1 to 70.9
D)51.5 to 59.5
E)48.9 to 62.2
Dependent variable is: Score R-squared = 83.0%S = 5.65138 with 10 - 2 = 8 degrees of freedom
A)43.7 to 67.3
B)40.9 to 70.2
C)43.1 to 70.9
D)51.5 to 59.5
E)48.9 to 62.2
Question
A grass seed company conducts a study to determine the relationship between the density of seeds planted (in pounds per 500 sq ft)and the quality of the resulting lawn.Eight similar plots of land are selected and each is planted with a particular density of seed.One month later the quality of each lawn is rated on a scale of 0 to 100.The regression analysis is given below.A 95% confidence interval for the slope of the regression line was determined to be (-1.51,10.58).Give an interpretation of this interval. Dependent variable is: Lawn Quality
R-squared = 36.0%
S = 9.073602 with 8 - 2 = 6 degrees of freedom
A)Based on this regression,each additional pound of seed per 500 square feet the average lawn quality will decrease by up to 1.51 or increase by up to 10.58 points,with 95% confidence.
B)We are 95% confident that a randomly selected plot will have a lawn quality between -1.51 and 10.58 points.
C)We are 95% confident that each additional point on the lawn quality scale will increase the average seed density by -1.51 to 10.58 pounds per 500 square feet.
D)Based on this regression,we are 95% confidence that the average lawn quality is between -1.51 and 10.58 points.
E)We are 95% confident that the average lawn quality will decrease by up to 1.51 or increase by up to 10.58 points per year.
Question
Applicants for a particular job,which involves extensive travel in Spanish-speaking countries,must take a proficiency test in Spanish.The sample data were obtained in a study of the relationship between the numbers of years applicants have studied Spanish and their score on the test.A 99% confidence interval for the slope of the regression line was determined to be (5.05,16.76).Give an interpretation of this interval. Dependent variable is: Score
R-squared = 83.0%
S = 5.65138 with 10 - 2 = 8 degrees of freedom
A)Based on these data,we are 99% confident that the mean test score is between 5.05 and 16.76 points.
B)Based on these data,we are 99% confident that a randomly selected applicant will score between 5.05 and 16.76 points on the test.
C)Based on these data,we are 99% confident that the average test score decreases between 5.05 and 16.76 points for every additional year spent studying Spanish.
D)Based on these data,we are 99% confident that the average test score increases between 5.05 and 16.76 points for every additional year spent studying Spanish.
E)Based on these data,we are 99% confident that the number of years spent studying Spanish increases between 5.05 and 16.76 years for every additional point earned on the test.
Question
The index of exposure to radioactive waste and the cancer mortality rates (deaths per 100,000)were recorded for nine different geographic regions.Use the regression analysis provided below to find a 99% confidence interval for the slope of the regression line. Dependent variable is: Cancer Mortality Rate
R-squared = 85.8%
S = 14.00993 with 9 - 2 = 7 degrees of freedom
A)(5.88,12.59)
B)(4.46,14.00)
C)(4.97,13.49)
D)(4.27,14.20)
E)(5.11,13.35)
R-squared = 85.8%
S = 14.00993 with 9 - 2 = 7 degrees of freedom
A)(5.88,12.59)
B)(4.46,14.00)
C)(4.97,13.49)
D)(4.27,14.20)
E)(5.11,13.35)
Question
The typing speeds (in words per minute)and reading speeds (in words per minute)of nine randomly selected secretaries were recorded.Use the regression analysis provided below to find a 90% confidence interval for the slope of the regression line. Dependent variable is: Reading speed
R-squared = 12.385%
S = 100.3348 with 9 - 2 = 7 degrees of freedom
A)(-3.05,10.05)
B)(-1.48,8.48)
C)(-1.42,8.42)
D)(-3.17,10.17)
E)(-4.82,11.83)
R-squared = 12.385%
S = 100.3348 with 9 - 2 = 7 degrees of freedom
A)(-3.05,10.05)
B)(-1.48,8.48)
C)(-1.42,8.42)
D)(-3.17,10.17)
E)(-4.82,11.83)
Question
The sample data below are the index of exposure to radioactive waste for nine different geographic regions and cancer mortality rates (deaths per 100,000). 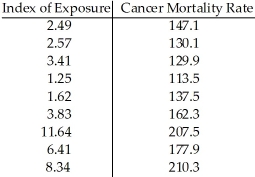 Using a 1% level of significance,do the data below support the claim that a higher index of exposure is associated with a higher cancer mortality rate?
Using a 1% level of significance,do the data below support the claim that a higher index of exposure is associated with a higher cancer mortality rate? Question
Applicants for a particular job,which involves extensive travel in Spanish-speaking countries,must take a proficiency test in Spanish.The sample data were obtained in a study of the relationship between the numbers of years applicants have studied Spanish and their score on the test.Use the regression analysis given below to find a 99% confidence interval for the slope of the regression line. Dependent variable is: Score
R-squared = 83.0%
S = 5.65138 with 10 - 2 = 8 degrees of freedom
A)(5.23,16.57)
B)(5.05,16.76)
C)(9.16,12.65)
D)(6.88,14.93)
E)(25.70,37.40)
R-squared = 83.0%
S = 5.65138 with 10 - 2 = 8 degrees of freedom
A)(5.23,16.57)
B)(5.05,16.76)
C)(9.16,12.65)
D)(6.88,14.93)
E)(25.70,37.40)
Question
The index of exposure to radioactive waste and the cancer mortality rates (deaths per 100,000)were recorded for nine different geographic regions.Using a 1% level of significance,use the regression analysis provided below to perform the hypothesis test to determine if the index of exposure is useful as a predictor or cancer mortality rate.
Dependent variable is: Cancer Mortality Rate
R-squared = 85.8%
s = 14.00993 with 9 - 2 = 7 degrees of freedom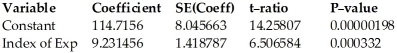
Dependent variable is: Cancer Mortality Rate
R-squared = 85.8%
s = 14.00993 with 9 - 2 = 7 degrees of freedom
Question
A grass seed company conducts a study to determine the relationship between the density of seeds planted (in pounds per 500 sq ft)and the quality of the resulting lawn.Eight similar plots of land are selected and each is planted with a particular density of seed.One month later the quality of each lawn is rated on a scale of 0 to 100.The regression analysis and summary statistics are given below.Determine a 99% prediction interval for the lawn quality of a lawn sown with a seed density of 1.3.  Dependent variable is: Lawn Quality R-squared = 36.0%
S = 9.073602 with 8 - 2 = 6 degrees of freedom
A)1.0 to 77.1
B)3.1 to 75.0
C)21.2 to 56.9
D)29.9 to 48.2
E)30.4 to 73.4
Dependent variable is: Lawn Quality R-squared = 36.0%S = 9.073602 with 8 - 2 = 6 degrees of freedom
A)1.0 to 77.1
B)3.1 to 75.0
C)21.2 to 56.9
D)29.9 to 48.2
E)30.4 to 73.4
Question
Ten students in a graduate program were randomly selected.Their grade point averages (GPAs)when they entered the program were between 3.5 and 4.0.The students' GPAs on entering the program and their current GPAs were recorded.Using a 10% level of significance,do the data below provide evidence of the conclusion that higher entering GPAs are associated with higher current GPA?
Dependent variable is: Current GPA
R-squared = 0.001849
s = 0.1452 with 10 - 2 = 8 degrees of freedom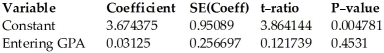
Dependent variable is: Current GPA
R-squared = 0.001849
s = 0.1452 with 10 - 2 = 8 degrees of freedom
Question
A grass seed company conducts a study to determine the relationship between the density of seeds planted (in pounds per 500 sq ft)and the quality of the resulting lawn.Eight similar plots of land are selected and each is planted with a particular density of seed.One month later the quality of each lawn is rated on a scale of 0 to 100.The regression analysis is given below.Find a 95% confidence interval for the slope of the regression line. Dependent variable is: Lawn Quality
R-squared = 36.0%
S = 9.073602 with 8 - 2 = 6 degrees of freedom
A)(-0.26,9.34)
B)(-1.51,10.58)
C)(14.77,51.53)
D)(27.10,39.18)
E)(-1.30,10.38)
R-squared = 36.0%
S = 9.073602 with 8 - 2 = 6 degrees of freedom
A)(-0.26,9.34)
B)(-1.51,10.58)
C)(14.77,51.53)
D)(27.10,39.18)
E)(-1.30,10.38)
Question
A grass seed company conducts a study to determine the relationship between the density of seeds planted (in pounds per 500 sq ft)and the quality of the resulting lawn.Eight similar plots of land are selected and each is planted with a particular density of seed.One month later the quality of each lawn is rated on a scale of 0 to 100.The regression analysis is given below.Using a 10% level of significance,is there evidence of an association between seed density and lawn quality?
Dependent variable is: Lawn Quality
R-squared = 36.0%
s = 9.073602 with 8 - 2 = 6 degrees of freedom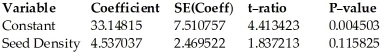
Dependent variable is: Lawn Quality
R-squared = 36.0%
s = 9.073602 with 8 - 2 = 6 degrees of freedom
Question
Question
Consider a logistic regression model for the probability of a "success",given a quantitative variable X.  Use the output above to estimate the odds in favour of a success when X = 25.
A)0.1824
B)0.8176
C)0.2019
D)0.7981
E)0.2231
Use the output above to estimate the odds in favour of a success when X = 25.A)0.1824
B)0.8176
C)0.2019
D)0.7981
E)0.2231
Question
A grass seed company conducts a study to determine the relationship between the density of seeds planted (in pounds per 500 sq ft)and the quality of the resulting lawn.Eight similar plots of land are selected and each is planted with a particular density of seed.One month later the quality of each lawn is rated on a scale of 0 to 100.The regression analysis and summary statistics are given below.A 99% confidence interval for the mean lawn quality of all lawns sown with a seed density of 2.9 was found to be (32.3,56.3).Give an interpretation of this interval. 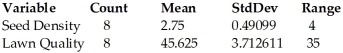 Dependent variable is: Lawn Quality R-squared = 36.0%
S = 9.073602 with 8 - 2 = 6 degrees of freedom
A)Based on this regression,we are 99% confident that the average lawn quality for lawns with a seed density of 2.9 pounds per 500 square feet is between 32.3 and 56.3.
B)Based on this regression,99% of all random samples will have an average lawn quality between 32.3 and 56.3.
C)Based on this regression,we are 99% confident that the average seed density will increase between 32.3 and 56.3 pounds per 500 square feet for each additional one-point increase in lawn quality.
D)Based on this regression,we are 99% confident that the average lawn quality will increase between 32.3 and 56.3 points for each additional pound of seed per 500 square feet.
E)Based on this regression,we are 99% confident that the lawn quality for a lawn with a seed density of 2.9 is between 32.3 and 56.3.
Dependent variable is: Lawn Quality R-squared = 36.0%S = 9.073602 with 8 - 2 = 6 degrees of freedom
A)Based on this regression,we are 99% confident that the average lawn quality for lawns with a seed density of 2.9 pounds per 500 square feet is between 32.3 and 56.3.
B)Based on this regression,99% of all random samples will have an average lawn quality between 32.3 and 56.3.
C)Based on this regression,we are 99% confident that the average seed density will increase between 32.3 and 56.3 pounds per 500 square feet for each additional one-point increase in lawn quality.
D)Based on this regression,we are 99% confident that the average lawn quality will increase between 32.3 and 56.3 points for each additional pound of seed per 500 square feet.
E)Based on this regression,we are 99% confident that the lawn quality for a lawn with a seed density of 2.9 is between 32.3 and 56.3.
Question
A grass seed company conducts a study to determine the relationship between the density of seeds planted (in pounds per 500 sq ft)and the quality of the resulting lawn.Eight similar plots of land are selected and each is planted with a particular density of seed.One month later the quality of each lawn is rated on a scale of 0 to 100.The regression analysis and summary statistics are given below.A 99% prediction interval for the lawn quality of a lawn sown with a seed density of 2.9 was determined to be  .
.  Dependent variable is: Lawn Quality R-squared = 36.0%
S = 9.073602 with 8 - 2 = 6 degrees of freedom
A)Based on this regression,we are 99% confident that the mean seed density will increase between 10.6 and 82.0 for each additional point of lawn quality over 2.9 pounds.
B)Based on this regression,we are 99% confident that the mean lawn quality will increase between 10.6 and 82.0 for each additional pound of seed density over 2.9 pounds.
C)Based on this regression,we are 99% confident that a lawn with a seed density of 2.9 pounds per 500 square feet will have a lawn quality between 10.6 and 82.0.
D)Based on this regression,we are 99% confident that the mean lawn quality for lawns with a seed density of 2.9 pounds per 500 square feet will be between 10.6 and 82.0.
E)Based on this regression,we know that 99% of all random samples will have a lawn quality between 10.6 and 82.0.
. Dependent variable is: Lawn Quality R-squared = 36.0%S = 9.073602 with 8 - 2 = 6 degrees of freedom
A)Based on this regression,we are 99% confident that the mean seed density will increase between 10.6 and 82.0 for each additional point of lawn quality over 2.9 pounds.
B)Based on this regression,we are 99% confident that the mean lawn quality will increase between 10.6 and 82.0 for each additional pound of seed density over 2.9 pounds.
C)Based on this regression,we are 99% confident that a lawn with a seed density of 2.9 pounds per 500 square feet will have a lawn quality between 10.6 and 82.0.
D)Based on this regression,we are 99% confident that the mean lawn quality for lawns with a seed density of 2.9 pounds per 500 square feet will be between 10.6 and 82.0.
E)Based on this regression,we know that 99% of all random samples will have a lawn quality between 10.6 and 82.0.
Question
Applicants for a particular job,which involves extensive travel in Spanish-speaking countries,must take a proficiency test in Spanish.The sample data were obtained in a study of the relationship between the numbers of years applicants have studied Spanish and their score on the test.Use the regression analysis and summary statistics given below to find a 95% confidence interval for the average score of an applicant who has studied Spanish for 2.2 years. 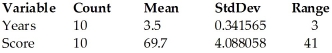 Dependent variable is: Score R-squared = 83.0%
S = 5.65138 with 10 - 2 = 8 degrees of freedom
A)51.5 to 59.5
B)43.1 to 70.9
C)43.7 to 67.3
D)48.9 to 62.2
E)40.9 to 70.2
Dependent variable is: Score R-squared = 83.0%S = 5.65138 with 10 - 2 = 8 degrees of freedom
A)51.5 to 59.5
B)43.1 to 70.9
C)43.7 to 67.3
D)48.9 to 62.2
E)40.9 to 70.2
Question
Applicants for a particular job,which involves extensive travel in Spanish-speaking countries,must take a proficiency test in Spanish.The sample data below were obtained in a study of the relationship between the numbers of years applicants have studied Spanish and their score on the test.A 95% prediction interval for the score of an applicant who has studied Spanish for 2.6 years was determined to be (45.7,74.0).  Dependent variable is: Score R-squared = 83.0%
S = 5.65138 with 10 - 2 = 8 degrees of freedom
A)Based on this regression,we are 95% confident that the mean test score for applicants who have studied Spanish for 2.6 years will be between 45.7 and 74.0.
B)Based on this regression,we are 95% confident that the mean number of years spent studying Spanish will increase between 45.7 and 74.0 years for each additional point earned on the test.
C)Based on this regression,we are 95% confident that the mean test score will increase between 45.7 and 74.0 points for each additional year spent studying Spanish.
D)Based on this regression,an applicant who has studied Spanish for 2.6 years will score between 45.7 and 74.0 on the proficiency test,with 95% confidence.
E)Based on this regression,we know that 95% of all random samples will have a mean test score between 45.7 and 74.0 points.
Dependent variable is: Score R-squared = 83.0%S = 5.65138 with 10 - 2 = 8 degrees of freedom
A)Based on this regression,we are 95% confident that the mean test score for applicants who have studied Spanish for 2.6 years will be between 45.7 and 74.0.
B)Based on this regression,we are 95% confident that the mean number of years spent studying Spanish will increase between 45.7 and 74.0 years for each additional point earned on the test.
C)Based on this regression,we are 95% confident that the mean test score will increase between 45.7 and 74.0 points for each additional year spent studying Spanish.
D)Based on this regression,an applicant who has studied Spanish for 2.6 years will score between 45.7 and 74.0 on the proficiency test,with 95% confidence.
E)Based on this regression,we know that 95% of all random samples will have a mean test score between 45.7 and 74.0 points.
Question
The index of exposure to radioactive waste and the cancer mortality rates (deaths per 100,000)were recorded for nine different geographic regions.Use the regression analysis and summary statistics provided below to determine a 95% prediction interval for the cancer mortality rate of a county whose index of exposure is 5.93.  Dependent variable is: Cancer Mortality Rate R-squared = 85.8%
S = 14.00993 with 9 - 2 = 7 degrees of freedom
A)134.2 to 204.7 deaths per 100,000
B)135.7 to 203.2 deaths per 100,000
C)166.1 to 172.8 deaths per 100,000
D)167.9 to 185.9 deaths per 100,000
E)157.5 to 181.4 deaths per 100,000
Dependent variable is: Cancer Mortality Rate R-squared = 85.8%S = 14.00993 with 9 - 2 = 7 degrees of freedom
A)134.2 to 204.7 deaths per 100,000
B)135.7 to 203.2 deaths per 100,000
C)166.1 to 172.8 deaths per 100,000
D)167.9 to 185.9 deaths per 100,000
E)157.5 to 181.4 deaths per 100,000
Question
The index of exposure to radioactive waste and the cancer mortality rates (deaths per 100,000)were recorded for nine different geographic regions.Use the regression analysis and summary statistics provided below to determine a 95% confidence interval for the average cancer mortality rate of a county whose index of exposure is 6.81 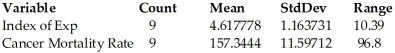 Dependent variable is: Cancer Mortality Rate R-squared = 85.8%
S = 14.00993 with 9 - 2 = 7 degrees of freedom
A)164.3 to 190.9 deaths per 100,000
B)143.4 to 211.8 deaths per 100,000
C)174.2 to 180.9 deaths per 100,000
D)167.9 to 185.9 deaths per 100,000
E)141.8 to 213.3 deaths per 100,000
Dependent variable is: Cancer Mortality Rate R-squared = 85.8%S = 14.00993 with 9 - 2 = 7 degrees of freedom
A)164.3 to 190.9 deaths per 100,000
B)143.4 to 211.8 deaths per 100,000
C)174.2 to 180.9 deaths per 100,000
D)167.9 to 185.9 deaths per 100,000
E)141.8 to 213.3 deaths per 100,000
Question
Consider a logistic regression model for the probability of a "success",given a quantitative variable X.  Use the output above to estimate the probability of a success when X = 25.
A)0.1824
B)0.8176
C)0.2019
D)0.7981
E)0.2231
Use the output above to estimate the probability of a success when X = 25.A)0.1824
B)0.8176
C)0.2019
D)0.7981
E)0.2231
Question
The index of exposure to radioactive waste and the cancer mortality rates (deaths per 100,000)were recorded for nine different geographic regions.A 95% prediction interval for the cancer mortality rate of a region whose index of exposure is 5.79 is 133.0 to 203.4 deaths per 100,000.  Dependent variable is: Cancer Mortality Rate R-squared = 85.8%
S = 14.00993 with 9 - 2 = 7 degrees of freedom
A)Based on this regression,we are 95% confident that the index of exposure will increase between 133.0 and 203.4 for each unit increase in the cancer mortality rate over 5.79.
B)Based on this regression,we know that 95% of all random samples of regions will have a mean cancer mortality rate that is between 133.0 and 203.4 deaths per 100,000.
C)Based on this regression,we are 95% confident that a region with an index of exposure of 5.79 will have a cancer mortality rate that is between 133.0 and 203.4 deaths per 100,000.
D)Based on this regression,we are 95% confident that the mean cancer mortality rate will increase between 133.0 and 203.4 deaths per 100,000 for each unit increase in the index of exposure over 5.79.
E)Based on this regression,we are 95% confident that the mean cancer mortality rate for regions with an index of exposure of 5.79 will be between 133.0 and 203.4 deaths per 100,000.
Dependent variable is: Cancer Mortality Rate R-squared = 85.8%S = 14.00993 with 9 - 2 = 7 degrees of freedom
A)Based on this regression,we are 95% confident that the index of exposure will increase between 133.0 and 203.4 for each unit increase in the cancer mortality rate over 5.79.
B)Based on this regression,we know that 95% of all random samples of regions will have a mean cancer mortality rate that is between 133.0 and 203.4 deaths per 100,000.
C)Based on this regression,we are 95% confident that a region with an index of exposure of 5.79 will have a cancer mortality rate that is between 133.0 and 203.4 deaths per 100,000.
D)Based on this regression,we are 95% confident that the mean cancer mortality rate will increase between 133.0 and 203.4 deaths per 100,000 for each unit increase in the index of exposure over 5.79.
E)Based on this regression,we are 95% confident that the mean cancer mortality rate for regions with an index of exposure of 5.79 will be between 133.0 and 203.4 deaths per 100,000.
Question
Consider a logistic regression model for the probability of a "success",given a quantitative variable X. 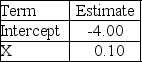 Use the output above to estimate the probability of a success when X = 10.
A)0.0474
B)0.9526
C)0.0497
D)0.3333
E)0.9503
Use the output above to estimate the probability of a success when X = 10.A)0.0474
B)0.9526
C)0.0497
D)0.3333
E)0.9503
Question
The index of exposure to radioactive waste and the cancer mortality rates (deaths per 100,000)were recorded for nine different geographic regions.A 95% confidence interval for the mean cancer mortality rate of all regions whose index of exposure is 6.57 was determined to be (162.5,188.2).  Dependent variable is: Cancer Mortality Rate R-squared = 85.8%
S = 14.00993 with 9 - 2 = 7 degrees of freedom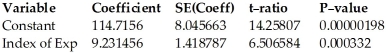
A)Based on this regression,we are 95% confident that the mean index of exposure will increase between 162.5 and 188.2 points for each one-unit increase in the cancer mortality rate.
B)Based on this regression,95% of all random samples will have a mean cancer mortality rate between 162.5 and 188.2 deaths per 100,000.
C)With 95% confidence,the cancer mortality rate for a region with an index of exposure of 6.57 is between 162.5 and 188.2 deaths per 100,000,based on this regression.
D)Based on this regression,we are 95% confident that the mean cancer mortality rate will increase between 162.5 and 188.2 deaths per 100,000 for each one-unit increase in the index of exposure.
E)With 95% confidence,the mean cancer mortality rate for regions with an index of exposure of 6.57 is between 162.5 and 188.2 deaths per 100,000,based on this regression.
Dependent variable is: Cancer Mortality Rate R-squared = 85.8%S = 14.00993 with 9 - 2 = 7 degrees of freedom
A)Based on this regression,we are 95% confident that the mean index of exposure will increase between 162.5 and 188.2 points for each one-unit increase in the cancer mortality rate.
B)Based on this regression,95% of all random samples will have a mean cancer mortality rate between 162.5 and 188.2 deaths per 100,000.
C)With 95% confidence,the cancer mortality rate for a region with an index of exposure of 6.57 is between 162.5 and 188.2 deaths per 100,000,based on this regression.
D)Based on this regression,we are 95% confident that the mean cancer mortality rate will increase between 162.5 and 188.2 deaths per 100,000 for each one-unit increase in the index of exposure.
E)With 95% confidence,the mean cancer mortality rate for regions with an index of exposure of 6.57 is between 162.5 and 188.2 deaths per 100,000,based on this regression.
Question
Applicants for a particular job,which involves extensive travel in Spanish-speaking countries,must take a proficiency test in Spanish.The sample data below were obtained in a study of the relationship between the numbers of years applicants have studied Spanish and their score on the test.A 95% confidence interval for the mean score of all applicants who have studied Spanish for 2.5 years was determined to be (53.0,64.6).Give an interpretation of this interval. 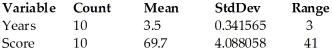 Dependent variable is: Score R-squared = 83.0%
S = 5.65138 with 10 - 2 = 8 degrees of freedom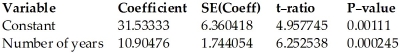
A)Based on this regression,we are 95% confident that applicants will score between 53.0 and 64.6 points higher on the proficiency test for each additional year spent studying Spanish.
B)Based on this regression,we are 95% confident that all applicants who have studied Spanish for 2.5 years will average between 53.0 and 64.6 points on the proficiency test.
C)Based on this regression,we are 95% confident an applicant who has studied Spanish for 2.5 years will score between 53.0 and 64.6 points on the proficiency test.
D)Based on this regression,95% of all random samples will have an average score between 53.0 and 64.6 points on the proficiency test.
E)Based on this regression,we are 95% confident that a randomly selected applicant who has studied Spanish for 2.5 years will score between 53.0 and 64.6 points on the proficiency test.
Dependent variable is: Score R-squared = 83.0%S = 5.65138 with 10 - 2 = 8 degrees of freedom
A)Based on this regression,we are 95% confident that applicants will score between 53.0 and 64.6 points higher on the proficiency test for each additional year spent studying Spanish.
B)Based on this regression,we are 95% confident that all applicants who have studied Spanish for 2.5 years will average between 53.0 and 64.6 points on the proficiency test.
C)Based on this regression,we are 95% confident an applicant who has studied Spanish for 2.5 years will score between 53.0 and 64.6 points on the proficiency test.
D)Based on this regression,95% of all random samples will have an average score between 53.0 and 64.6 points on the proficiency test.
E)Based on this regression,we are 95% confident that a randomly selected applicant who has studied Spanish for 2.5 years will score between 53.0 and 64.6 points on the proficiency test.
Question
A grass seed company conducts a study to determine the relationship between the density of seeds planted (in pounds per 500 sq ft)and the quality of the resulting lawn.Eight similar plots of land are selected and each is planted with a particular density of seed.One month later the quality of each lawn is rated on a scale of 0 to 100.The regression analysis and summary statistics are given below.Determine a 99% confidence interval for the average lawn quality of a lawn sown with a seed density of 2.1. 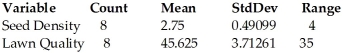 Dependent variable is: Lawn Quality R-squared = 36.0%
S = 9.073602 with 8 - 2 = 6 degrees of freedom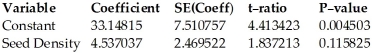
A)8.5 to 76.8
B)6.5 to 78.8
C)30.4 to 73.4
D)33.5 to 51.8
E)29.4 to 56.0
Dependent variable is: Lawn Quality R-squared = 36.0%S = 9.073602 with 8 - 2 = 6 degrees of freedom
A)8.5 to 76.8
B)6.5 to 78.8
C)30.4 to 73.4
D)33.5 to 51.8
E)29.4 to 56.0
Question
The typing speeds (in words per minute)and reading speeds (in words per minute)of nine randomly selected secretaries were recorded.Use the regression analysis and summary statistics provided below to determine a 90% confidence interval for the average reading speed of a secretary whose typing speed is 71.  Dependent variable is: Reading speed R-squared = 12.385%
S = 100.3348 with 9 - 2 = 7 degrees of freedom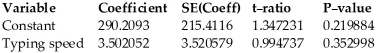
A)330.4 to 747.3 words per minute
B)444.1 to 633.6 words per minute
C)532.2 to 545.5 words per minute
D)405.9 to 450.9 words per minute
E)326.4 to 751.3 words per minute
Dependent variable is: Reading speed R-squared = 12.385%S = 100.3348 with 9 - 2 = 7 degrees of freedom
A)330.4 to 747.3 words per minute
B)444.1 to 633.6 words per minute
C)532.2 to 545.5 words per minute
D)405.9 to 450.9 words per minute
E)326.4 to 751.3 words per minute
Question
Question
Consider a logistic regression model for the probability of a "success",given a quantitative variable X.  Use the output above to estimate the probability of a failure when X = 25.
A)0.1824
B)0.8176
C)0.2019
D)0.7981
E)0.2231
Use the output above to estimate the probability of a failure when X = 25.A)0.1824
B)0.8176
C)0.2019
D)0.7981
E)0.2231

Unlock Deck
Sign up to unlock the cards in this deck!
Unlock Deck
Unlock Deck
1/57
Play
Full screen (f)
Deck 24: Inferences for Regression
1
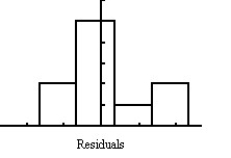
In the context of regression analysis,explain what is meant by the term "residual".
A residual is the difference between the observed and predicted value of the response variable.In other words,the residuals are the errors made when using the regression equation to predict the values of the response variable.
2
A grass seed company conducts a study to determine the relationship between the density of seeds planted (in pounds per 500 sq ft)and the quality of the resulting lawn.Eight similar plots of land are selected and each is planted with a particular density of seed.One month later the quality of each lawn is rated on a scale of 0 to 100.The regression analysis is given below. Dependent variable is: Lawn Quality
R-squared = 36.0%
Residual Standard Deviation = 9.073602 with df = 6
Sx = 1.929
A)2.469
B)1.929
C)2.667
D)9.074
E)2.922
R-squared = 36.0%
Residual Standard Deviation = 9.073602 with df = 6
Sx = 1.929
A)2.469
B)1.929
C)2.667
D)9.074
E)2.922
2.469
3
The index of exposure to radioactive waste and the cancer mortality rates (deaths per 100,000)were recorded for nine different geographic regions. Dependent variable is: Cancer Mortality Rate
R-squared = 85.8%
S = 14.00993 with 9 - 2 = 7 degrees of freedom
A)Cancer Mortality Rate = 114.7156 + 9.231456 × Index of Exp; The cancer mortality rates in these counties increase by about 9.231456 deaths per 100,000 for each 1 point increase in the index of exposure to radioactive waste.
B)Cancer Mortality Rate = 114.7156 + 9.231456 × Index of Exp; The cancer mortality rates in these counties increase by about 114.7156 deaths per 100,000 for each 1 point increase in the index of exposure to radioactive waste.
C)Cancer Mortality Rate = 114.7156 × Index of Exp + 9.231456; The cancer mortality rates in these counties increase by about 114.7156 deaths per 100,000 for each 1 point increase in the index of exposure to radioactive waste.
D)Cancer Mortality Rate = 114.7156 × Index of Exp + 9.231456; The cancer mortality rates in these counties increase by about 9.231456 deaths per 100,000 for each 1 point increase in the index of exposure to radioactive waste.
E)Index of Exp = 114.7156 + 9.231456 × Cancer Mortality Rate; The index of exposure to radioactive waste in these counties increases by about 9.231456 points for every 1 death per 100,000 increase in the cancer mortality rate.
R-squared = 85.8%
S = 14.00993 with 9 - 2 = 7 degrees of freedom
A)Cancer Mortality Rate = 114.7156 + 9.231456 × Index of Exp; The cancer mortality rates in these counties increase by about 9.231456 deaths per 100,000 for each 1 point increase in the index of exposure to radioactive waste.
B)Cancer Mortality Rate = 114.7156 + 9.231456 × Index of Exp; The cancer mortality rates in these counties increase by about 114.7156 deaths per 100,000 for each 1 point increase in the index of exposure to radioactive waste.
C)Cancer Mortality Rate = 114.7156 × Index of Exp + 9.231456; The cancer mortality rates in these counties increase by about 114.7156 deaths per 100,000 for each 1 point increase in the index of exposure to radioactive waste.
D)Cancer Mortality Rate = 114.7156 × Index of Exp + 9.231456; The cancer mortality rates in these counties increase by about 9.231456 deaths per 100,000 for each 1 point increase in the index of exposure to radioactive waste.
E)Index of Exp = 114.7156 + 9.231456 × Cancer Mortality Rate; The index of exposure to radioactive waste in these counties increases by about 9.231456 points for every 1 death per 100,000 increase in the cancer mortality rate.
Cancer Mortality Rate = 114.7156 + 9.231456 × Index of Exp; The cancer mortality rates in these counties increase by about 9.231456 deaths per 100,000 for each 1 point increase in the index of exposure to radioactive waste.
4
Decide whether or not the conditions and assumptions for regression inference are satisfied. Explain your answer.
Unlock Deck
Unlock for access to all 57 flashcards in this deck.
Unlock Deck
k this deck
5
Determine which plot shows the strongest linear correlation.
A)
B)
C)
A)
B)
C)
Unlock Deck
Unlock for access to all 57 flashcards in this deck.
Unlock Deck
k this deck
6
A grass seed company conducts a study to determine the relationship between the density of seeds planted (in pounds per 500 sq ft)and the quality of the resulting lawn.Eight similar plots of land are selected and each is planted with a particular density of seed.One month later the quality of each lawn is rated on a scale of 0 to 100.The regression analysis is given below. Dependent variable is: Lawn Quality
R-squared = 36.0%
S = 9.073602 with 8 - 2 = 6 degrees of freedom
A)Lawn Quality = 33.14815 + 4.537037 × Seed Density; We estimate that the lawn quality of these plots increases about 4.537037 points for each 1 pound per 500 square foot increase in seed density.
B)Lawn Quality = 33.14815 × Seed Density + 4.537037; We estimate that the lawn quality of these plots increases about 4.537037 points for each 1 pound per 500 square foot increase in seed density.
C)Seed Density = 33.14815 + 4.537037 × Lawn Quality; We estimate that the seed density of these plots increases about 4.537037 pounds per 500 square feet for each 1 point increase in lawn quality.
D)Lawn Quality = 33.14815 × Seed Density + 4.537037; We estimate that the lawn quality of these plots increases about 33.14815 points for each 1 pound per 500 square foot increase in seed density.
E)Lawn Quality = 33.14815 + 4.537037 × Seed Density; We estimate that the lawn quality of these plots increases about 33.14815 points for each 1 pound per 500 square foot increase in seed density.
Unlock Deck
Unlock for access to all 57 flashcards in this deck.
Unlock Deck
k this deck
7
A Regression Model
Decide whether or not the conditions and assumptions for regression inference are satisfied. Explain your answer.
Decide whether or not the conditions and assumptions for regression inference are satisfied. Explain your answer.
Unlock Deck
Unlock for access to all 57 flashcards in this deck.
Unlock Deck
k this deck
8
Applicants for a particular job,which involves extensive travel in Spanish-speaking countries,must take a proficiency test in Spanish.The sample data below were obtained in a study of the relationship between the numbers of years applicants have studied Spanish and their score on the test.Use the regression analysis below to explain what the R-squared in this regression means.
Dependent variable is: Score
R-squared = 83.0%
s = 5.65138 with 10 - 2 = 8 degrees of freedom
Dependent variable is: Score
R-squared = 83.0%
s = 5.65138 with 10 - 2 = 8 degrees of freedom
Unlock Deck
Unlock for access to all 57 flashcards in this deck.
Unlock Deck
k this deck
9
The index of exposure to radioactive waste and the cancer mortality rates (deaths per 100,000)were recorded for nine different geographic regions.Explain what the R-squared in this regression means.
Dependent variable is: Cancer Mortality Rate
R-squared = 85.8%
s = 14.00993 with 9 - 2 = 7 degrees of freedom
Dependent variable is: Cancer Mortality Rate
R-squared = 85.8%
s = 14.00993 with 9 - 2 = 7 degrees of freedom
Unlock Deck
Unlock for access to all 57 flashcards in this deck.
Unlock Deck
k this deck
10
Decide whether or not the conditions and assumptions for regression inference are satisfied. Explain your answer.
Unlock Deck
Unlock for access to all 57 flashcards in this deck.
Unlock Deck
k this deck
11
Determine which plot shows the strongest linear correlation.
A)
B)
C)
A)
B)
C)
Unlock Deck
Unlock for access to all 57 flashcards in this deck.
Unlock Deck
k this deck
12
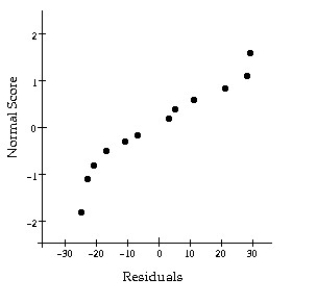
If the assumptions for regression inferences are met,what would you expect to see when constructing a residual plot and a normal probability plot for the residuals?
Unlock Deck
Unlock for access to all 57 flashcards in this deck.
Unlock Deck
k this deck
13
Applicants for a particular job,which involves extensive travel in Spanish-speaking countries,must take a proficiency test in Spanish.The sample data below were obtained in a study of the relationship between the numbers of years applicants have studied Spanish and their score on the test. Using a 1% level of significance,do the data provide sufficient evidence to conclude that the slope of the regression line is not 0 and hence that number of years of study is useful as a predictor of score on the test?
Using a 1% level of significance,do the data provide sufficient evidence to conclude that the slope of the regression line is not 0 and hence that number of years of study is useful as a predictor of score on the test? Unlock Deck
Unlock for access to all 57 flashcards in this deck.
Unlock Deck
k this deck
14
Ten students in a graduate program at the University of Toronto were randomly selected.Their grade point averages (GPAs)when they entered the program were between 3.5 and 4.0.The data consist of the students' GPAs on entering the program and their current GPAs.Several graphs are shown below.
Unlock Deck
Unlock for access to all 57 flashcards in this deck.
Unlock Deck
k this deck
15
Applicants for a particular job,which involves extensive travel in Spanish-speaking countries,must take a proficiency test in Spanish.The sample data were obtained in a study of the relationship between the numbers of years applicants have studied Spanish and their score on the test. Dependent variable is: Score
R-squared = 83.0%
Residual Standard Deviation = 5.65138 with df = 8
Sx = 1.1667
A)1.850
B)1.167
C)1.744
D)5.651
E)1.978
R-squared = 83.0%
Residual Standard Deviation = 5.65138 with df = 8
Sx = 1.1667
A)1.850
B)1.167
C)1.744
D)5.651
E)1.978
Unlock Deck
Unlock for access to all 57 flashcards in this deck.
Unlock Deck
k this deck
16
Applicants for a particular job,which involves extensive travel in Spanish-speaking countries,must take a proficiency test in Spanish.The sample data were obtained in a study of the relationship between the numbers of years applicants have studied Spanish and their score on the test.
Dependent variable is: Score
R-squared = 83.0%
S = 5.65138 with 10 - 2 = 8 degrees of freedom
A)Score = 31.53333 × Number of Years + 10.90476; We estimate that the scores on the proficiency test for these applicants increase about 10.90476 points for each additional year spent studying Spanish.
B)Score = 31.53333 + 10.90476 × Number of Years; We estimate that the scores on the proficiency test for these applicants increase about 31.53333 points for each additional year spent studying Spanish.
C)Score = 31.53333 + 10.90476 × Number of Years; We estimate that the scores on the proficiency test for these applicants increase about 10.90476 points for each additional year spent studying Spanish.
D)Number of Years = 31.53333 + 10.90476 × Score; We estimate that the number of years spent studying Spanish increases about 10.90476 years for each additional point scored on the test.
E)Score = 31.53333 × Number of Years + 10.90476; We estimate that the scores on the proficiency test for these applicants increase about 31.53333 points for each additional year spent studying Spanish.
Unlock Deck
Unlock for access to all 57 flashcards in this deck.
Unlock Deck
k this deck
17
Ten students in a graduate program at the University of Toronto were randomly selected.Their grade point averages (GPAs)when they entered the program were between 3.5 and 4.0.The students' GPAs on entering the program and their current GPAs were recorded. Dependent variable is: Current GPA
R-squared = 0.677968
S =0.024768 with 10 - 2 = 8 degrees of freedom
A)Entering GPA = 3.584756 + 0.090953 × Current GPA; We estimate that the entering GPA for these students increases by 0.090953 points for each 1 point increase in their current GPA.
B)Current GPA = 3.584756 + 0.090953 × Entering GPA; We estimate that the current GPA for these students increases by 3.584756 points for each 1 point increase in their entering GPA.
C)Current GPA = 3.584756 × Entering GPA + 0.090953; We estimate that the current GPA for these students increases by 3.584756 points for each 1 point increase in their entering GPA.
D)Current GPA = 3.584756 + 0.090953 × Entering GPA; We estimate that the current GPA for these students increases by 0.090953 points for each 1 point increase in their entering GPA.
E)Current GPA = 3.584756 × Entering GPA + 0.090953; We estimate that the current GPA for these students increases by 0.090953 points for each 1 point increase in their entering GPA.
R-squared = 0.677968
S =0.024768 with 10 - 2 = 8 degrees of freedom
A)Entering GPA = 3.584756 + 0.090953 × Current GPA; We estimate that the entering GPA for these students increases by 0.090953 points for each 1 point increase in their current GPA.
B)Current GPA = 3.584756 + 0.090953 × Entering GPA; We estimate that the current GPA for these students increases by 3.584756 points for each 1 point increase in their entering GPA.
C)Current GPA = 3.584756 × Entering GPA + 0.090953; We estimate that the current GPA for these students increases by 3.584756 points for each 1 point increase in their entering GPA.
D)Current GPA = 3.584756 + 0.090953 × Entering GPA; We estimate that the current GPA for these students increases by 0.090953 points for each 1 point increase in their entering GPA.
E)Current GPA = 3.584756 × Entering GPA + 0.090953; We estimate that the current GPA for these students increases by 0.090953 points for each 1 point increase in their entering GPA.
Unlock Deck
Unlock for access to all 57 flashcards in this deck.
Unlock Deck
k this deck
18
In a study of the relationship between weight and height,a sample regression equation is obtained,in which height is used as the predictor variable.This sample regression equation is then used to make inferences.Which of the following statements is true?
A)A 95% confidence interval for the mean weight of all subjects of height 165 cm will be the same width as a 95% prediction interval for the weight of an individual of height 165 cm.
B)A 95% confidence interval for the mean weight of all subjects of height 165 cm will be narrower than a 95% prediction interval for the weight of an individual of height 165 cm.
C)A 95% confidence interval for the mean weight of all subjects of height 165 cm will be wider than a 95% prediction interval for the weight of an individual of height 165 cm.
Unlock Deck
Unlock for access to all 57 flashcards in this deck.
Unlock Deck
k this deck
19
The reading speeds (in tens of words per minute)and typing speeds (in words per minute)of nine randomly selected secretaries were recorded. Dependent variable is: Reading speed
R-squared = 97.9521%
S = 2.094847 with 9 - 2 = 7 degrees of freedom
A)Reading speed = -40.738 + 2.260433 × Typing speed; We estimate that the reading speeds for these secretaries increase about 2.260433 words per minute for each 10 word per minute increase in their typing speed.
B)Typing speed = -40.738 × Reading speed + 2.260433; We estimate that the typing speeds for these secretaries increase about 2.260433 words per minute for each 10 word per minute increase in their reading speed.
C)Reading speed = -40.738 + 2.260433 × Typing speed; We estimate that the reading speeds for these secretaries increase about 22.60433 words per minute for each 1 word per minute increase in their typing speed.
D)Typing speed = -40.738 + 2.260433 × Reading speed; We estimate that the typing speeds for these secretaries decrease about 40.738 words per minute for each 10 word per minute increase in their reading speed.
E)Typing speed = -40.738 × Reading speed + 2.260433; We estimate that the typing speeds for these secretaries decrease about 40.738 words per minute for each 10 word per minute increase in their reading speed.
R-squared = 97.9521%
S = 2.094847 with 9 - 2 = 7 degrees of freedom
A)Reading speed = -40.738 + 2.260433 × Typing speed; We estimate that the reading speeds for these secretaries increase about 2.260433 words per minute for each 10 word per minute increase in their typing speed.
B)Typing speed = -40.738 × Reading speed + 2.260433; We estimate that the typing speeds for these secretaries increase about 2.260433 words per minute for each 10 word per minute increase in their reading speed.
C)Reading speed = -40.738 + 2.260433 × Typing speed; We estimate that the reading speeds for these secretaries increase about 22.60433 words per minute for each 1 word per minute increase in their typing speed.
D)Typing speed = -40.738 + 2.260433 × Reading speed; We estimate that the typing speeds for these secretaries decrease about 40.738 words per minute for each 10 word per minute increase in their reading speed.
E)Typing speed = -40.738 × Reading speed + 2.260433; We estimate that the typing speeds for these secretaries decrease about 40.738 words per minute for each 10 word per minute increase in their reading speed.
Unlock Deck
Unlock for access to all 57 flashcards in this deck.
Unlock Deck
k this deck
20
Ten students from a large lecture course were randomly sampled to see how many hours they studied for the final exam and their grade on the final exam.The professor wants to conduct a linear regression to determine if there is an association between the amount of time spent studying and the student's grade on the exam.Several plots are shown below.
Unlock Deck
Unlock for access to all 57 flashcards in this deck.
Unlock Deck
k this deck
21
The sample data below are the typing speeds (in words per minute)and reading speeds (in words per minute)of nine randomly selected secretaries. Using a 10% level of significance,do the data provide sufficient evidence of an association between typing speed and reading speed?
Using a 10% level of significance,do the data provide sufficient evidence of an association between typing speed and reading speed? Unlock Deck
Unlock for access to all 57 flashcards in this deck.
Unlock Deck
k this deck
22
The index of exposure to radioactive waste and the cancer mortality rates (deaths per 100,000)were recorded for nine different geographic regions.A 99% confidence interval for the slope of the regression line was determined to be (4.27,14.20).Give an interpretation of this interval. Dependent variable is: Cancer Mortality Rate
R-squared = 85.8%
S = 14.00993 with 9 - 2 = 7 degrees of freedom
A)Based on this regression,we are 99% confident that the mean cancer mortality rate is between 4.27 and 14.20 deaths per 100,000.
B)We can be 99% confident that with each unit increase in the index of exposure,the decrease in mean cancer mortality rate is between 4.27 and 14.20 deaths per 100,000.
C)We can be 99% confident that with each unit increase in the index of exposure,the increase in mean cancer mortality rate is between 4.27 and 14.20 deaths per 100,000.
D)Based on this regression,we are 99% confident that the mean cancer mortality rate is increasing between 4.27 and 14.20 deaths per 100,000 per year.
E)We are 99% confident that with each unit increase in the cancer mortality rate,the increase in the mean index of exposure is between 4.27 and 14.20 deaths per 100,000.
R-squared = 85.8%
S = 14.00993 with 9 - 2 = 7 degrees of freedom
A)Based on this regression,we are 99% confident that the mean cancer mortality rate is between 4.27 and 14.20 deaths per 100,000.
B)We can be 99% confident that with each unit increase in the index of exposure,the decrease in mean cancer mortality rate is between 4.27 and 14.20 deaths per 100,000.
C)We can be 99% confident that with each unit increase in the index of exposure,the increase in mean cancer mortality rate is between 4.27 and 14.20 deaths per 100,000.
D)Based on this regression,we are 99% confident that the mean cancer mortality rate is increasing between 4.27 and 14.20 deaths per 100,000 per year.
E)We are 99% confident that with each unit increase in the cancer mortality rate,the increase in the mean index of exposure is between 4.27 and 14.20 deaths per 100,000.
Unlock Deck
Unlock for access to all 57 flashcards in this deck.
Unlock Deck
k this deck
23
A grass seed company conducts a study to determine the relationship between the density of seeds planted (in pounds per 500 sq ft)and the quality of the resulting lawn.Eight similar plots of land are selected and each is planted with a particular density of seed.One month later the quality of each lawn is rated on a scale of 0 to 100.The sample data are given below. Using a 10% level of significance,is there evidence of an association between seed density and lawn quality?
Using a 10% level of significance,is there evidence of an association between seed density and lawn quality? Unlock Deck
Unlock for access to all 57 flashcards in this deck.
Unlock Deck
k this deck
24
The typing speeds (in words per minute)and reading speeds (in words per minute)of nine randomly selected secretaries were recorded.Use the regression analysis and summary statistics provided below to determine a 90% prediction interval for the reading speed of a secretary whose typing speed is 50. Dependent variable is: Reading speed R-squared = 12.385%
S = 100.3348 with 9 - 2 = 7 degrees of freedom
A)371.1 to 559.5 words per minute
B)253.1 to 677.5 words per minute
C)405.9 to 450.9 words per minute
D)257.1 to 673.6 words per minute
E)458.6 to 472.0 words per minute
Dependent variable is: Reading speed R-squared = 12.385%S = 100.3348 with 9 - 2 = 7 degrees of freedom
A)371.1 to 559.5 words per minute
B)253.1 to 677.5 words per minute
C)405.9 to 450.9 words per minute
D)257.1 to 673.6 words per minute
E)458.6 to 472.0 words per minute
Unlock Deck
Unlock for access to all 57 flashcards in this deck.
Unlock Deck
k this deck
25
Applicants for a particular job,which involves extensive travel in Spanish-speaking countries,must take a proficiency test in Spanish.The sample data below were obtained in a study of the relationship between the numbers of years applicants have studied Spanish and their score on the test.Using a 1% level of significance,do the data provide sufficient evidence to conclude that the slope of the regression line is not 0 and hence that number of years of study is useful as a predictor of score on the test? The regression analysis is given below.
Dependent variable is: Score
R-squared = 83.0%
s = 5.65138 with 10 - 2 = 8 degrees of freedom
Dependent variable is: Score
R-squared = 83.0%
s = 5.65138 with 10 - 2 = 8 degrees of freedom
Unlock Deck
Unlock for access to all 57 flashcards in this deck.
Unlock Deck
k this deck
26
Ten students in a graduate program at the University of Toronto were randomly selected.Their grade point averages (GPAs)when they entered the program were between 3.5 and 4.0.The following data consist of the students' GPAs on entering the program and their current GPAs. Using a 10% level of significance,do the data below provide evidence of the conclusion that higher entering GPAs are associated with higher current GPAs?
Using a 10% level of significance,do the data below provide evidence of the conclusion that higher entering GPAs are associated with higher current GPAs? Unlock Deck
Unlock for access to all 57 flashcards in this deck.
Unlock Deck
k this deck
27
The typing speeds (in words per minute)and reading speeds (in words per minute)of nine randomly selected secretaries were recorded.Using a 10% level of significance,use the regression analysis provided below to determine if there is sufficient evidence of an association between typing speed and reading speed.
Dependent variable is: Reading speed
R-squared = 12.385%
s = 100.3348 with 9 - 2 = 7 degrees of freedom
Dependent variable is: Reading speed
R-squared = 12.385%
s = 100.3348 with 9 - 2 = 7 degrees of freedom
Unlock Deck
Unlock for access to all 57 flashcards in this deck.
Unlock Deck
k this deck
28
Ten students in a graduate program at the University of Toronto were randomly selected.Their grade point averages (GPAs)when they entered the program were between 3.5 and 4.0.The students' GPAs on entering the program and their current GPAs were recorded.Use the regression analysis provided below to find a 95% confidence interval for the slope of the regression line. Dependent variable is: Current GPA
R-squared = 0.001849
S = 0.1452 with 10 - 2 = 8 degrees of freedom
A)(-0.45,0.51)
B)(-0.83,0.89)
C)(-0.56,0.62)
D)(1.48,5.87)
E)(-0.44,0.50)
R-squared = 0.001849
S = 0.1452 with 10 - 2 = 8 degrees of freedom
A)(-0.45,0.51)
B)(-0.83,0.89)
C)(-0.56,0.62)
D)(1.48,5.87)
E)(-0.44,0.50)
Unlock Deck
Unlock for access to all 57 flashcards in this deck.
Unlock Deck
k this deck
29
Applicants for a particular job,which involves extensive travel in Spanish-speaking countries,must take a proficiency test in Spanish.The sample data were obtained in a study of the relationship between the numbers of years applicants have studied Spanish and their score on the test.Use the regression analysis and summary statistics given below to find a 95% prediction interval for the score of an applicant who has studied Spanish for 2.2 years. Dependent variable is: Score R-squared = 83.0%
S = 5.65138 with 10 - 2 = 8 degrees of freedom
A)43.7 to 67.3
B)40.9 to 70.2
C)43.1 to 70.9
D)51.5 to 59.5
E)48.9 to 62.2
Dependent variable is: Score R-squared = 83.0%S = 5.65138 with 10 - 2 = 8 degrees of freedom
A)43.7 to 67.3
B)40.9 to 70.2
C)43.1 to 70.9
D)51.5 to 59.5
E)48.9 to 62.2
Unlock Deck
Unlock for access to all 57 flashcards in this deck.
Unlock Deck
k this deck
30
A grass seed company conducts a study to determine the relationship between the density of seeds planted (in pounds per 500 sq ft)and the quality of the resulting lawn.Eight similar plots of land are selected and each is planted with a particular density of seed.One month later the quality of each lawn is rated on a scale of 0 to 100.The regression analysis is given below.A 95% confidence interval for the slope of the regression line was determined to be (-1.51,10.58).Give an interpretation of this interval. Dependent variable is: Lawn Quality
R-squared = 36.0%
S = 9.073602 with 8 - 2 = 6 degrees of freedom
A)Based on this regression,each additional pound of seed per 500 square feet the average lawn quality will decrease by up to 1.51 or increase by up to 10.58 points,with 95% confidence.
B)We are 95% confident that a randomly selected plot will have a lawn quality between -1.51 and 10.58 points.
C)We are 95% confident that each additional point on the lawn quality scale will increase the average seed density by -1.51 to 10.58 pounds per 500 square feet.
D)Based on this regression,we are 95% confidence that the average lawn quality is between -1.51 and 10.58 points.
E)We are 95% confident that the average lawn quality will decrease by up to 1.51 or increase by up to 10.58 points per year.
R-squared = 36.0%
S = 9.073602 with 8 - 2 = 6 degrees of freedom
A)Based on this regression,each additional pound of seed per 500 square feet the average lawn quality will decrease by up to 1.51 or increase by up to 10.58 points,with 95% confidence.
B)We are 95% confident that a randomly selected plot will have a lawn quality between -1.51 and 10.58 points.
C)We are 95% confident that each additional point on the lawn quality scale will increase the average seed density by -1.51 to 10.58 pounds per 500 square feet.
D)Based on this regression,we are 95% confidence that the average lawn quality is between -1.51 and 10.58 points.
E)We are 95% confident that the average lawn quality will decrease by up to 1.51 or increase by up to 10.58 points per year.
Unlock Deck
Unlock for access to all 57 flashcards in this deck.
Unlock Deck
k this deck
31
Applicants for a particular job,which involves extensive travel in Spanish-speaking countries,must take a proficiency test in Spanish.The sample data were obtained in a study of the relationship between the numbers of years applicants have studied Spanish and their score on the test.A 99% confidence interval for the slope of the regression line was determined to be (5.05,16.76).Give an interpretation of this interval. Dependent variable is: Score
R-squared = 83.0%
S = 5.65138 with 10 - 2 = 8 degrees of freedom
A)Based on these data,we are 99% confident that the mean test score is between 5.05 and 16.76 points.
B)Based on these data,we are 99% confident that a randomly selected applicant will score between 5.05 and 16.76 points on the test.
C)Based on these data,we are 99% confident that the average test score decreases between 5.05 and 16.76 points for every additional year spent studying Spanish.
D)Based on these data,we are 99% confident that the average test score increases between 5.05 and 16.76 points for every additional year spent studying Spanish.
E)Based on these data,we are 99% confident that the number of years spent studying Spanish increases between 5.05 and 16.76 years for every additional point earned on the test.
R-squared = 83.0%
S = 5.65138 with 10 - 2 = 8 degrees of freedom
A)Based on these data,we are 99% confident that the mean test score is between 5.05 and 16.76 points.
B)Based on these data,we are 99% confident that a randomly selected applicant will score between 5.05 and 16.76 points on the test.
C)Based on these data,we are 99% confident that the average test score decreases between 5.05 and 16.76 points for every additional year spent studying Spanish.
D)Based on these data,we are 99% confident that the average test score increases between 5.05 and 16.76 points for every additional year spent studying Spanish.
E)Based on these data,we are 99% confident that the number of years spent studying Spanish increases between 5.05 and 16.76 years for every additional point earned on the test.
Unlock Deck
Unlock for access to all 57 flashcards in this deck.
Unlock Deck
k this deck
32
The index of exposure to radioactive waste and the cancer mortality rates (deaths per 100,000)were recorded for nine different geographic regions.Use the regression analysis provided below to find a 99% confidence interval for the slope of the regression line. Dependent variable is: Cancer Mortality Rate
R-squared = 85.8%
S = 14.00993 with 9 - 2 = 7 degrees of freedom
A)(5.88,12.59)
B)(4.46,14.00)
C)(4.97,13.49)
D)(4.27,14.20)
E)(5.11,13.35)
R-squared = 85.8%
S = 14.00993 with 9 - 2 = 7 degrees of freedom
A)(5.88,12.59)
B)(4.46,14.00)
C)(4.97,13.49)
D)(4.27,14.20)
E)(5.11,13.35)
Unlock Deck
Unlock for access to all 57 flashcards in this deck.
Unlock Deck
k this deck
33
The typing speeds (in words per minute)and reading speeds (in words per minute)of nine randomly selected secretaries were recorded.Use the regression analysis provided below to find a 90% confidence interval for the slope of the regression line. Dependent variable is: Reading speed
R-squared = 12.385%
S = 100.3348 with 9 - 2 = 7 degrees of freedom
A)(-3.05,10.05)
B)(-1.48,8.48)
C)(-1.42,8.42)
D)(-3.17,10.17)
E)(-4.82,11.83)
R-squared = 12.385%
S = 100.3348 with 9 - 2 = 7 degrees of freedom
A)(-3.05,10.05)
B)(-1.48,8.48)
C)(-1.42,8.42)
D)(-3.17,10.17)
E)(-4.82,11.83)
Unlock Deck
Unlock for access to all 57 flashcards in this deck.
Unlock Deck
k this deck
34
The sample data below are the index of exposure to radioactive waste for nine different geographic regions and cancer mortality rates (deaths per 100,000). Using a 1% level of significance,do the data below support the claim that a higher index of exposure is associated with a higher cancer mortality rate?
Using a 1% level of significance,do the data below support the claim that a higher index of exposure is associated with a higher cancer mortality rate? Unlock Deck
Unlock for access to all 57 flashcards in this deck.
Unlock Deck
k this deck
35
Applicants for a particular job,which involves extensive travel in Spanish-speaking countries,must take a proficiency test in Spanish.The sample data were obtained in a study of the relationship between the numbers of years applicants have studied Spanish and their score on the test.Use the regression analysis given below to find a 99% confidence interval for the slope of the regression line. Dependent variable is: Score
R-squared = 83.0%
S = 5.65138 with 10 - 2 = 8 degrees of freedom
A)(5.23,16.57)
B)(5.05,16.76)
C)(9.16,12.65)
D)(6.88,14.93)
E)(25.70,37.40)
R-squared = 83.0%
S = 5.65138 with 10 - 2 = 8 degrees of freedom
A)(5.23,16.57)
B)(5.05,16.76)
C)(9.16,12.65)
D)(6.88,14.93)
E)(25.70,37.40)
Unlock Deck
Unlock for access to all 57 flashcards in this deck.
Unlock Deck
k this deck
36
The index of exposure to radioactive waste and the cancer mortality rates (deaths per 100,000)were recorded for nine different geographic regions.Using a 1% level of significance,use the regression analysis provided below to perform the hypothesis test to determine if the index of exposure is useful as a predictor or cancer mortality rate.
Dependent variable is: Cancer Mortality Rate
R-squared = 85.8%
s = 14.00993 with 9 - 2 = 7 degrees of freedom
Dependent variable is: Cancer Mortality Rate
R-squared = 85.8%
s = 14.00993 with 9 - 2 = 7 degrees of freedom
Unlock Deck
Unlock for access to all 57 flashcards in this deck.
Unlock Deck
k this deck
37
A grass seed company conducts a study to determine the relationship between the density of seeds planted (in pounds per 500 sq ft)and the quality of the resulting lawn.Eight similar plots of land are selected and each is planted with a particular density of seed.One month later the quality of each lawn is rated on a scale of 0 to 100.The regression analysis and summary statistics are given below.Determine a 99% prediction interval for the lawn quality of a lawn sown with a seed density of 1.3. Dependent variable is: Lawn Quality R-squared = 36.0%
S = 9.073602 with 8 - 2 = 6 degrees of freedom
A)1.0 to 77.1
B)3.1 to 75.0
C)21.2 to 56.9
D)29.9 to 48.2
E)30.4 to 73.4
Dependent variable is: Lawn Quality R-squared = 36.0%S = 9.073602 with 8 - 2 = 6 degrees of freedom
A)1.0 to 77.1
B)3.1 to 75.0
C)21.2 to 56.9
D)29.9 to 48.2
E)30.4 to 73.4
Unlock Deck
Unlock for access to all 57 flashcards in this deck.
Unlock Deck
k this deck
38
Ten students in a graduate program were randomly selected.Their grade point averages (GPAs)when they entered the program were between 3.5 and 4.0.The students' GPAs on entering the program and their current GPAs were recorded.Using a 10% level of significance,do the data below provide evidence of the conclusion that higher entering GPAs are associated with higher current GPA?
Dependent variable is: Current GPA
R-squared = 0.001849
s = 0.1452 with 10 - 2 = 8 degrees of freedom
Dependent variable is: Current GPA
R-squared = 0.001849
s = 0.1452 with 10 - 2 = 8 degrees of freedom
Unlock Deck
Unlock for access to all 57 flashcards in this deck.
Unlock Deck
k this deck
39
A grass seed company conducts a study to determine the relationship between the density of seeds planted (in pounds per 500 sq ft)and the quality of the resulting lawn.Eight similar plots of land are selected and each is planted with a particular density of seed.One month later the quality of each lawn is rated on a scale of 0 to 100.The regression analysis is given below.Find a 95% confidence interval for the slope of the regression line. Dependent variable is: Lawn Quality
R-squared = 36.0%
S = 9.073602 with 8 - 2 = 6 degrees of freedom
A)(-0.26,9.34)
B)(-1.51,10.58)
C)(14.77,51.53)
D)(27.10,39.18)
E)(-1.30,10.38)
R-squared = 36.0%
S = 9.073602 with 8 - 2 = 6 degrees of freedom
A)(-0.26,9.34)
B)(-1.51,10.58)
C)(14.77,51.53)
D)(27.10,39.18)
E)(-1.30,10.38)
Unlock Deck
Unlock for access to all 57 flashcards in this deck.
Unlock Deck
k this deck
40
A grass seed company conducts a study to determine the relationship between the density of seeds planted (in pounds per 500 sq ft)and the quality of the resulting lawn.Eight similar plots of land are selected and each is planted with a particular density of seed.One month later the quality of each lawn is rated on a scale of 0 to 100.The regression analysis is given below.Using a 10% level of significance,is there evidence of an association between seed density and lawn quality?
Dependent variable is: Lawn Quality
R-squared = 36.0%
s = 9.073602 with 8 - 2 = 6 degrees of freedom
Dependent variable is: Lawn Quality
R-squared = 36.0%
s = 9.073602 with 8 - 2 = 6 degrees of freedom
Unlock Deck
Unlock for access to all 57 flashcards in this deck.
Unlock Deck
k this deck
41
Applicants for a particular job,which involves extensive travel in Spanish-speaking countries,must take a proficiency test in Spanish.The sample data below were obtained in a study of the relationship between the numbers of years applicants have studied Spanish and their score on the test.Using a 1% level of significance,carry out a test to determine if the linear correlation is different from 0.The regression analysis is given below.
Dependent variable is: Score
R-squared = 83.0%
s = 5.65138 with 10 - 2 = 8 degrees of freedom
Dependent variable is: Score
R-squared = 83.0%
s = 5.65138 with 10 - 2 = 8 degrees of freedom
Unlock Deck
Unlock for access to all 57 flashcards in this deck.
Unlock Deck
k this deck
42
Consider a logistic regression model for the probability of a "success",given a quantitative variable X. Use the output above to estimate the odds in favour of a success when X = 25.
A)0.1824
B)0.8176
C)0.2019
D)0.7981
E)0.2231
Use the output above to estimate the odds in favour of a success when X = 25.A)0.1824
B)0.8176
C)0.2019
D)0.7981
E)0.2231
Unlock Deck
Unlock for access to all 57 flashcards in this deck.
Unlock Deck
k this deck
43
A grass seed company conducts a study to determine the relationship between the density of seeds planted (in pounds per 500 sq ft)and the quality of the resulting lawn.Eight similar plots of land are selected and each is planted with a particular density of seed.One month later the quality of each lawn is rated on a scale of 0 to 100.The regression analysis and summary statistics are given below.A 99% confidence interval for the mean lawn quality of all lawns sown with a seed density of 2.9 was found to be (32.3,56.3).Give an interpretation of this interval. Dependent variable is: Lawn Quality R-squared = 36.0%
S = 9.073602 with 8 - 2 = 6 degrees of freedom
A)Based on this regression,we are 99% confident that the average lawn quality for lawns with a seed density of 2.9 pounds per 500 square feet is between 32.3 and 56.3.
B)Based on this regression,99% of all random samples will have an average lawn quality between 32.3 and 56.3.
C)Based on this regression,we are 99% confident that the average seed density will increase between 32.3 and 56.3 pounds per 500 square feet for each additional one-point increase in lawn quality.
D)Based on this regression,we are 99% confident that the average lawn quality will increase between 32.3 and 56.3 points for each additional pound of seed per 500 square feet.
E)Based on this regression,we are 99% confident that the lawn quality for a lawn with a seed density of 2.9 is between 32.3 and 56.3.
Dependent variable is: Lawn Quality R-squared = 36.0%S = 9.073602 with 8 - 2 = 6 degrees of freedom
A)Based on this regression,we are 99% confident that the average lawn quality for lawns with a seed density of 2.9 pounds per 500 square feet is between 32.3 and 56.3.
B)Based on this regression,99% of all random samples will have an average lawn quality between 32.3 and 56.3.
C)Based on this regression,we are 99% confident that the average seed density will increase between 32.3 and 56.3 pounds per 500 square feet for each additional one-point increase in lawn quality.
D)Based on this regression,we are 99% confident that the average lawn quality will increase between 32.3 and 56.3 points for each additional pound of seed per 500 square feet.
E)Based on this regression,we are 99% confident that the lawn quality for a lawn with a seed density of 2.9 is between 32.3 and 56.3.
Unlock Deck
Unlock for access to all 57 flashcards in this deck.
Unlock Deck
k this deck
44
A grass seed company conducts a study to determine the relationship between the density of seeds planted (in pounds per 500 sq ft)and the quality of the resulting lawn.Eight similar plots of land are selected and each is planted with a particular density of seed.One month later the quality of each lawn is rated on a scale of 0 to 100.The regression analysis and summary statistics are given below.A 99% prediction interval for the lawn quality of a lawn sown with a seed density of 2.9 was determined to be . Dependent variable is: Lawn Quality R-squared = 36.0%
S = 9.073602 with 8 - 2 = 6 degrees of freedom
A)Based on this regression,we are 99% confident that the mean seed density will increase between 10.6 and 82.0 for each additional point of lawn quality over 2.9 pounds.
B)Based on this regression,we are 99% confident that the mean lawn quality will increase between 10.6 and 82.0 for each additional pound of seed density over 2.9 pounds.
C)Based on this regression,we are 99% confident that a lawn with a seed density of 2.9 pounds per 500 square feet will have a lawn quality between 10.6 and 82.0.
D)Based on this regression,we are 99% confident that the mean lawn quality for lawns with a seed density of 2.9 pounds per 500 square feet will be between 10.6 and 82.0.
E)Based on this regression,we know that 99% of all random samples will have a lawn quality between 10.6 and 82.0.
. Dependent variable is: Lawn Quality R-squared = 36.0%S = 9.073602 with 8 - 2 = 6 degrees of freedom
A)Based on this regression,we are 99% confident that the mean seed density will increase between 10.6 and 82.0 for each additional point of lawn quality over 2.9 pounds.
B)Based on this regression,we are 99% confident that the mean lawn quality will increase between 10.6 and 82.0 for each additional pound of seed density over 2.9 pounds.
C)Based on this regression,we are 99% confident that a lawn with a seed density of 2.9 pounds per 500 square feet will have a lawn quality between 10.6 and 82.0.
D)Based on this regression,we are 99% confident that the mean lawn quality for lawns with a seed density of 2.9 pounds per 500 square feet will be between 10.6 and 82.0.
E)Based on this regression,we know that 99% of all random samples will have a lawn quality between 10.6 and 82.0.
Unlock Deck
Unlock for access to all 57 flashcards in this deck.
Unlock Deck
k this deck
45
Applicants for a particular job,which involves extensive travel in Spanish-speaking countries,must take a proficiency test in Spanish.The sample data were obtained in a study of the relationship between the numbers of years applicants have studied Spanish and their score on the test.Use the regression analysis and summary statistics given below to find a 95% confidence interval for the average score of an applicant who has studied Spanish for 2.2 years. Dependent variable is: Score R-squared = 83.0%
S = 5.65138 with 10 - 2 = 8 degrees of freedom
A)51.5 to 59.5
B)43.1 to 70.9
C)43.7 to 67.3
D)48.9 to 62.2
E)40.9 to 70.2
Dependent variable is: Score R-squared = 83.0%S = 5.65138 with 10 - 2 = 8 degrees of freedom
A)51.5 to 59.5
B)43.1 to 70.9
C)43.7 to 67.3
D)48.9 to 62.2
E)40.9 to 70.2
Unlock Deck
Unlock for access to all 57 flashcards in this deck.
Unlock Deck
k this deck
46
Applicants for a particular job,which involves extensive travel in Spanish-speaking countries,must take a proficiency test in Spanish.The sample data below were obtained in a study of the relationship between the numbers of years applicants have studied Spanish and their score on the test.A 95% prediction interval for the score of an applicant who has studied Spanish for 2.6 years was determined to be (45.7,74.0). Dependent variable is: Score R-squared = 83.0%
S = 5.65138 with 10 - 2 = 8 degrees of freedom
A)Based on this regression,we are 95% confident that the mean test score for applicants who have studied Spanish for 2.6 years will be between 45.7 and 74.0.
B)Based on this regression,we are 95% confident that the mean number of years spent studying Spanish will increase between 45.7 and 74.0 years for each additional point earned on the test.
C)Based on this regression,we are 95% confident that the mean test score will increase between 45.7 and 74.0 points for each additional year spent studying Spanish.
D)Based on this regression,an applicant who has studied Spanish for 2.6 years will score between 45.7 and 74.0 on the proficiency test,with 95% confidence.
E)Based on this regression,we know that 95% of all random samples will have a mean test score between 45.7 and 74.0 points.
Dependent variable is: Score R-squared = 83.0%S = 5.65138 with 10 - 2 = 8 degrees of freedom
A)Based on this regression,we are 95% confident that the mean test score for applicants who have studied Spanish for 2.6 years will be between 45.7 and 74.0.
B)Based on this regression,we are 95% confident that the mean number of years spent studying Spanish will increase between 45.7 and 74.0 years for each additional point earned on the test.
C)Based on this regression,we are 95% confident that the mean test score will increase between 45.7 and 74.0 points for each additional year spent studying Spanish.
D)Based on this regression,an applicant who has studied Spanish for 2.6 years will score between 45.7 and 74.0 on the proficiency test,with 95% confidence.
E)Based on this regression,we know that 95% of all random samples will have a mean test score between 45.7 and 74.0 points.
Unlock Deck
Unlock for access to all 57 flashcards in this deck.
Unlock Deck
k this deck
47
The index of exposure to radioactive waste and the cancer mortality rates (deaths per 100,000)were recorded for nine different geographic regions.Use the regression analysis and summary statistics provided below to determine a 95% prediction interval for the cancer mortality rate of a county whose index of exposure is 5.93. Dependent variable is: Cancer Mortality Rate R-squared = 85.8%
S = 14.00993 with 9 - 2 = 7 degrees of freedom
A)134.2 to 204.7 deaths per 100,000
B)135.7 to 203.2 deaths per 100,000
C)166.1 to 172.8 deaths per 100,000
D)167.9 to 185.9 deaths per 100,000
E)157.5 to 181.4 deaths per 100,000
Dependent variable is: Cancer Mortality Rate R-squared = 85.8%S = 14.00993 with 9 - 2 = 7 degrees of freedom
A)134.2 to 204.7 deaths per 100,000
B)135.7 to 203.2 deaths per 100,000
C)166.1 to 172.8 deaths per 100,000
D)167.9 to 185.9 deaths per 100,000
E)157.5 to 181.4 deaths per 100,000
Unlock Deck
Unlock for access to all 57 flashcards in this deck.
Unlock Deck
k this deck
48
The index of exposure to radioactive waste and the cancer mortality rates (deaths per 100,000)were recorded for nine different geographic regions.Use the regression analysis and summary statistics provided below to determine a 95% confidence interval for the average cancer mortality rate of a county whose index of exposure is 6.81 Dependent variable is: Cancer Mortality Rate R-squared = 85.8%
S = 14.00993 with 9 - 2 = 7 degrees of freedom
A)164.3 to 190.9 deaths per 100,000
B)143.4 to 211.8 deaths per 100,000
C)174.2 to 180.9 deaths per 100,000
D)167.9 to 185.9 deaths per 100,000
E)141.8 to 213.3 deaths per 100,000
Dependent variable is: Cancer Mortality Rate R-squared = 85.8%S = 14.00993 with 9 - 2 = 7 degrees of freedom
A)164.3 to 190.9 deaths per 100,000
B)143.4 to 211.8 deaths per 100,000
C)174.2 to 180.9 deaths per 100,000
D)167.9 to 185.9 deaths per 100,000
E)141.8 to 213.3 deaths per 100,000
Unlock Deck
Unlock for access to all 57 flashcards in this deck.
Unlock Deck
k this deck
49
Consider a logistic regression model for the probability of a "success",given a quantitative variable X. Use the output above to estimate the probability of a success when X = 25.
A)0.1824
B)0.8176
C)0.2019
D)0.7981
E)0.2231
Use the output above to estimate the probability of a success when X = 25.A)0.1824
B)0.8176
C)0.2019
D)0.7981
E)0.2231
Unlock Deck
Unlock for access to all 57 flashcards in this deck.
Unlock Deck
k this deck
50
The index of exposure to radioactive waste and the cancer mortality rates (deaths per 100,000)were recorded for nine different geographic regions.A 95% prediction interval for the cancer mortality rate of a region whose index of exposure is 5.79 is 133.0 to 203.4 deaths per 100,000. Dependent variable is: Cancer Mortality Rate R-squared = 85.8%
S = 14.00993 with 9 - 2 = 7 degrees of freedom
A)Based on this regression,we are 95% confident that the index of exposure will increase between 133.0 and 203.4 for each unit increase in the cancer mortality rate over 5.79.
B)Based on this regression,we know that 95% of all random samples of regions will have a mean cancer mortality rate that is between 133.0 and 203.4 deaths per 100,000.
C)Based on this regression,we are 95% confident that a region with an index of exposure of 5.79 will have a cancer mortality rate that is between 133.0 and 203.4 deaths per 100,000.
D)Based on this regression,we are 95% confident that the mean cancer mortality rate will increase between 133.0 and 203.4 deaths per 100,000 for each unit increase in the index of exposure over 5.79.
E)Based on this regression,we are 95% confident that the mean cancer mortality rate for regions with an index of exposure of 5.79 will be between 133.0 and 203.4 deaths per 100,000.
Dependent variable is: Cancer Mortality Rate R-squared = 85.8%S = 14.00993 with 9 - 2 = 7 degrees of freedom
A)Based on this regression,we are 95% confident that the index of exposure will increase between 133.0 and 203.4 for each unit increase in the cancer mortality rate over 5.79.
B)Based on this regression,we know that 95% of all random samples of regions will have a mean cancer mortality rate that is between 133.0 and 203.4 deaths per 100,000.
C)Based on this regression,we are 95% confident that a region with an index of exposure of 5.79 will have a cancer mortality rate that is between 133.0 and 203.4 deaths per 100,000.
D)Based on this regression,we are 95% confident that the mean cancer mortality rate will increase between 133.0 and 203.4 deaths per 100,000 for each unit increase in the index of exposure over 5.79.
E)Based on this regression,we are 95% confident that the mean cancer mortality rate for regions with an index of exposure of 5.79 will be between 133.0 and 203.4 deaths per 100,000.
Unlock Deck
Unlock for access to all 57 flashcards in this deck.
Unlock Deck
k this deck
51
Consider a logistic regression model for the probability of a "success",given a quantitative variable X. Use the output above to estimate the probability of a success when X = 10.
A)0.0474
B)0.9526
C)0.0497
D)0.3333
E)0.9503
Use the output above to estimate the probability of a success when X = 10.A)0.0474
B)0.9526
C)0.0497
D)0.3333
E)0.9503
Unlock Deck
Unlock for access to all 57 flashcards in this deck.
Unlock Deck
k this deck
52
The index of exposure to radioactive waste and the cancer mortality rates (deaths per 100,000)were recorded for nine different geographic regions.A 95% confidence interval for the mean cancer mortality rate of all regions whose index of exposure is 6.57 was determined to be (162.5,188.2). Dependent variable is: Cancer Mortality Rate R-squared = 85.8%
S = 14.00993 with 9 - 2 = 7 degrees of freedom
A)Based on this regression,we are 95% confident that the mean index of exposure will increase between 162.5 and 188.2 points for each one-unit increase in the cancer mortality rate.
B)Based on this regression,95% of all random samples will have a mean cancer mortality rate between 162.5 and 188.2 deaths per 100,000.
C)With 95% confidence,the cancer mortality rate for a region with an index of exposure of 6.57 is between 162.5 and 188.2 deaths per 100,000,based on this regression.
D)Based on this regression,we are 95% confident that the mean cancer mortality rate will increase between 162.5 and 188.2 deaths per 100,000 for each one-unit increase in the index of exposure.
E)With 95% confidence,the mean cancer mortality rate for regions with an index of exposure of 6.57 is between 162.5 and 188.2 deaths per 100,000,based on this regression.
Dependent variable is: Cancer Mortality Rate R-squared = 85.8%S = 14.00993 with 9 - 2 = 7 degrees of freedom
A)Based on this regression,we are 95% confident that the mean index of exposure will increase between 162.5 and 188.2 points for each one-unit increase in the cancer mortality rate.
B)Based on this regression,95% of all random samples will have a mean cancer mortality rate between 162.5 and 188.2 deaths per 100,000.
C)With 95% confidence,the cancer mortality rate for a region with an index of exposure of 6.57 is between 162.5 and 188.2 deaths per 100,000,based on this regression.
D)Based on this regression,we are 95% confident that the mean cancer mortality rate will increase between 162.5 and 188.2 deaths per 100,000 for each one-unit increase in the index of exposure.
E)With 95% confidence,the mean cancer mortality rate for regions with an index of exposure of 6.57 is between 162.5 and 188.2 deaths per 100,000,based on this regression.
Unlock Deck
Unlock for access to all 57 flashcards in this deck.
Unlock Deck
k this deck
53
Applicants for a particular job,which involves extensive travel in Spanish-speaking countries,must take a proficiency test in Spanish.The sample data below were obtained in a study of the relationship between the numbers of years applicants have studied Spanish and their score on the test.A 95% confidence interval for the mean score of all applicants who have studied Spanish for 2.5 years was determined to be (53.0,64.6).Give an interpretation of this interval. Dependent variable is: Score R-squared = 83.0%
S = 5.65138 with 10 - 2 = 8 degrees of freedom
A)Based on this regression,we are 95% confident that applicants will score between 53.0 and 64.6 points higher on the proficiency test for each additional year spent studying Spanish.
B)Based on this regression,we are 95% confident that all applicants who have studied Spanish for 2.5 years will average between 53.0 and 64.6 points on the proficiency test.
C)Based on this regression,we are 95% confident an applicant who has studied Spanish for 2.5 years will score between 53.0 and 64.6 points on the proficiency test.
D)Based on this regression,95% of all random samples will have an average score between 53.0 and 64.6 points on the proficiency test.
E)Based on this regression,we are 95% confident that a randomly selected applicant who has studied Spanish for 2.5 years will score between 53.0 and 64.6 points on the proficiency test.
Dependent variable is: Score R-squared = 83.0%S = 5.65138 with 10 - 2 = 8 degrees of freedom
A)Based on this regression,we are 95% confident that applicants will score between 53.0 and 64.6 points higher on the proficiency test for each additional year spent studying Spanish.
B)Based on this regression,we are 95% confident that all applicants who have studied Spanish for 2.5 years will average between 53.0 and 64.6 points on the proficiency test.
C)Based on this regression,we are 95% confident an applicant who has studied Spanish for 2.5 years will score between 53.0 and 64.6 points on the proficiency test.
D)Based on this regression,95% of all random samples will have an average score between 53.0 and 64.6 points on the proficiency test.
E)Based on this regression,we are 95% confident that a randomly selected applicant who has studied Spanish for 2.5 years will score between 53.0 and 64.6 points on the proficiency test.
Unlock Deck
Unlock for access to all 57 flashcards in this deck.
Unlock Deck
k this deck
54
A grass seed company conducts a study to determine the relationship between the density of seeds planted (in pounds per 500 sq ft)and the quality of the resulting lawn.Eight similar plots of land are selected and each is planted with a particular density of seed.One month later the quality of each lawn is rated on a scale of 0 to 100.The regression analysis and summary statistics are given below.Determine a 99% confidence interval for the average lawn quality of a lawn sown with a seed density of 2.1. Dependent variable is: Lawn Quality R-squared = 36.0%
S = 9.073602 with 8 - 2 = 6 degrees of freedom
A)8.5 to 76.8
B)6.5 to 78.8
C)30.4 to 73.4
D)33.5 to 51.8
E)29.4 to 56.0
Dependent variable is: Lawn Quality R-squared = 36.0%S = 9.073602 with 8 - 2 = 6 degrees of freedom
A)8.5 to 76.8
B)6.5 to 78.8
C)30.4 to 73.4
D)33.5 to 51.8
E)29.4 to 56.0
Unlock Deck
Unlock for access to all 57 flashcards in this deck.
Unlock Deck
k this deck
55
The typing speeds (in words per minute)and reading speeds (in words per minute)of nine randomly selected secretaries were recorded.Use the regression analysis and summary statistics provided below to determine a 90% confidence interval for the average reading speed of a secretary whose typing speed is 71. Dependent variable is: Reading speed R-squared = 12.385%
S = 100.3348 with 9 - 2 = 7 degrees of freedom
A)330.4 to 747.3 words per minute
B)444.1 to 633.6 words per minute
C)532.2 to 545.5 words per minute
D)405.9 to 450.9 words per minute
E)326.4 to 751.3 words per minute
Dependent variable is: Reading speed R-squared = 12.385%S = 100.3348 with 9 - 2 = 7 degrees of freedom
A)330.4 to 747.3 words per minute
B)444.1 to 633.6 words per minute
C)532.2 to 545.5 words per minute
D)405.9 to 450.9 words per minute
E)326.4 to 751.3 words per minute
Unlock Deck
Unlock for access to all 57 flashcards in this deck.
Unlock Deck
k this deck
56
The typing speeds (in words per minute)and reading speeds (in words per minute)of nine randomly selected secretaries were recorded.Using a 10% level of significance,carry out a test to determine if the linear correlation is greater than 0.The regression analysis is given below.
Dependent variable is: Reading speed
R-squared = 12.385%
s = 100.3348 with 9 - 2 = 7 degrees of freedom
Dependent variable is: Reading speed
R-squared = 12.385%
s = 100.3348 with 9 - 2 = 7 degrees of freedom
Unlock Deck
Unlock for access to all 57 flashcards in this deck.
Unlock Deck
k this deck
57
Consider a logistic regression model for the probability of a "success",given a quantitative variable X. Use the output above to estimate the probability of a failure when X = 25.
A)0.1824
B)0.8176
C)0.2019
D)0.7981
E)0.2231
Use the output above to estimate the probability of a failure when X = 25.A)0.1824
B)0.8176
C)0.2019
D)0.7981
E)0.2231
Unlock Deck
Unlock for access to all 57 flashcards in this deck.
Unlock Deck
k this deck
Unlock Deck
Unlock for access to all 57 flashcards in this deck.


