Deck 21: Comparing Means
Full screen (f)
Question
Researchers wanted to compare the effectiveness of a water softener used with a filtering process with a water softener used without filtering.Ninety locations were randomly divided into two groups of equal size.Group A locations used a water softener and the filtering process,while group B used only the water softener.At the end of three months,the water was tested at each location for its level of softness.(Water softness was measured on a scale of 1 to 5,with 5 being the softest water.)The results were as follows.  mean = 2.1
standard deviation = 0.7 mean = 1.7
standard deviation = 0.4
Refer to the sample data to test whether there is a difference between the two types of treatments.Carry out the test with a 1% significance level.
mean = 2.1standard deviation = 0.7
mean = 1.7standard deviation = 0.4
Refer to the sample data to test whether there is a difference between the two types of treatments.Carry out the test with a 1% significance level.
Question
Two types of flares were tested for their burning times (in minutes).Sample results are given below. 
 n = 35 n = 40
  = 19.4
  = 15.1
s = 1.4 s = 0.8
Refer to the sample data to test the claim that the two populations have unequal means.Carry out the test with a 1% significance level.
n = 35 n = 40 = 19.4 = 15.1s = 1.4 s = 0.8
Refer to the sample data to test the claim that the two populations have unequal means.Carry out the test with a 1% significance level.
Question
A researcher was interested in comparing the salaries of female and male employees of a particular company.Independent random samples of female employees (sample 1)and male employees (sample 2)were taken to calculate the mean salary,in dollars per week,for each group.A 98% confidence interval for the difference,  between the mean weekly salary of all female employees and the mean weekly salary of all male employees was determined to be
A)Based on these data,we are 98% confident that male employees at this company average between $180 less and $40 more per week than the female employees.
B)We are 98% confident that a randomly selected female employee at this company makes between $180 less and $40 more per week than a randomly selected male employee.
C)Based on these data,we know that 98% of female employees at this company make between $180 less and $40 more than the male employees.
D)We know that 98% of all random samples of employees at this company will show that the average female salary is between $180 less and $40 more per week than the average male salary.
E)With 98% confidence,we can say that female employees at this company average between $180 less and $40 more per week than the male employees.
between the mean weekly salary of all female employees and the mean weekly salary of all male employees was determined to be A)Based on these data,we are 98% confident that male employees at this company average between $180 less and $40 more per week than the female employees.
B)We are 98% confident that a randomly selected female employee at this company makes between $180 less and $40 more per week than a randomly selected male employee.
C)Based on these data,we know that 98% of female employees at this company make between $180 less and $40 more than the male employees.
D)We know that 98% of all random samples of employees at this company will show that the average female salary is between $180 less and $40 more per week than the average male salary.
E)With 98% confidence,we can say that female employees at this company average between $180 less and $40 more per week than the male employees.
Question
A researcher was interested in comparing the GPAs of students at the University of Toronto Scarborough and Mississauga campuses.Independent random samples of 8 students from the Scarborough campus and 13 students from the Mississauga campus yielded the following GPAs. 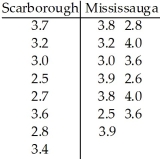 Determine a 95% confidence interval for the difference,
  between the mean GPA of all students at the Scarborough campus and the mean GPA of all students at the Mississauga campus.
A)(-0.70,0.05)
B)(-0.81,0.15)
C)(-0.75,0.10)
D)(-0.13,0.78)
E)(-0.78,0.13)
Determine a 95% confidence interval for the difference, between the mean GPA of all students at the Scarborough campus and the mean GPA of all students at the Mississauga campus.A)(-0.70,0.05)
B)(-0.81,0.15)
C)(-0.75,0.10)
D)(-0.13,0.78)
E)(-0.78,0.13)
Question
The data below show the number of tornadoes spotted in a midwestern state in the U.S.A.annually before and after 1960.A researcher wants to determine whether there has been a change in the frequency of tornadoes in this state. 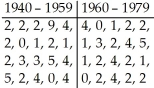
Question
Question
A researcher wishes to determine whether people with high blood pressure can reduce their blood pressure by following a particular diet.Use the sample data below to construct a 99% confidence interval for  -
-  ,where
  and
and  represent the population means for the treatment group and the control group,respectively.
 n1 = 85 n2 = 75
  = 189.1
  = 203.7 s1 = 38.7 s2 = 39.2
A)(-1.5,30.7)
B)(-1.3,30.5)
C)(-29.0,-0.2)
D)(-26.8,-2.4)
E)(-30.7,1.5)
- ,where and represent the population means for the treatment group and the control group,respectively. n1 = 85 n2 = 75 = 189.1 = 203.7 s1 = 38.7 s2 = 39.2A)(-1.5,30.7)
B)(-1.3,30.5)
C)(-29.0,-0.2)
D)(-26.8,-2.4)
E)(-30.7,1.5)
Question
A researcher was interested in comparing the salaries of female and male employees of a particular company.Independent random samples of 8 female employees (sample 1)and 15 male employees (sample 2)yielded the following weekly salaries (in dollars). 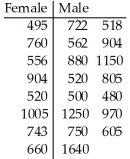 Determine a 98% confidence interval for the difference,
  between the mean weekly salary of all female employees and the mean weekly salary of all male employees.
A)(-$335,$111)
B)(-$158,$382)
C)(-$383,$159)
D)(-$431,$208)
E)(-$385,$164)
Determine a 98% confidence interval for the difference, between the mean weekly salary of all female employees and the mean weekly salary of all male employees.A)(-$335,$111)
B)(-$158,$382)
C)(-$383,$159)
D)(-$431,$208)
E)(-$385,$164)
Question
A researcher wishes to determine whether people with high blood pressure can reduce their blood pressure by following a particular diet.Subjects were randomly assigned to a treatment group and a control group.The mean blood pressure was determined for each group,and a 90% confidence interval for the difference in the mean between the treatment group and the control group,  was found to be (-26,-6).
A)We are 90% confident that a randomly selected subject in the treatment group had a blood pressure between 6 and 26 points lower than a randomly selected subject in the control group.
B)We are confident that 90% of all people who follow the particular diet will have a blood pressure between 6 and 26 points lower than people who do not follow the diet.
C)We know with 90% confidence that people who follow the diet have an average blood pressure between 6 and 26 points lower than people who do not follow the diet.
D)We know with 90% confidence that people who follow the diet have an average blood pressure between 6 and 26 points higher than people who do not follow the diet.
E)We know that 90% of all experiments done on the population will show that the average blood pressure for people who follow the diet is between 6 and 26 points lower than the average blood pressure for people who do not follow the diet.
was found to be (-26,-6).A)We are 90% confident that a randomly selected subject in the treatment group had a blood pressure between 6 and 26 points lower than a randomly selected subject in the control group.
B)We are confident that 90% of all people who follow the particular diet will have a blood pressure between 6 and 26 points lower than people who do not follow the diet.
C)We know with 90% confidence that people who follow the diet have an average blood pressure between 6 and 26 points lower than people who do not follow the diet.
D)We know with 90% confidence that people who follow the diet have an average blood pressure between 6 and 26 points higher than people who do not follow the diet.
E)We know that 90% of all experiments done on the population will show that the average blood pressure for people who follow the diet is between 6 and 26 points lower than the average blood pressure for people who do not follow the diet.
Question
The owner of a large apartment complex had an in-ground swimming pool installed in an effort to increase tenant satisfaction.Nine tenants were randomly selected to complete a questionnaire that assessed their level of satisfaction with the apartment complex.Their scores before and after the installation of the pool are shown.The owner wants to assess the effectiveness of the pool in increasing tenant satisfaction. 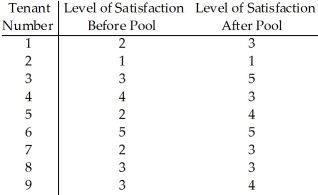
Question
A researcher was interested in comparing the number of hours of television watched each day by two-year-olds and three-year-olds.A random sample of 18 two-year-olds and 18 three-year-olds yielded the follow data. 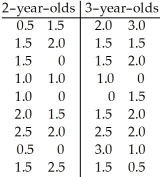 Find a 95% confidence interval for the difference,
  -
-  ,between the mean number of hours for two-year-olds and the mean number of hours for three-year-olds.
A)(-0.87,0.26)
B)(1.25,1.56)
C)(-0.87,-0.26)
D)(-1.56,-1.25)
E)(-0.26,0.87)
Find a 95% confidence interval for the difference, - ,between the mean number of hours for two-year-olds and the mean number of hours for three-year-olds.A)(-0.87,0.26)
B)(1.25,1.56)
C)(-0.87,-0.26)
D)(-1.56,-1.25)
E)(-0.26,0.87)
Question
A grocery store is interested in determining whether or not a difference exists between the shelf life of Tasty Choice doughnuts and Sugar Twist doughnuts.A random sample of 100 boxes of each brand was selected and the mean shelf life in days was determined for each brand.A 98% confidence interval for the difference of the means,  -
-  ,was determined to be (1.1,2.8).
A)We are 98% confident that a randomly selected box of Tasty Choice doughnuts will have a shelf life that is between 1.1 and 2.8 days longer than a randomly selected box of Sugar Twist doughnuts.
B)Based on this sample,we are 98% confident that Sugar Twist doughnuts will last on average between 1.1 and 2.8 days longer than Tasty Choice doughnuts.
C)Based on this sample,we are 98% confident that Tasty Choice doughnuts will last on average between 1.1 and 2.8 days longer than Sugar Twist doughnuts.
D)Based on this sample,we know that 98% of Tasty Choice doughnuts last between 1.1 and 2.8 days longer than Sugar Twist doughnuts.
E)We know that 98% of all random samples taken from the population will show that the mean shelf life of Tasty Choice doughnuts is between 1.1 and 2.8 days longer than the mean shelf life of Sugar Twist doughnuts.
- ,was determined to be (1.1,2.8).A)We are 98% confident that a randomly selected box of Tasty Choice doughnuts will have a shelf life that is between 1.1 and 2.8 days longer than a randomly selected box of Sugar Twist doughnuts.
B)Based on this sample,we are 98% confident that Sugar Twist doughnuts will last on average between 1.1 and 2.8 days longer than Tasty Choice doughnuts.
C)Based on this sample,we are 98% confident that Tasty Choice doughnuts will last on average between 1.1 and 2.8 days longer than Sugar Twist doughnuts.
D)Based on this sample,we know that 98% of Tasty Choice doughnuts last between 1.1 and 2.8 days longer than Sugar Twist doughnuts.
E)We know that 98% of all random samples taken from the population will show that the mean shelf life of Tasty Choice doughnuts is between 1.1 and 2.8 days longer than the mean shelf life of Sugar Twist doughnuts.
Question
The table below gives information concerning the gasoline mileage for random samples of trucks of two different types.Find a 95% confidence interval for the difference in the means  -
-  .
. 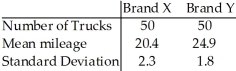
A)(3.68,5.32)
B)(-5,-4)
C)(4,5)
D)(-5.32,-3.68)
E)(20.4,24.9)
- . A)(3.68,5.32)
B)(-5,-4)
C)(4,5)
D)(-5.32,-3.68)
E)(20.4,24.9)
Question
A grocery store manager is interested in determining whether or not a difference exists between the shelf life of two different brands of doughnuts.A random sample of 100 boxes of each brand was selected and the shelf life in days was determined for each box.The sample results are given below. 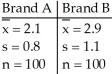 Find a 98% confidence interval for
  -
-  ,that is,the difference in mean shelf life between Brand A and Brand B.
A)(-0.02,1.62)
B)(-1.12,-0.48)
C)(0.48,1.12)
D)(2.1,2.9)
E)(-1.62,0.02)
Find a 98% confidence interval for - ,that is,the difference in mean shelf life between Brand A and Brand B.A)(-0.02,1.62)
B)(-1.12,-0.48)
C)(0.48,1.12)
D)(2.1,2.9)
E)(-1.62,0.02)
Question
Two types of flares are tested for their burning times (in minutes)and sample results are given below. 
 n = 35 n = 40
  = 19.4
  = 15.1 s = 1.4 s = 0.8
Construct a 95% confidence interval for the difference -
-  based on the sample data.
A)(3.5,5.1)
B)(3.8,4.8)
C)(3.6,5.0)
D)(-4.7,-3.9)
E)(3.2,5.4)
n = 35 n = 40 = 19.4 = 15.1 s = 1.4 s = 0.8Construct a 95% confidence interval for the difference
- based on the sample data.A)(3.5,5.1)
B)(3.8,4.8)
C)(3.6,5.0)
D)(-4.7,-3.9)
E)(3.2,5.4)
Question
A consumer advocate decided to investigate the average wait time for a table for one at two local restaurants.Eighteen customers were sent to each restaurant at the same randomly selected times and the times they waited for a table were recorded in minutes.The following sample data was obtained. 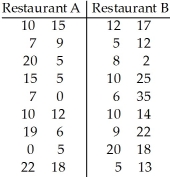 Find a 95% confidence interval for the difference,
  -
-  ,between the mean wait time at Restaurant A and the mean wait time at Restaurant B.
A)(-8.3,1.86)
B)(-1.86,8.3)
C)(-8.3,-1.86)
D)(-13.5,-10.28)
E)(10.28,13.5)
Find a 95% confidence interval for the difference, - ,between the mean wait time at Restaurant A and the mean wait time at Restaurant B.A)(-8.3,1.86)
B)(-1.86,8.3)
C)(-8.3,-1.86)
D)(-13.5,-10.28)
E)(10.28,13.5)
Question
A researcher was interested in comparing the salaries of female and male employees of a particular large company.Independent random samples of 8 female employees (sample 1)and 15 male employees (sample 2)yielded the following weekly salaries (in dollars). 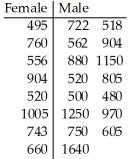
Question
A researcher was interested in comparing the heights of women in two different countries.Independent random samples of 9 women from country A and 9 women from country B yielded the following heights (in centimetres). 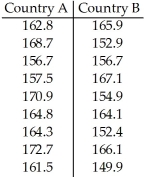 Determine a 90% confidence interval for the difference,
  -
-  ,between the mean height of women in Country A and the mean height of women in Country B.
A)(0.4,10.7)
B)(1.4,9.2)
C)(0.8,14.2)
D)(161.4,164.3)
E)(0.7,4.2)
Determine a 90% confidence interval for the difference, - ,between the mean height of women in Country A and the mean height of women in Country B.A)(0.4,10.7)
B)(1.4,9.2)
C)(0.8,14.2)
D)(161.4,164.3)
E)(0.7,4.2)
Question
130 Brand X oil filters and 93 Brand Y oil filters were tested for milligrams of residue,with the following results.Find a 95% confidence interval for  -
-  .
. 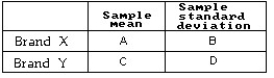 A = 4.3 B = 0.13 C = 5.7 D = 0.11
A)(-1.44,1.43)
B)(-1.43,-1.37)
C)(-1.44,-1.36)
D)(0.97,1.83)
E)(1.37,1.43)
- . A = 4.3 B = 0.13 C = 5.7 D = 0.11A)(-1.44,1.43)
B)(-1.43,-1.37)
C)(-1.44,-1.36)
D)(0.97,1.83)
E)(1.37,1.43)
Question
Two machines are being considered to weigh luggage at an airport.A standard 30 kg weight is used to test the machines.Sample weigh-ins were taken from each machine and the following results were obtained. 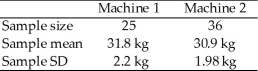 At the 0.02 level of significance,test the claim that the population mean for Machine 1 is different from the population mean for Machine 2.
At the 0.02 level of significance,test the claim that the population mean for Machine 1 is different from the population mean for Machine 2. Question
Question
A researcher was interested in comparing the GPAs of students at the University of Toronto Scarborough and Mississauga campuses.Independent random samples of 8 students from the Scarborough campus and 13 students from the Mississauga campus yielded the following GPAs. 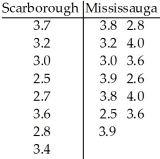 Do the data provide sufficient evidence to conclude that the mean GPA of students at the Scarborough campus differs from the mean GPA of students at the Mississauga campus? Perform a t-test at the 10% significance level.
Do the data provide sufficient evidence to conclude that the mean GPA of students at the Scarborough campus differs from the mean GPA of students at the Mississauga campus? Perform a t-test at the 10% significance level. Question
A researcher wishes to determine whether people with high blood pressure can reduce their blood pressure by following a particular diet.Use the sample data below to test the claim that the treatment population mean μ1 is smaller than the control population mean μ2.Test the claim using a significance level of 0.01. 
 n1 = 85 n2 = 75
  = 189.1
  = 203.7
s1 = 38.7 s2 = 39.2
df = 155.
n1 = 85 n2 = 75 = 189.1 = 203.7s1 = 38.7 s2 = 39.2
df = 155.
Question
A paint manufacturer wishes to compare the drying times of two different types of paint.Independent random samples of 11 cans of type A and 9 cans of type B were selected and applied to similar surfaces.The drying times (in minutes)were recorded.The summary statistics are as follows. 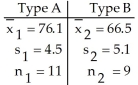 Do the data provide sufficient evidence to conclude that the mean drying time for type A differs from the mean drying time for type B? Perform a
  at the 1% significance level.
Do the data provide sufficient evidence to conclude that the mean drying time for type A differs from the mean drying time for type B? Perform a at the 1% significance level. Question
Question
When testing for a difference between the means of a treated population and an untreated population,the computer display below is obtained.Explain what the P-Value of 0.0316 means in this context. 
Question
When testing the difference between the means of a treatment group and a placebo group,the computer display below is obtained.Using a 0.05 significance level,is there sufficient evidence to support the claim that the treatment group (variable 1)represents a population whose mean is different from the mean for the untreated population? Explain. 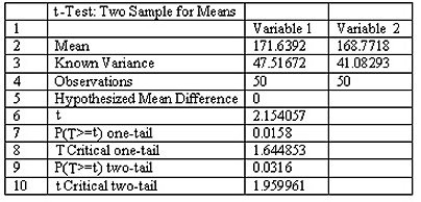
Question
A researcher was interested in comparing the salaries of female and male employees of a particular company.Independent random samples of 8 female employees (sample 1)and 15 male employees (sample 2)yielded the following weekly salaries (in dollars).  Do the data provide sufficient evidence to conclude that the mean salary of women at this company is less than the mean salary of men at the company? Perform a
  at the 5% significance level.
Do the data provide sufficient evidence to conclude that the mean salary of women at this company is less than the mean salary of men at the company? Perform a at the 5% significance level. Question
Question
Two types of flares were tested for their burning times (in minutes).Sample results are given below. 
 n = 35 n = 40
  = 19.4
  = 15.1
s = 1.4 s = 0.8
df = 52
Refer to the sample data to test the claim that the two populations have unequal means..Carry out the test with a 1% significance level.
n = 35 n = 40 = 19.4 = 15.1s = 1.4 s = 0.8
df = 52
Refer to the sample data to test the claim that the two populations have unequal means..Carry out the test with a 1% significance level.
Question
Question
A researcher wishes to determine whether people with high blood pressure can reduce their blood pressure by following a particular diet.Use the sample data below to test the claim that the treatment population mean μ1 is smaller than the control population mean μ2.Test the claim using a significance level of 0.01. 
 n1 = 85 n2 = 75
  = 189.1
  = 203.7
s1 = 38.7 s2 = 39.2
n1 = 85 n2 = 75 = 189.1 = 203.7s1 = 38.7 s2 = 39.2
Question
When testing for a difference between the means of a treated population and an untreated population,the computer display below is obtained.Explain what the P-value of 0.0768 means in this context. 
Question
When testing the difference between the means of a treatment group and a placebo group,the computer display below is obtained.Using a 0.05 significance level,is there sufficient evidence to support the claim that the treatment group (variable 1)represents a population whose mean is less than the mean for the untreated population? Explain. 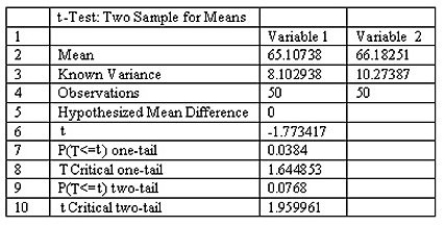
Question
A researcher was interested in comparing the amount of time spent watching television by women and by men.Independent random samples of 14 women and 17 men were selected and each person was asked how many hours he or she had watched television during the previous week.The summary statistics are as follows. 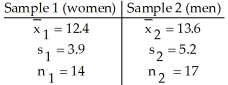 Do the data provide sufficient evidence to conclude that the mean time for women is less than the mean time for men? Perform a t-test at the 5% significance level.
Do the data provide sufficient evidence to conclude that the mean time for women is less than the mean time for men? Perform a t-test at the 5% significance level. Question
Two machines are being considered to weigh luggage at an airport.A standard 30 kg weight is used to test the machines.Sample weigh-ins were taken from each machine and the following results were obtained.  df = 48.
At the 0.02 level of significance,test the claim that the population mean for Machine 1 is different from the population mean for Machine 2.
df = 48.At the 0.02 level of significance,test the claim that the population mean for Machine 1 is different from the population mean for Machine 2.
Question
When testing the difference between the means of a treatment group and a placebo group,the computer display below is obtained.Using a 0.01 significance level,is there sufficient evidence to support the claim that the treatment group (variable 1)represents a population whose mean is greater than the mean for the untreated population? Explain. 
Question
Question
Question
When testing the difference between the means of a treatment group and a placebo group,the computer display below is obtained.Using a 0.05 significance level,is there sufficient evidence to support the claim that the treatment group (variable 1)represents a population whose mean is different from the mean for the untreated population? Explain. 
Question
Question
Two machines are being considered to weigh luggage at an airport.A standard 30 kg weight is used to test the machines.Sample weigh-ins were taken from each machine and the following results were obtained. 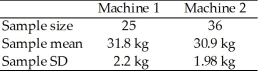 At the 0.02 level of significance,test the claim that the population mean for Machine 1 is different from the population mean for Machine 2.Carry out the test assuming the population variances are equal.
At the 0.02 level of significance,test the claim that the population mean for Machine 1 is different from the population mean for Machine 2.Carry out the test assuming the population variances are equal. Question
Question
Question
Question
Question
Question
Question
Question

Unlock Deck
Sign up to unlock the cards in this deck!
Unlock Deck
Unlock Deck
1/50
Play
Full screen (f)
Deck 21: Comparing Means
1
Researchers wanted to compare the effectiveness of a water softener used with a filtering process with a water softener used without filtering.Ninety locations were randomly divided into two groups of equal size.Group A locations used a water softener and the filtering process,while group B used only the water softener.At the end of three months,the water was tested at each location for its level of softness.(Water softness was measured on a scale of 1 to 5,with 5 being the softest water.)The results were as follows. mean = 2.1
standard deviation = 0.7 mean = 1.7
standard deviation = 0.4
Refer to the sample data to test whether there is a difference between the two types of treatments.Carry out the test with a 1% significance level.
mean = 2.1standard deviation = 0.7
mean = 1.7standard deviation = 0.4
Refer to the sample data to test whether there is a difference between the two types of treatments.Carry out the test with a 1% significance level.
H0: μ1 - μ2 = 0 HA: μ1 - μ2 ≠ 0 Test statistic t = 3.328,P-value = 0.0014,DF = 69.97 Reject the null hypothesis.There is sufficient evidence to support the claim that there is a difference between the two types of treatments.Based on these data,it appears that the water softener and filtering process resulted in higher mean water softness.
2
Two types of flares were tested for their burning times (in minutes).Sample results are given below. n = 35 n = 40 = 19.4 = 15.1
s = 1.4 s = 0.8
Refer to the sample data to test the claim that the two populations have unequal means.Carry out the test with a 1% significance level.
n = 35 n = 40 = 19.4 = 15.1s = 1.4 s = 0.8
Refer to the sample data to test the claim that the two populations have unequal means.Carry out the test with a 1% significance level.
H0: μ1 - μ2 = 0 HA: μ1 - μ2 ≠ 0 Test statistic t = 16.025,P-value = 9.2162 ×  ,DF = 52.5 Reject the null hypothesis.There is strong evidence that the two types of flares have different mean burn times.Based on these data,it appears that Brand X flares have longer burning times than Brand Y flares on average.
,DF = 52.5 Reject the null hypothesis.There is strong evidence that the two types of flares have different mean burn times.Based on these data,it appears that Brand X flares have longer burning times than Brand Y flares on average. 3
A researcher was interested in comparing the salaries of female and male employees of a particular company.Independent random samples of female employees (sample 1)and male employees (sample 2)were taken to calculate the mean salary,in dollars per week,for each group.A 98% confidence interval for the difference, between the mean weekly salary of all female employees and the mean weekly salary of all male employees was determined to be
A)Based on these data,we are 98% confident that male employees at this company average between $180 less and $40 more per week than the female employees.
B)We are 98% confident that a randomly selected female employee at this company makes between $180 less and $40 more per week than a randomly selected male employee.
C)Based on these data,we know that 98% of female employees at this company make between $180 less and $40 more than the male employees.
D)We know that 98% of all random samples of employees at this company will show that the average female salary is between $180 less and $40 more per week than the average male salary.
E)With 98% confidence,we can say that female employees at this company average between $180 less and $40 more per week than the male employees.
between the mean weekly salary of all female employees and the mean weekly salary of all male employees was determined to be A)Based on these data,we are 98% confident that male employees at this company average between $180 less and $40 more per week than the female employees.
B)We are 98% confident that a randomly selected female employee at this company makes between $180 less and $40 more per week than a randomly selected male employee.
C)Based on these data,we know that 98% of female employees at this company make between $180 less and $40 more than the male employees.
D)We know that 98% of all random samples of employees at this company will show that the average female salary is between $180 less and $40 more per week than the average male salary.
E)With 98% confidence,we can say that female employees at this company average between $180 less and $40 more per week than the male employees.
With 98% confidence,we can say that female employees at this company average between $180 less and $40 more per week than the male employees.
4
A researcher was interested in comparing the GPAs of students at the University of Toronto Scarborough and Mississauga campuses.Independent random samples of 8 students from the Scarborough campus and 13 students from the Mississauga campus yielded the following GPAs. Determine a 95% confidence interval for the difference, between the mean GPA of all students at the Scarborough campus and the mean GPA of all students at the Mississauga campus.
A)(-0.70,0.05)
B)(-0.81,0.15)
C)(-0.75,0.10)
D)(-0.13,0.78)
E)(-0.78,0.13)
Determine a 95% confidence interval for the difference, between the mean GPA of all students at the Scarborough campus and the mean GPA of all students at the Mississauga campus.A)(-0.70,0.05)
B)(-0.81,0.15)
C)(-0.75,0.10)
D)(-0.13,0.78)
E)(-0.78,0.13)
Unlock Deck
Unlock for access to all 50 flashcards in this deck.
Unlock Deck
k this deck
5
The data below show the number of tornadoes spotted in a midwestern state in the U.S.A.annually before and after 1960.A researcher wants to determine whether there has been a change in the frequency of tornadoes in this state.
Unlock Deck
Unlock for access to all 50 flashcards in this deck.
Unlock Deck
k this deck
6
A study was conducted to determine which taxi company gives quicker service.Companies A and B were each called at 50 randomly selected times.The response times were recorded.The results were as follows.
Company A Company B
Mean response time 7.6 minutes 6.9 minutes
Standard deviation 1.4 minutes 1.7 minutes
Company A Company B
Mean response time 7.6 minutes 6.9 minutes
Standard deviation 1.4 minutes 1.7 minutes
Unlock Deck
Unlock for access to all 50 flashcards in this deck.
Unlock Deck
k this deck
7
A researcher wishes to determine whether people with high blood pressure can reduce their blood pressure by following a particular diet.Use the sample data below to construct a 99% confidence interval for - ,where and represent the population means for the treatment group and the control group,respectively. n1 = 85 n2 = 75 = 189.1 = 203.7 s1 = 38.7 s2 = 39.2
A)(-1.5,30.7)
B)(-1.3,30.5)
C)(-29.0,-0.2)
D)(-26.8,-2.4)
E)(-30.7,1.5)
- ,where and represent the population means for the treatment group and the control group,respectively. n1 = 85 n2 = 75 = 189.1 = 203.7 s1 = 38.7 s2 = 39.2A)(-1.5,30.7)
B)(-1.3,30.5)
C)(-29.0,-0.2)
D)(-26.8,-2.4)
E)(-30.7,1.5)
Unlock Deck
Unlock for access to all 50 flashcards in this deck.
Unlock Deck
k this deck
8
A researcher was interested in comparing the salaries of female and male employees of a particular company.Independent random samples of 8 female employees (sample 1)and 15 male employees (sample 2)yielded the following weekly salaries (in dollars). Determine a 98% confidence interval for the difference, between the mean weekly salary of all female employees and the mean weekly salary of all male employees.
A)(-$335,$111)
B)(-$158,$382)
C)(-$383,$159)
D)(-$431,$208)
E)(-$385,$164)
Determine a 98% confidence interval for the difference, between the mean weekly salary of all female employees and the mean weekly salary of all male employees.A)(-$335,$111)
B)(-$158,$382)
C)(-$383,$159)
D)(-$431,$208)
E)(-$385,$164)
Unlock Deck
Unlock for access to all 50 flashcards in this deck.
Unlock Deck
k this deck
9
A researcher wishes to determine whether people with high blood pressure can reduce their blood pressure by following a particular diet.Subjects were randomly assigned to a treatment group and a control group.The mean blood pressure was determined for each group,and a 90% confidence interval for the difference in the mean between the treatment group and the control group, was found to be (-26,-6).
A)We are 90% confident that a randomly selected subject in the treatment group had a blood pressure between 6 and 26 points lower than a randomly selected subject in the control group.
B)We are confident that 90% of all people who follow the particular diet will have a blood pressure between 6 and 26 points lower than people who do not follow the diet.
C)We know with 90% confidence that people who follow the diet have an average blood pressure between 6 and 26 points lower than people who do not follow the diet.
D)We know with 90% confidence that people who follow the diet have an average blood pressure between 6 and 26 points higher than people who do not follow the diet.
E)We know that 90% of all experiments done on the population will show that the average blood pressure for people who follow the diet is between 6 and 26 points lower than the average blood pressure for people who do not follow the diet.
was found to be (-26,-6).A)We are 90% confident that a randomly selected subject in the treatment group had a blood pressure between 6 and 26 points lower than a randomly selected subject in the control group.
B)We are confident that 90% of all people who follow the particular diet will have a blood pressure between 6 and 26 points lower than people who do not follow the diet.
C)We know with 90% confidence that people who follow the diet have an average blood pressure between 6 and 26 points lower than people who do not follow the diet.
D)We know with 90% confidence that people who follow the diet have an average blood pressure between 6 and 26 points higher than people who do not follow the diet.
E)We know that 90% of all experiments done on the population will show that the average blood pressure for people who follow the diet is between 6 and 26 points lower than the average blood pressure for people who do not follow the diet.
Unlock Deck
Unlock for access to all 50 flashcards in this deck.
Unlock Deck
k this deck
10
The owner of a large apartment complex had an in-ground swimming pool installed in an effort to increase tenant satisfaction.Nine tenants were randomly selected to complete a questionnaire that assessed their level of satisfaction with the apartment complex.Their scores before and after the installation of the pool are shown.The owner wants to assess the effectiveness of the pool in increasing tenant satisfaction.
Unlock Deck
Unlock for access to all 50 flashcards in this deck.
Unlock Deck
k this deck
11
A researcher was interested in comparing the number of hours of television watched each day by two-year-olds and three-year-olds.A random sample of 18 two-year-olds and 18 three-year-olds yielded the follow data. Find a 95% confidence interval for the difference, - ,between the mean number of hours for two-year-olds and the mean number of hours for three-year-olds.
A)(-0.87,0.26)
B)(1.25,1.56)
C)(-0.87,-0.26)
D)(-1.56,-1.25)
E)(-0.26,0.87)
Find a 95% confidence interval for the difference, - ,between the mean number of hours for two-year-olds and the mean number of hours for three-year-olds.A)(-0.87,0.26)
B)(1.25,1.56)
C)(-0.87,-0.26)
D)(-1.56,-1.25)
E)(-0.26,0.87)
Unlock Deck
Unlock for access to all 50 flashcards in this deck.
Unlock Deck
k this deck
12
A grocery store is interested in determining whether or not a difference exists between the shelf life of Tasty Choice doughnuts and Sugar Twist doughnuts.A random sample of 100 boxes of each brand was selected and the mean shelf life in days was determined for each brand.A 98% confidence interval for the difference of the means, - ,was determined to be (1.1,2.8).
A)We are 98% confident that a randomly selected box of Tasty Choice doughnuts will have a shelf life that is between 1.1 and 2.8 days longer than a randomly selected box of Sugar Twist doughnuts.
B)Based on this sample,we are 98% confident that Sugar Twist doughnuts will last on average between 1.1 and 2.8 days longer than Tasty Choice doughnuts.
C)Based on this sample,we are 98% confident that Tasty Choice doughnuts will last on average between 1.1 and 2.8 days longer than Sugar Twist doughnuts.
D)Based on this sample,we know that 98% of Tasty Choice doughnuts last between 1.1 and 2.8 days longer than Sugar Twist doughnuts.
E)We know that 98% of all random samples taken from the population will show that the mean shelf life of Tasty Choice doughnuts is between 1.1 and 2.8 days longer than the mean shelf life of Sugar Twist doughnuts.
- ,was determined to be (1.1,2.8).A)We are 98% confident that a randomly selected box of Tasty Choice doughnuts will have a shelf life that is between 1.1 and 2.8 days longer than a randomly selected box of Sugar Twist doughnuts.
B)Based on this sample,we are 98% confident that Sugar Twist doughnuts will last on average between 1.1 and 2.8 days longer than Tasty Choice doughnuts.
C)Based on this sample,we are 98% confident that Tasty Choice doughnuts will last on average between 1.1 and 2.8 days longer than Sugar Twist doughnuts.
D)Based on this sample,we know that 98% of Tasty Choice doughnuts last between 1.1 and 2.8 days longer than Sugar Twist doughnuts.
E)We know that 98% of all random samples taken from the population will show that the mean shelf life of Tasty Choice doughnuts is between 1.1 and 2.8 days longer than the mean shelf life of Sugar Twist doughnuts.
Unlock Deck
Unlock for access to all 50 flashcards in this deck.
Unlock Deck
k this deck
13
The table below gives information concerning the gasoline mileage for random samples of trucks of two different types.Find a 95% confidence interval for the difference in the means - .
A)(3.68,5.32)
B)(-5,-4)
C)(4,5)
D)(-5.32,-3.68)
E)(20.4,24.9)
- . A)(3.68,5.32)
B)(-5,-4)
C)(4,5)
D)(-5.32,-3.68)
E)(20.4,24.9)
Unlock Deck
Unlock for access to all 50 flashcards in this deck.
Unlock Deck
k this deck
14
A grocery store manager is interested in determining whether or not a difference exists between the shelf life of two different brands of doughnuts.A random sample of 100 boxes of each brand was selected and the shelf life in days was determined for each box.The sample results are given below. Find a 98% confidence interval for - ,that is,the difference in mean shelf life between Brand A and Brand B.
A)(-0.02,1.62)
B)(-1.12,-0.48)
C)(0.48,1.12)
D)(2.1,2.9)
E)(-1.62,0.02)
Find a 98% confidence interval for - ,that is,the difference in mean shelf life between Brand A and Brand B.A)(-0.02,1.62)
B)(-1.12,-0.48)
C)(0.48,1.12)
D)(2.1,2.9)
E)(-1.62,0.02)
Unlock Deck
Unlock for access to all 50 flashcards in this deck.
Unlock Deck
k this deck
15
Two types of flares are tested for their burning times (in minutes)and sample results are given below. n = 35 n = 40 = 19.4 = 15.1 s = 1.4 s = 0.8
Construct a 95% confidence interval for the difference - based on the sample data.
A)(3.5,5.1)
B)(3.8,4.8)
C)(3.6,5.0)
D)(-4.7,-3.9)
E)(3.2,5.4)
n = 35 n = 40 = 19.4 = 15.1 s = 1.4 s = 0.8Construct a 95% confidence interval for the difference
- based on the sample data.A)(3.5,5.1)
B)(3.8,4.8)
C)(3.6,5.0)
D)(-4.7,-3.9)
E)(3.2,5.4)
Unlock Deck
Unlock for access to all 50 flashcards in this deck.
Unlock Deck
k this deck
16
A consumer advocate decided to investigate the average wait time for a table for one at two local restaurants.Eighteen customers were sent to each restaurant at the same randomly selected times and the times they waited for a table were recorded in minutes.The following sample data was obtained. Find a 95% confidence interval for the difference, - ,between the mean wait time at Restaurant A and the mean wait time at Restaurant B.
A)(-8.3,1.86)
B)(-1.86,8.3)
C)(-8.3,-1.86)
D)(-13.5,-10.28)
E)(10.28,13.5)
Find a 95% confidence interval for the difference, - ,between the mean wait time at Restaurant A and the mean wait time at Restaurant B.A)(-8.3,1.86)
B)(-1.86,8.3)
C)(-8.3,-1.86)
D)(-13.5,-10.28)
E)(10.28,13.5)
Unlock Deck
Unlock for access to all 50 flashcards in this deck.
Unlock Deck
k this deck
17
A researcher was interested in comparing the salaries of female and male employees of a particular large company.Independent random samples of 8 female employees (sample 1)and 15 male employees (sample 2)yielded the following weekly salaries (in dollars).
Unlock Deck
Unlock for access to all 50 flashcards in this deck.
Unlock Deck
k this deck
18
A researcher was interested in comparing the heights of women in two different countries.Independent random samples of 9 women from country A and 9 women from country B yielded the following heights (in centimetres). Determine a 90% confidence interval for the difference, - ,between the mean height of women in Country A and the mean height of women in Country B.
A)(0.4,10.7)
B)(1.4,9.2)
C)(0.8,14.2)
D)(161.4,164.3)
E)(0.7,4.2)
Determine a 90% confidence interval for the difference, - ,between the mean height of women in Country A and the mean height of women in Country B.A)(0.4,10.7)
B)(1.4,9.2)
C)(0.8,14.2)
D)(161.4,164.3)
E)(0.7,4.2)
Unlock Deck
Unlock for access to all 50 flashcards in this deck.
Unlock Deck
k this deck
19
130 Brand X oil filters and 93 Brand Y oil filters were tested for milligrams of residue,with the following results.Find a 95% confidence interval for - . A = 4.3 B = 0.13 C = 5.7 D = 0.11
A)(-1.44,1.43)
B)(-1.43,-1.37)
C)(-1.44,-1.36)
D)(0.97,1.83)
E)(1.37,1.43)
- . A = 4.3 B = 0.13 C = 5.7 D = 0.11A)(-1.44,1.43)
B)(-1.43,-1.37)
C)(-1.44,-1.36)
D)(0.97,1.83)
E)(1.37,1.43)
Unlock Deck
Unlock for access to all 50 flashcards in this deck.
Unlock Deck
k this deck
20
Two machines are being considered to weigh luggage at an airport.A standard 30 kg weight is used to test the machines.Sample weigh-ins were taken from each machine and the following results were obtained. At the 0.02 level of significance,test the claim that the population mean for Machine 1 is different from the population mean for Machine 2.
At the 0.02 level of significance,test the claim that the population mean for Machine 1 is different from the population mean for Machine 2. Unlock Deck
Unlock for access to all 50 flashcards in this deck.
Unlock Deck
k this deck
21
When we fail to reject the null hypothesis,we
A)claim that a significant difference exists between groups.
B)have committed a Type I error.
C)have obtained a t-value greater than our critical t-value.
D)conclude that sampling variability is responsible for our obtained difference.
E)have committed a Type II error.
A)claim that a significant difference exists between groups.
B)have committed a Type I error.
C)have obtained a t-value greater than our critical t-value.
D)conclude that sampling variability is responsible for our obtained difference.
E)have committed a Type II error.
Unlock Deck
Unlock for access to all 50 flashcards in this deck.
Unlock Deck
k this deck
22
A researcher was interested in comparing the GPAs of students at the University of Toronto Scarborough and Mississauga campuses.Independent random samples of 8 students from the Scarborough campus and 13 students from the Mississauga campus yielded the following GPAs. Do the data provide sufficient evidence to conclude that the mean GPA of students at the Scarborough campus differs from the mean GPA of students at the Mississauga campus? Perform a t-test at the 10% significance level.
Do the data provide sufficient evidence to conclude that the mean GPA of students at the Scarborough campus differs from the mean GPA of students at the Mississauga campus? Perform a t-test at the 10% significance level. Unlock Deck
Unlock for access to all 50 flashcards in this deck.
Unlock Deck
k this deck
23
A researcher wishes to determine whether people with high blood pressure can reduce their blood pressure by following a particular diet.Use the sample data below to test the claim that the treatment population mean μ1 is smaller than the control population mean μ2.Test the claim using a significance level of 0.01. n1 = 85 n2 = 75 = 189.1 = 203.7
s1 = 38.7 s2 = 39.2
df = 155.
n1 = 85 n2 = 75 = 189.1 = 203.7s1 = 38.7 s2 = 39.2
df = 155.
Unlock Deck
Unlock for access to all 50 flashcards in this deck.
Unlock Deck
k this deck
24
A paint manufacturer wishes to compare the drying times of two different types of paint.Independent random samples of 11 cans of type A and 9 cans of type B were selected and applied to similar surfaces.The drying times (in minutes)were recorded.The summary statistics are as follows. Do the data provide sufficient evidence to conclude that the mean drying time for type A differs from the mean drying time for type B? Perform a at the 1% significance level.
Do the data provide sufficient evidence to conclude that the mean drying time for type A differs from the mean drying time for type B? Perform a at the 1% significance level. Unlock Deck
Unlock for access to all 50 flashcards in this deck.
Unlock Deck
k this deck
25
The Better Cookie Company claims its chocolate chip cookies have more chips than another chocolate chip cookie.120 Better Cookies and 100 of the other type of cookie were randomly selected and the number of chips in each cookie was recorded.The results are as follows.
Better Another
Mean number of chips 7.6 6.9
Standard deviation 1.4 1.7
At the 2% level of significance,test the claim that the population of Better Cookies has a higher mean number of chips.
Better Another
Mean number of chips 7.6 6.9
Standard deviation 1.4 1.7
At the 2% level of significance,test the claim that the population of Better Cookies has a higher mean number of chips.
Unlock Deck
Unlock for access to all 50 flashcards in this deck.
Unlock Deck
k this deck
26
When testing for a difference between the means of a treated population and an untreated population,the computer display below is obtained.Explain what the P-Value of 0.0316 means in this context.
Unlock Deck
Unlock for access to all 50 flashcards in this deck.
Unlock Deck
k this deck
27
When testing the difference between the means of a treatment group and a placebo group,the computer display below is obtained.Using a 0.05 significance level,is there sufficient evidence to support the claim that the treatment group (variable 1)represents a population whose mean is different from the mean for the untreated population? Explain.
Unlock Deck
Unlock for access to all 50 flashcards in this deck.
Unlock Deck
k this deck
28
A researcher was interested in comparing the salaries of female and male employees of a particular company.Independent random samples of 8 female employees (sample 1)and 15 male employees (sample 2)yielded the following weekly salaries (in dollars). Do the data provide sufficient evidence to conclude that the mean salary of women at this company is less than the mean salary of men at the company? Perform a at the 5% significance level.
Do the data provide sufficient evidence to conclude that the mean salary of women at this company is less than the mean salary of men at the company? Perform a at the 5% significance level. Unlock Deck
Unlock for access to all 50 flashcards in this deck.
Unlock Deck
k this deck
29
A study was made to determine which taxi company gave quicker service.Companies A and B were each called at 50 randomly selected times.The response times were recorded.The results are as follows.
Company A Company B
Mean response time 7.6 minutes 6.9 minutes
Standard deviation 1.4 minutes 1.7 minutes
At the 0.02 level of significance,test the claim that the two companies have different mean response times.
Company A Company B
Mean response time 7.6 minutes 6.9 minutes
Standard deviation 1.4 minutes 1.7 minutes
At the 0.02 level of significance,test the claim that the two companies have different mean response times.
Unlock Deck
Unlock for access to all 50 flashcards in this deck.
Unlock Deck
k this deck
30
Two types of flares were tested for their burning times (in minutes).Sample results are given below. n = 35 n = 40 = 19.4 = 15.1
s = 1.4 s = 0.8
df = 52
Refer to the sample data to test the claim that the two populations have unequal means..Carry out the test with a 1% significance level.
n = 35 n = 40 = 19.4 = 15.1s = 1.4 s = 0.8
df = 52
Refer to the sample data to test the claim that the two populations have unequal means..Carry out the test with a 1% significance level.
Unlock Deck
Unlock for access to all 50 flashcards in this deck.
Unlock Deck
k this deck
31
A researcher is interested in the academic performance differences between individuals using an optimistic versus a pessimistic approach to their studies.If the researcher fails to find a significant difference,when in fact one exists in the population,
A)the research hypothesis was correctly accepted.
B)a Type I error has been made.
C)the null hypothesis was correctly rejected.
D)the null hypothesis was correctly accepted.
E)a Type II error has been made.
A)the research hypothesis was correctly accepted.
B)a Type I error has been made.
C)the null hypothesis was correctly rejected.
D)the null hypothesis was correctly accepted.
E)a Type II error has been made.
Unlock Deck
Unlock for access to all 50 flashcards in this deck.
Unlock Deck
k this deck
32
A researcher wishes to determine whether people with high blood pressure can reduce their blood pressure by following a particular diet.Use the sample data below to test the claim that the treatment population mean μ1 is smaller than the control population mean μ2.Test the claim using a significance level of 0.01. n1 = 85 n2 = 75 = 189.1 = 203.7
s1 = 38.7 s2 = 39.2
n1 = 85 n2 = 75 = 189.1 = 203.7s1 = 38.7 s2 = 39.2
Unlock Deck
Unlock for access to all 50 flashcards in this deck.
Unlock Deck
k this deck
33
When testing for a difference between the means of a treated population and an untreated population,the computer display below is obtained.Explain what the P-value of 0.0768 means in this context.
Unlock Deck
Unlock for access to all 50 flashcards in this deck.
Unlock Deck
k this deck
34
When testing the difference between the means of a treatment group and a placebo group,the computer display below is obtained.Using a 0.05 significance level,is there sufficient evidence to support the claim that the treatment group (variable 1)represents a population whose mean is less than the mean for the untreated population? Explain.
Unlock Deck
Unlock for access to all 50 flashcards in this deck.
Unlock Deck
k this deck
35
A researcher was interested in comparing the amount of time spent watching television by women and by men.Independent random samples of 14 women and 17 men were selected and each person was asked how many hours he or she had watched television during the previous week.The summary statistics are as follows. Do the data provide sufficient evidence to conclude that the mean time for women is less than the mean time for men? Perform a t-test at the 5% significance level.
Do the data provide sufficient evidence to conclude that the mean time for women is less than the mean time for men? Perform a t-test at the 5% significance level. Unlock Deck
Unlock for access to all 50 flashcards in this deck.
Unlock Deck
k this deck
36
Two machines are being considered to weigh luggage at an airport.A standard 30 kg weight is used to test the machines.Sample weigh-ins were taken from each machine and the following results were obtained. df = 48.
At the 0.02 level of significance,test the claim that the population mean for Machine 1 is different from the population mean for Machine 2.
df = 48.At the 0.02 level of significance,test the claim that the population mean for Machine 1 is different from the population mean for Machine 2.
Unlock Deck
Unlock for access to all 50 flashcards in this deck.
Unlock Deck
k this deck
37
When testing the difference between the means of a treatment group and a placebo group,the computer display below is obtained.Using a 0.01 significance level,is there sufficient evidence to support the claim that the treatment group (variable 1)represents a population whose mean is greater than the mean for the untreated population? Explain.
Unlock Deck
Unlock for access to all 50 flashcards in this deck.
Unlock Deck
k this deck
38
A study was made to determine which taxi company gave quicker service.Companies A and B were each called at 50 randomly selected times.The response times were recorded.The results are as follows.
Company A Company B
Mean response time 7.6 minutes 6.9 minutes
Standard deviation 1.4 minutes 1.7 minutes
df = 94.
At the 0.02 level of significance,test the claim that the two companies have different mean response times.
Company A Company B
Mean response time 7.6 minutes 6.9 minutes
Standard deviation 1.4 minutes 1.7 minutes
df = 94.
At the 0.02 level of significance,test the claim that the two companies have different mean response times.
Unlock Deck
Unlock for access to all 50 flashcards in this deck.
Unlock Deck
k this deck
39
The Better Cookie Company claims its chocolate chip cookies have more chips than another chocolate chip cookie.120 Better Cookies and 100 of the other type of cookie were randomly selected and the number of chips in each cookie was recorded.The results are as follows.
Better Another
Mean number of chips 7.6 6.9
Standard deviation 1.4 1.7
df = 191.
At the 2% level of significance,test the claim that the population of Better Cookies has a higher mean number of chips.
Better Another
Mean number of chips 7.6 6.9
Standard deviation 1.4 1.7
df = 191.
At the 2% level of significance,test the claim that the population of Better Cookies has a higher mean number of chips.
Unlock Deck
Unlock for access to all 50 flashcards in this deck.
Unlock Deck
k this deck
40
When testing the difference between the means of a treatment group and a placebo group,the computer display below is obtained.Using a 0.05 significance level,is there sufficient evidence to support the claim that the treatment group (variable 1)represents a population whose mean is different from the mean for the untreated population? Explain.
Unlock Deck
Unlock for access to all 50 flashcards in this deck.
Unlock Deck
k this deck
41
You wish to construct a 95% confidence interval to compare the mean measurement for two groups.A small pilot study yields sample standard deviations of 20 and 30 for Group 1 and Group 2,respectively.If we wish to obtain a margin of error of at most 10,what sample size should we take from each group? Assume equal sample sizes.
A)49
B)47
C)50
D)48
E)51
A)49
B)47
C)50
D)48
E)51
Unlock Deck
Unlock for access to all 50 flashcards in this deck.
Unlock Deck
k this deck
42
Two machines are being considered to weigh luggage at an airport.A standard 30 kg weight is used to test the machines.Sample weigh-ins were taken from each machine and the following results were obtained. At the 0.02 level of significance,test the claim that the population mean for Machine 1 is different from the population mean for Machine 2.Carry out the test assuming the population variances are equal.
At the 0.02 level of significance,test the claim that the population mean for Machine 1 is different from the population mean for Machine 2.Carry out the test assuming the population variances are equal. Unlock Deck
Unlock for access to all 50 flashcards in this deck.
Unlock Deck
k this deck
43
You wish to construct a 90% confidence interval to compare the mean measurement for two groups.A small pilot study yields sample standard deviations of 20 and 30 for Group 1 and Group 2,respectively.If we wish to obtain a margin of error of at most 5,what sample size should we take from each group? Assume equal sample sizes.
A)141
B)139
C)143
D)140
E)142
A)141
B)139
C)143
D)140
E)142
Unlock Deck
Unlock for access to all 50 flashcards in this deck.
Unlock Deck
k this deck
44
You wish to construct a 95% confidence interval to compare the mean measurement for two groups.A small pilot study yields sample standard deviations of 10 and 15 for Group 1 and Group 2,respectively.If we wish to obtain a margin of error of at most 5,what sample size should we take from each group? Assume equal sample sizes.
A)46
B)50
C)48
D)47
E)49
A)46
B)50
C)48
D)47
E)49
Unlock Deck
Unlock for access to all 50 flashcards in this deck.
Unlock Deck
k this deck
45
Compare the technique for decision making about populations using the hypothesis test method and the confidence interval method.
Unlock Deck
Unlock for access to all 50 flashcards in this deck.
Unlock Deck
k this deck
46
You wish to construct a 95% confidence interval to compare the mean measurement for two groups.A small pilot study yields sample standard deviations of 10 and 12 for Group 1 and Group 2,respectively.If we wish to obtain a margin of error of at most 2,what sample size should we take from each group? Assume equal sample sizes.
A)232
B)233
C)235
D)234
E)231
A)232
B)233
C)235
D)234
E)231
Unlock Deck
Unlock for access to all 50 flashcards in this deck.
Unlock Deck
k this deck
47
A researcher is interested in the academic performance differences between individuals using an optimistic versus a pessimistic approach to their studies.If the researcher claims a significant difference between groups,when in fact none exists,
A)a Type I error is made.
B)a Type II error is made.
C)the research hypothesis was correctly accepted.
D)the null hypothesis was correctly accepted.
E)the research hypothesis was correctly rejected.
A)a Type I error is made.
B)a Type II error is made.
C)the research hypothesis was correctly accepted.
D)the null hypothesis was correctly accepted.
E)the research hypothesis was correctly rejected.
Unlock Deck
Unlock for access to all 50 flashcards in this deck.
Unlock Deck
k this deck
48
You wish to construct a 90% confidence interval to compare the mean measurement for two groups.A small pilot study yields sample standard deviations of 10 and 15 for Group 1 and Group 2,respectively.If we wish to obtain a margin of error of at most 3,what sample size should we take from each group? Assume equal sample sizes.
A)99
B)96
C)97
D)100
E)98
A)99
B)96
C)97
D)100
E)98
Unlock Deck
Unlock for access to all 50 flashcards in this deck.
Unlock Deck
k this deck
49
You wish to construct a 90% confidence interval to compare the mean measurement for two groups.A small pilot study yields sample standard deviations of 10 and 12 for Group 1 and Group 2,respectively.If we wish to obtain a margin of error of at most 2,what sample size should we take from each group? Assume equal sample sizes.
A)165
B)168
C)169
D)166
E)167
A)165
B)168
C)169
D)166
E)167
Unlock Deck
Unlock for access to all 50 flashcards in this deck.
Unlock Deck
k this deck
50
A study was made to determine which taxi company gave quicker service.Companies A and B were each called at 50 randomly selected times.The response times were recorded.The results are as follows.
Company A Company B
Mean response time 7.6 minutes 6.9 minutes
Standard deviation 1.4 minutes 1.7 minutes
At the 0.02 level of significance,test the claim that the two companies have different mean response times.Carry out the test assuming the population variances are equal.
Company A Company B
Mean response time 7.6 minutes 6.9 minutes
Standard deviation 1.4 minutes 1.7 minutes
At the 0.02 level of significance,test the claim that the two companies have different mean response times.Carry out the test assuming the population variances are equal.
Unlock Deck
Unlock for access to all 50 flashcards in this deck.
Unlock Deck
k this deck
Unlock Deck
Unlock for access to all 50 flashcards in this deck.


