Deck 22: Paired Samples and Blocks
Full screen (f)
Question
A test of writing ability is given to a random sample of students before and after they completed a formal writing course.The results are given below.Construct a 99% confidence interval for the mean difference between the before and after scores if  (before - after)= 2.0 and sd =2.6457
  After 69 79 90 96 91 95 75 64 62 64 76
A)(-0.2,4.2)
B)(-0.1,4.1)
C)(-13.6,17.6)
D)(1.2,2.8)
E)(-0.5,4.5)
(before - after)= 2.0 and sd =2.6457 After 69 79 90 96 91 95 75 64 62 64 76A)(-0.2,4.2)
B)(-0.1,4.1)
C)(-13.6,17.6)
D)(1.2,2.8)
E)(-0.5,4.5)
Question
Ten different families are tested for the number of litres of water they use per week before and after viewing a conservation video.Construct a 90% confidence interval for the mean of the difference of the "before" minus the "after" times if  (before - after)= 4.8 and sd = 5.2451
  After 34 28 25 28 35 33 31 28 35 33
A)(1.8,7.8)
B)(3.8,5.8)
C)(2.5,7.1)
D)(2.1,7.5)
E)(1.5,8.1)
(before - after)= 4.8 and sd = 5.2451 After 34 28 25 28 35 33 31 28 35 33A)(1.8,7.8)
B)(3.8,5.8)
C)(2.5,7.1)
D)(2.1,7.5)
E)(1.5,8.1)
Question
Question
A coach uses a new technique in training middle distance runners.The times for 8 different athletes to run 800 metres before and after this training are shown below. 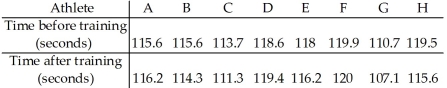 Do the data suggest that,on average,the training helps to improve the athletes' times for the 800 metres? Perform a paired
  at the 5% significance level.
Do the data suggest that,on average,the training helps to improve the athletes' times for the 800 metres? Perform a paired at the 5% significance level. Question
The owner of a large apartment complex had an in-ground swimming pool installed in an effort to increase tenant satisfaction.Nine tenants were randomly selected to complete a questionnaire that assessed their level of satisfaction with the apartment complex.Their scores before and after the installation of the pool are shown.The owner wants to assess the effectiveness of the pool in increasing tenant satisfaction. 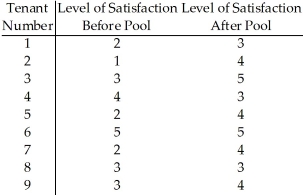
Question
A test of abstract reasoning is given to a random sample of students before and after they completed a formal logic course.The results are given below.Do the data suggest that the mean score after the course differs from the mean score before the course? Perform a paired  at the 5% significance level.
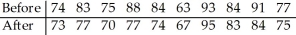
at the 5% significance level. Question
A test of abstract reasoning is given to a random sample of students before and after they completed a formal logic course.The results are given below.Construct a 95% confidence interval for the mean difference between the before and after scores if  (before - after)= 3.7 and sd = 4.945
  After 73 77 70 77 74 67 95 83 84 75
A)(1.2,5.7)
B)(0.2,7.2)
C)(0.8,6.6)
D)(1.0,6.4)
E)(-4.4,11.8)
(before - after)= 3.7 and sd = 4.945 After 73 77 70 77 74 67 95 83 84 75A)(1.2,5.7)
B)(0.2,7.2)
C)(0.8,6.6)
D)(1.0,6.4)
E)(-4.4,11.8)
Question
The table below shows the weights of seven subjects before and after following a particular diet for two months. 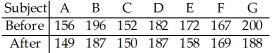 Do the data suggest that,on average,the diet is effective in reducing weight? Perform a paired
  at the 1% significance level.
Do the data suggest that,on average,the diet is effective in reducing weight? Perform a paired at the 1% significance level. Question
A researcher was interested in comparing the salaries of female and male employees of a particular company.Independent random samples of 8 female employees (sample 1)and 8 male employees (sample 2)yielded the following weekly salaries (in dollars). 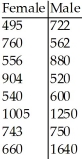
Question
Question
Question
Question
Question
A coach uses a new technique to train gymnasts.7 gymnasts were randomly selected and their competition scores were recorded before and after the training.The results are shown below. 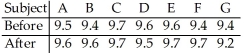 Do the data suggest that,on average,the training technique is effective in raising the gymnasts' scores? Perform a paired t-test at the 5% significance level.
Do the data suggest that,on average,the training technique is effective in raising the gymnasts' scores? Perform a paired t-test at the 5% significance level. Question
A coach uses a new technique in training middle distance runners.The times for 9 different athletes to run 800 metres before and after this training are shown below. 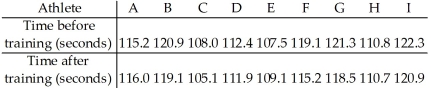 Construct a 99% confidence interval for the mean difference of the "before" minus "after" times if
 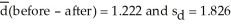 .
.
A)(-0.54,2.98)
B)(-6.42,8.87)
C)(-0.85,3.29)
D)(-0.76,3.20)
E)(-0.82,3.26)
Construct a 99% confidence interval for the mean difference of the "before" minus "after" times if .A)(-0.54,2.98)
B)(-6.42,8.87)
C)(-0.85,3.29)
D)(-0.76,3.20)
E)(-0.82,3.26)
Question
Five students took a math test before and after tutoring.Their scores were as follows. 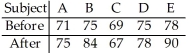 Do the data suggest that the tutoring improves math scores on average? Perform a paired
  at the 10% significance level.
Do the data suggest that the tutoring improves math scores on average? Perform a paired at the 10% significance level. Question
Ten different families are tested for the number of litres of water a week they use before and after viewing a conservation video.Do the data suggest that the mean amount after the viewing differs from the mean amount before the viewing? Perform a paired  at the 5% significance level.
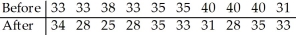
at the 5% significance level. Question
A consumer is interested in investigating the difference in price between regular and premium gasoline at major filling stations in the U.S.A.An independent,random sample of stations is chosen and the prices per gallon are recorded for regular and premium gasoline.A histogram or Normal probability plot of the differences would be needed to verify the Nearly Normal Condition. 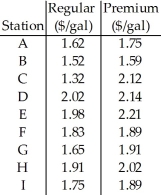
Question
Question
A manufacturer has designed athletic footwear which it hopes will improve the performance of athletes running the  sprint.It wishes to perform a hypothesis test to compare the times of athletes at the 100 metres with these shoes and with their usual shoes.
A)Two-sample t-test,since the experiment has two samples.
B)Either two-sample or paired t-test would be equally accurate.
C)Pooled t-test,since the standard deviations of the two populations are likely to be the same.
D)Paired t-test,since a natural pairing exists,and would detect differences between the population means better.
E)Not enough information is given to determine correct type of test.
sprint.It wishes to perform a hypothesis test to compare the times of athletes at the 100 metres with these shoes and with their usual shoes.A)Two-sample t-test,since the experiment has two samples.
B)Either two-sample or paired t-test would be equally accurate.
C)Pooled t-test,since the standard deviations of the two populations are likely to be the same.
D)Paired t-test,since a natural pairing exists,and would detect differences between the population means better.
E)Not enough information is given to determine correct type of test.
Question
Question
A high school coach uses a new technique in training middle distance runners.He records the times for 4 different athletes to run 800 metres before and after this training.A 98% confidence interval for the difference of the means before and after the training,μB - μA,was determined to be 
A)We know that 98% of the middle distance runners shortened their times between 2.5 and 4.7 seconds after the training.
B)We know that 98% of all random samples done on runners at this high school will show that the mean time difference before and after the training is between 2.5 and 4.7 seconds.
C)Based on this sample,with 98% confidence,the average time for the 800-metre run for middle distance runners at this high school is between 2.5 and 4.7 seconds longer after the new training.
D)We are 98% confident that a randomly selected middle distance runner at this high school will have a time for the 800-metre run that is between 2.5 and 4.7 seconds shorter after the training than before the training.
E)Based on this sample,with 98% confidence,the average time for the 800-metre run for middle distance runners at this high school is between 2.5 and 4.7 seconds shorter after the new training.
Question
Question
Question
A study was conducted to determine the average number of words children learn during their third year.For a random sample of one hundred children,parents reported the number of words spoken at 24 months and then again at 36 months of age.A 98% confidence interval for the difference of the means at 36 months and 24 months,μ36 - μ24,was determined to be 
A)We are 98% confident that,on average,the number of words spoken by children at 36 months of age is between 200 and 277 words greater than the number of words spoken by children at 24 months of age.
B)We know that 98% of children say between 200 and 277 more words at 36 months of age than at 24 months of age.
C)We are 98% confident that the children in this sample said,on average,between 200 and 277 more words at 36 months than at 24 months of age.
D)We know that 98% of all random samples done on the population will show that the average number of words spoken by children is between 200 and 277 words greater at 36 months than at 24 months of age.
E)We are 98% confident that a randomly selected child will say between 200 and 277 more words at 36 months than at 24 months of age.
Question
A study was conducted to determine if people consume more calories when they eat dinner while watching television.A random sample of ten people was selected to eat dinner one night in the dining room and the next night while watching television in the family room.The caloric content of their dinners was measured,and a 98% confidence interval for the difference in the means with and without the television,  was determined to be (-80,220).
A)Based on this sample,we know that 98% of people eat between 80 fewer and 220 more calories when they eat dinner in front of the television compared to dinner in the dining room.
B)Based on this sample,we are 98% confident that the average caloric content is between 80 fewer and 220 more calories when people eat dinner in front of the television compared to dinner in the dining room.
C)We are 98% confident that a randomly selected person will eat between 80 calories fewer and 220 calories more for dinner in front of the television compared to dinner in the dining room.
D)Based on this sample,we know that 98% of people eat between 80 and 220 fewer calories when they eat dinner in front of the television compared to dinner in the dining room.
E)We know that 98% of all random samples done on the population will show that the difference in the mean caloric content between dinner with and without television is between 80 calories fewer and 220 calories more.
was determined to be (-80,220).A)Based on this sample,we know that 98% of people eat between 80 fewer and 220 more calories when they eat dinner in front of the television compared to dinner in the dining room.
B)Based on this sample,we are 98% confident that the average caloric content is between 80 fewer and 220 more calories when people eat dinner in front of the television compared to dinner in the dining room.
C)We are 98% confident that a randomly selected person will eat between 80 calories fewer and 220 calories more for dinner in front of the television compared to dinner in the dining room.
D)Based on this sample,we know that 98% of people eat between 80 and 220 fewer calories when they eat dinner in front of the television compared to dinner in the dining room.
E)We know that 98% of all random samples done on the population will show that the difference in the mean caloric content between dinner with and without television is between 80 calories fewer and 220 calories more.
Question
The table below shows the weights of 9 subjects,in kg,before and after they followed a particular diet for two months. 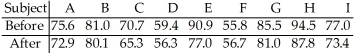 Construct a 95% confidence interval for the mean difference of the "before" minus "after" weights if
  (before - after)= 4.4333 and sd = 4.2146
A)(2.8,7.0)
B)(-7.0,6.8)
C)(2.4,7.4)
D)(1.2,7.7)
E)(1.5,6.7)
Construct a 95% confidence interval for the mean difference of the "before" minus "after" weights if (before - after)= 4.4333 and sd = 4.2146A)(2.8,7.0)
B)(-7.0,6.8)
C)(2.4,7.4)
D)(1.2,7.7)
E)(1.5,6.7)
Question
Question
Question
Question
Question
The violent crime rate (number of violent crimes per 100,000 residents)is investigated for nine Canadian cities for the years 1990 and 2000 to see if there has been a change. 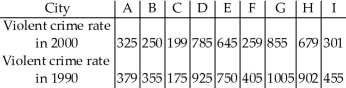 Is there evidence that the violent crime rate has decreased? Suppose you had mistakenly treated these data as two independent samples instead of matched pairs.What would the significance test have found? Explain why the results are so different.
Is there evidence that the violent crime rate has decreased? Suppose you had mistakenly treated these data as two independent samples instead of matched pairs.What would the significance test have found? Explain why the results are so different. Question
Question
Question

Unlock Deck
Sign up to unlock the cards in this deck!
Unlock Deck
Unlock Deck
1/35
Play
Full screen (f)
Deck 22: Paired Samples and Blocks
1
A test of writing ability is given to a random sample of students before and after they completed a formal writing course.The results are given below.Construct a 99% confidence interval for the mean difference between the before and after scores if (before - after)= 2.0 and sd =2.6457 After 69 79 90 96 91 95 75 64 62 64 76
A)(-0.2,4.2)
B)(-0.1,4.1)
C)(-13.6,17.6)
D)(1.2,2.8)
E)(-0.5,4.5)
(before - after)= 2.0 and sd =2.6457 After 69 79 90 96 91 95 75 64 62 64 76A)(-0.2,4.2)
B)(-0.1,4.1)
C)(-13.6,17.6)
D)(1.2,2.8)
E)(-0.5,4.5)
(-0.5,4.5)
2
Ten different families are tested for the number of litres of water they use per week before and after viewing a conservation video.Construct a 90% confidence interval for the mean of the difference of the "before" minus the "after" times if (before - after)= 4.8 and sd = 5.2451 After 34 28 25 28 35 33 31 28 35 33
A)(1.8,7.8)
B)(3.8,5.8)
C)(2.5,7.1)
D)(2.1,7.5)
E)(1.5,8.1)
(before - after)= 4.8 and sd = 5.2451 After 34 28 25 28 35 33 31 28 35 33A)(1.8,7.8)
B)(3.8,5.8)
C)(2.5,7.1)
D)(2.1,7.5)
E)(1.5,8.1)
(1.8,7.8)
3
A teacher is interested in performing a hypothesis test to compare the mean math score of the girls and the mean math score of the boys.She randomly selects 10 girls from the class and then randomly selects 10 boys.She arranges the girls' names alphabetically and uses this list to assign each girl a number between 1 and 10.She does the same thing for the boys.
A)Paired t-test.Since the boys and girls are in the same class,and are hence dependent samples,they are can be linked.
B)Either two-sample or paired t-test will work.
C)One-sample t-test.The teacher should compare the sample mean for the girls against the population mean for the boys.
D)Two-sample t-test.There is no natural pairing between the two populations.
E)Paired t-test.Since there are 10 boys and 10 girls,we can link the two samples.
Two-sample t-test.There is no natural pairing between the two populations.
4
A coach uses a new technique in training middle distance runners.The times for 8 different athletes to run 800 metres before and after this training are shown below. Do the data suggest that,on average,the training helps to improve the athletes' times for the 800 metres? Perform a paired at the 5% significance level.
Do the data suggest that,on average,the training helps to improve the athletes' times for the 800 metres? Perform a paired at the 5% significance level. Unlock Deck
Unlock for access to all 35 flashcards in this deck.
Unlock Deck
k this deck
5
The owner of a large apartment complex had an in-ground swimming pool installed in an effort to increase tenant satisfaction.Nine tenants were randomly selected to complete a questionnaire that assessed their level of satisfaction with the apartment complex.Their scores before and after the installation of the pool are shown.The owner wants to assess the effectiveness of the pool in increasing tenant satisfaction.
Unlock Deck
Unlock for access to all 35 flashcards in this deck.
Unlock Deck
k this deck
6
A test of abstract reasoning is given to a random sample of students before and after they completed a formal logic course.The results are given below.Do the data suggest that the mean score after the course differs from the mean score before the course? Perform a paired at the 5% significance level.
at the 5% significance level. Unlock Deck
Unlock for access to all 35 flashcards in this deck.
Unlock Deck
k this deck
7
A test of abstract reasoning is given to a random sample of students before and after they completed a formal logic course.The results are given below.Construct a 95% confidence interval for the mean difference between the before and after scores if (before - after)= 3.7 and sd = 4.945 After 73 77 70 77 74 67 95 83 84 75
A)(1.2,5.7)
B)(0.2,7.2)
C)(0.8,6.6)
D)(1.0,6.4)
E)(-4.4,11.8)
(before - after)= 3.7 and sd = 4.945 After 73 77 70 77 74 67 95 83 84 75A)(1.2,5.7)
B)(0.2,7.2)
C)(0.8,6.6)
D)(1.0,6.4)
E)(-4.4,11.8)
Unlock Deck
Unlock for access to all 35 flashcards in this deck.
Unlock Deck
k this deck
8
The table below shows the weights of seven subjects before and after following a particular diet for two months. Do the data suggest that,on average,the diet is effective in reducing weight? Perform a paired at the 1% significance level.
Do the data suggest that,on average,the diet is effective in reducing weight? Perform a paired at the 1% significance level. Unlock Deck
Unlock for access to all 35 flashcards in this deck.
Unlock Deck
k this deck
9
A researcher was interested in comparing the salaries of female and male employees of a particular company.Independent random samples of 8 female employees (sample 1)and 8 male employees (sample 2)yielded the following weekly salaries (in dollars).
Unlock Deck
Unlock for access to all 35 flashcards in this deck.
Unlock Deck
k this deck
10
An agricultural company wanted to know if a new insecticide would increase corn yields.Eight test plots showed an average increase of 3.125 bushels per acre.The standard deviation of the increases was 2.911 bushels per acre.Determine a 90% confidence interval for the mean increase in yield.
A)(1.175,3.815)
B)(1.175,5.075)
C)(2.435,3.815)
D)(2.435,5.075)
E)(-5.075,-3.815)
A)(1.175,3.815)
B)(1.175,5.075)
C)(2.435,3.815)
D)(2.435,5.075)
E)(-5.075,-3.815)
Unlock Deck
Unlock for access to all 35 flashcards in this deck.
Unlock Deck
k this deck
11
A researcher wishes to determine whether listening to music affects students' performance on memory test.He randomly selects 50 students and has each student perform a memory test once while listening to music and once without listening to music.He obtains the mean and standard deviation of the 50 "with music" scores and obtains the mean and standard deviation of the 50 "without music scores".
A)Two-sample t-test,since the researcher has two samples.
B)Pooled t-test,since the standard deviation is likely to be the same in both populations.
C)Paired t-test,since there is a "with music" and "without music" score for each person.
D)z-test for each sample,since the researcher has the sample standard deviation.
E)Not enough information given to determine correct type of test.
Unlock Deck
Unlock for access to all 35 flashcards in this deck.
Unlock Deck
k this deck
12
A researcher is interested in investigating whether people perform better at dexterity tests while listening to classical music or to no music.He designs a dexterity test,and first gives it to his participants while classical music is playing,and then while no music is playing.
A)Paired t-test,since there are two sets of measurements on the same subjects,providing a natural linking.
B)One-sample t-test,since there is only one sample of subjects taking the dexterity tests.
C)z-test,since the researcher can find the standard deviation of his population.
D)Two-sample t-test,since how a subject performs with music should have no influence on how he performs without music,creating two independent samples.
E)Not enough information is given to determine the best type of test.
Unlock Deck
Unlock for access to all 35 flashcards in this deck.
Unlock Deck
k this deck
13
A researcher wishes to compare how students at two different schools perform on a math test.He randomly selects 40 students from each school and obtains their test scores.
A)Either two-sample or paired t-tests will work equally well.
B)Pooled t-test,since the standard deviations of the two populations are likely to be the same.
C)Paired t-test,since the students at the two schools can be paired together.
D)Two-sample t-test,since the samples are independent.
E)Not enough information is given to determine the correct type of test.
Unlock Deck
Unlock for access to all 35 flashcards in this deck.
Unlock Deck
k this deck
14
A coach uses a new technique to train gymnasts.7 gymnasts were randomly selected and their competition scores were recorded before and after the training.The results are shown below. Do the data suggest that,on average,the training technique is effective in raising the gymnasts' scores? Perform a paired t-test at the 5% significance level.
Do the data suggest that,on average,the training technique is effective in raising the gymnasts' scores? Perform a paired t-test at the 5% significance level. Unlock Deck
Unlock for access to all 35 flashcards in this deck.
Unlock Deck
k this deck
15
A coach uses a new technique in training middle distance runners.The times for 9 different athletes to run 800 metres before and after this training are shown below. Construct a 99% confidence interval for the mean difference of the "before" minus "after" times if .
A)(-0.54,2.98)
B)(-6.42,8.87)
C)(-0.85,3.29)
D)(-0.76,3.20)
E)(-0.82,3.26)
Construct a 99% confidence interval for the mean difference of the "before" minus "after" times if .A)(-0.54,2.98)
B)(-6.42,8.87)
C)(-0.85,3.29)
D)(-0.76,3.20)
E)(-0.82,3.26)
Unlock Deck
Unlock for access to all 35 flashcards in this deck.
Unlock Deck
k this deck
16
Five students took a math test before and after tutoring.Their scores were as follows. Do the data suggest that the tutoring improves math scores on average? Perform a paired at the 10% significance level.
Do the data suggest that the tutoring improves math scores on average? Perform a paired at the 10% significance level. Unlock Deck
Unlock for access to all 35 flashcards in this deck.
Unlock Deck
k this deck
17
Ten different families are tested for the number of litres of water a week they use before and after viewing a conservation video.Do the data suggest that the mean amount after the viewing differs from the mean amount before the viewing? Perform a paired at the 5% significance level.
at the 5% significance level. Unlock Deck
Unlock for access to all 35 flashcards in this deck.
Unlock Deck
k this deck
18
A consumer is interested in investigating the difference in price between regular and premium gasoline at major filling stations in the U.S.A.An independent,random sample of stations is chosen and the prices per gallon are recorded for regular and premium gasoline.A histogram or Normal probability plot of the differences would be needed to verify the Nearly Normal Condition.
Unlock Deck
Unlock for access to all 35 flashcards in this deck.
Unlock Deck
k this deck
19
An agricultural company wanted to know if a new insecticide increases corn yields.Eight test plots showed an average increase of 3.125 bushels per acre when the insecticide was used compared to the previous year.The standard deviation of the increases was 2.911 bushels per acre.The company wants to use a paired t-test to determine the mean increase in yield.
Unlock Deck
Unlock for access to all 35 flashcards in this deck.
Unlock Deck
k this deck
20
A manufacturer has designed athletic footwear which it hopes will improve the performance of athletes running the sprint.It wishes to perform a hypothesis test to compare the times of athletes at the 100 metres with these shoes and with their usual shoes.
A)Two-sample t-test,since the experiment has two samples.
B)Either two-sample or paired t-test would be equally accurate.
C)Pooled t-test,since the standard deviations of the two populations are likely to be the same.
D)Paired t-test,since a natural pairing exists,and would detect differences between the population means better.
E)Not enough information is given to determine correct type of test.
sprint.It wishes to perform a hypothesis test to compare the times of athletes at the 100 metres with these shoes and with their usual shoes.A)Two-sample t-test,since the experiment has two samples.
B)Either two-sample or paired t-test would be equally accurate.
C)Pooled t-test,since the standard deviations of the two populations are likely to be the same.
D)Paired t-test,since a natural pairing exists,and would detect differences between the population means better.
E)Not enough information is given to determine correct type of test.
Unlock Deck
Unlock for access to all 35 flashcards in this deck.
Unlock Deck
k this deck
21
The ages of 100 married male/female couples was recorded for a particular population.It was observed that out of the 100 couples,53 men were older the woman,32 women were older than the man,and 15 couples were the same age.Is the median difference in age between married men and women different from 0? Carry out a Sign Test.Assume the couples are a representative sample from the population.Use a significance level of 0.05.
Unlock Deck
Unlock for access to all 35 flashcards in this deck.
Unlock Deck
k this deck
22
A high school coach uses a new technique in training middle distance runners.He records the times for 4 different athletes to run 800 metres before and after this training.A 98% confidence interval for the difference of the means before and after the training,μB - μA,was determined to be
A)We know that 98% of the middle distance runners shortened their times between 2.5 and 4.7 seconds after the training.
B)We know that 98% of all random samples done on runners at this high school will show that the mean time difference before and after the training is between 2.5 and 4.7 seconds.
C)Based on this sample,with 98% confidence,the average time for the 800-metre run for middle distance runners at this high school is between 2.5 and 4.7 seconds longer after the new training.
D)We are 98% confident that a randomly selected middle distance runner at this high school will have a time for the 800-metre run that is between 2.5 and 4.7 seconds shorter after the training than before the training.
E)Based on this sample,with 98% confidence,the average time for the 800-metre run for middle distance runners at this high school is between 2.5 and 4.7 seconds shorter after the new training.
Unlock Deck
Unlock for access to all 35 flashcards in this deck.
Unlock Deck
k this deck
23
A researcher was interested in examining the difference in the number of hours of sleep married women and single women get each night.Five married women and five single women reported their average number of hours of sleep per night for the last week.Shown below is software output for two possible tests for the data.
Paired t-test of μ(1-2)
Test Ho: μ(S - M)= 0 vs HA: μ(S - M)≠ 0
Mean of Paired Differences = 1.6 t-Statistic = 4 w/4 df
p = 0.0161
2-Sample t-Test of μ1 - μ2
Ho: μS - μM = 0 Ha: μS - μM ≠ 0
Test H0: μ(S)- μ(M)= 0 vs HA: μ(S)- μ(M)≠ 0
Difference Between Means = 1.6 t-Statistic = 1.8353 w/7.27 df
p = 0.1075
Which of these tests is appropriate for these data? Explain.Using the test you select,state your conclusion.
Unlock Deck
Unlock for access to all 35 flashcards in this deck.
Unlock Deck
k this deck
24
Ten different families are tested for the number of litres of water they use each week before and after viewing a conservation video.We want to see if there is strong evidence that the conservation video changes people's water consumption rate.A t-test of the null hypothesis of no difference has a t-statistic of -2.894 with a P-value of 0.0178.Interpret this result by explaining the meaning of the P-value.
Unlock Deck
Unlock for access to all 35 flashcards in this deck.
Unlock Deck
k this deck
25
A study was conducted to determine the average number of words children learn during their third year.For a random sample of one hundred children,parents reported the number of words spoken at 24 months and then again at 36 months of age.A 98% confidence interval for the difference of the means at 36 months and 24 months,μ36 - μ24,was determined to be
A)We are 98% confident that,on average,the number of words spoken by children at 36 months of age is between 200 and 277 words greater than the number of words spoken by children at 24 months of age.
B)We know that 98% of children say between 200 and 277 more words at 36 months of age than at 24 months of age.
C)We are 98% confident that the children in this sample said,on average,between 200 and 277 more words at 36 months than at 24 months of age.
D)We know that 98% of all random samples done on the population will show that the average number of words spoken by children is between 200 and 277 words greater at 36 months than at 24 months of age.
E)We are 98% confident that a randomly selected child will say between 200 and 277 more words at 36 months than at 24 months of age.
Unlock Deck
Unlock for access to all 35 flashcards in this deck.
Unlock Deck
k this deck
26
A study was conducted to determine if people consume more calories when they eat dinner while watching television.A random sample of ten people was selected to eat dinner one night in the dining room and the next night while watching television in the family room.The caloric content of their dinners was measured,and a 98% confidence interval for the difference in the means with and without the television, was determined to be (-80,220).
A)Based on this sample,we know that 98% of people eat between 80 fewer and 220 more calories when they eat dinner in front of the television compared to dinner in the dining room.
B)Based on this sample,we are 98% confident that the average caloric content is between 80 fewer and 220 more calories when people eat dinner in front of the television compared to dinner in the dining room.
C)We are 98% confident that a randomly selected person will eat between 80 calories fewer and 220 calories more for dinner in front of the television compared to dinner in the dining room.
D)Based on this sample,we know that 98% of people eat between 80 and 220 fewer calories when they eat dinner in front of the television compared to dinner in the dining room.
E)We know that 98% of all random samples done on the population will show that the difference in the mean caloric content between dinner with and without television is between 80 calories fewer and 220 calories more.
was determined to be (-80,220).A)Based on this sample,we know that 98% of people eat between 80 fewer and 220 more calories when they eat dinner in front of the television compared to dinner in the dining room.
B)Based on this sample,we are 98% confident that the average caloric content is between 80 fewer and 220 more calories when people eat dinner in front of the television compared to dinner in the dining room.
C)We are 98% confident that a randomly selected person will eat between 80 calories fewer and 220 calories more for dinner in front of the television compared to dinner in the dining room.
D)Based on this sample,we know that 98% of people eat between 80 and 220 fewer calories when they eat dinner in front of the television compared to dinner in the dining room.
E)We know that 98% of all random samples done on the population will show that the difference in the mean caloric content between dinner with and without television is between 80 calories fewer and 220 calories more.
Unlock Deck
Unlock for access to all 35 flashcards in this deck.
Unlock Deck
k this deck
27
The table below shows the weights of 9 subjects,in kg,before and after they followed a particular diet for two months. Construct a 95% confidence interval for the mean difference of the "before" minus "after" weights if (before - after)= 4.4333 and sd = 4.2146
A)(2.8,7.0)
B)(-7.0,6.8)
C)(2.4,7.4)
D)(1.2,7.7)
E)(1.5,6.7)
Construct a 95% confidence interval for the mean difference of the "before" minus "after" weights if (before - after)= 4.4333 and sd = 4.2146A)(2.8,7.0)
B)(-7.0,6.8)
C)(2.4,7.4)
D)(1.2,7.7)
E)(1.5,6.7)
Unlock Deck
Unlock for access to all 35 flashcards in this deck.
Unlock Deck
k this deck
28
A researcher wants to investigate whether people can concentrate as effectively in the morning if they do not eat breakfast.He will score some volunteers on reading comprehension tests.Some of the testing will be done after volunteers have eaten breakfast,and some testing will be done after volunteers have skipped breakfast.Design an experiment that will require a two-sample t-test to analyze the results.Design an experiment that will require a matched pairs t-test to analyze the results.Which experiment would you consider to be the stronger design?
Unlock Deck
Unlock for access to all 35 flashcards in this deck.
Unlock Deck
k this deck
29
Ten different families were tested for the average number of litres of water they used per week before and after viewing a conservation video.A 95% confidence interval for the difference of the means after and before the training,μA - μB,was determined to be (-10.3,-4.1).
A)Based on this sample,we are 95% confident that the average decrease in weekly water consumption after viewing the conservation video is between 4.1 and 10.3 litres.
B)We are 95% confident that a randomly selected family who has viewed the video will use between 4.1 and 10.3 fewer litres of water per week compared to a randomly selected family who has not viewed the video.
C)We are 95% confident that a randomly selected family who has viewed the video will use between 4.1 and 10.3 more litres of water per week compared to a randomly selected family who has not viewed the video.
D)We know that 95% of families will use between 4.1 and 10.3 fewer litres of water each week after viewing the conservation video.
E)Based on this sample,we are 95% confident that the average increase in weekly water consumption after viewing the conservation video is between 4.1 and 10.3 litres.
Unlock Deck
Unlock for access to all 35 flashcards in this deck.
Unlock Deck
k this deck
30
The violent crime rate (number of violent crimes per 100,000 residents)is investigated for ten Canadian cities for the years 1990 and 2000 to see if there has been a change.Shown below is software output for two possible tests.
Paired t-test of μ(1-2)
Test H0: μ (2000 - 1990)= 0 vs HA: μ(2000 - 1990)≠ 0
Mean of Paired Differences = 110.7 t-Statistic = -2.632 w/9 df
p = 0.0273
Two-sample t-test of μ1 - μ2
H0: μ1 - μ2 = 0 HA: μ1 - μ2 ≠ 0
Test H0: μ(2000)- μ(1990)= 0 vs HA: μ(2000)- μ(1990)≠ 0
Difference Between Means = 110.7 t-Statistic = -0.9222 w/15.6 df
p = 0.3705
Which of these tests is appropriate for these data? Explain.Using the test you select,state your conclusion.
Unlock Deck
Unlock for access to all 35 flashcards in this deck.
Unlock Deck
k this deck
31
Ten different families are tested for the number of litres of water they use each week before and after viewing a conservation video.We want to see if there is strong evidence that the conservation video reduces people's water consumption rate.A t-test of the null hypothesis of no difference has a t-statistic of -2.894 with a P-value of 0.0089.State your conclusion regarding the hypotheses.If this conclusion is incorrect,which type of error was made?
Unlock Deck
Unlock for access to all 35 flashcards in this deck.
Unlock Deck
k this deck
32
The violent crime rate (number of violent crimes per 100,000 residents)is investigated for nine Canadian cities for the years 1990 and 2000 to see if there has been a change. Is there evidence that the violent crime rate has decreased? Suppose you had mistakenly treated these data as two independent samples instead of matched pairs.What would the significance test have found? Explain why the results are so different.
Is there evidence that the violent crime rate has decreased? Suppose you had mistakenly treated these data as two independent samples instead of matched pairs.What would the significance test have found? Explain why the results are so different. Unlock Deck
Unlock for access to all 35 flashcards in this deck.
Unlock Deck
k this deck
33
An agricultural company wants to know if a new insecticide would increase corn yields.They will use test plots to collect observations with and without the insecticide.If they want to estimate the mean increase with a margin of error of 1.2 bushels per acre,with 95% confidence,estimate the minimum number of test plots they need.A previous study showed that the standard deviation of the increases was about 2.9 bushels per acre.
A)23
B)16
C)8
D)63
E)39
A)23
B)16
C)8
D)63
E)39
Unlock Deck
Unlock for access to all 35 flashcards in this deck.
Unlock Deck
k this deck
34
An agricultural company wants to know if a new insecticide would increase corn yields.They will use test plots to collect observations with and without the insecticide.If they want to estimate the mean increase with a margin of error of 1.2 bushels per acre,with 99% confidence,estimate the minimum number of test plots they need.A previous study showed that the standard deviation of the increases was about 2.9 bushels per acre.
A)23
B)19
C)14
D)63
E)39
A)23
B)19
C)14
D)63
E)39
Unlock Deck
Unlock for access to all 35 flashcards in this deck.
Unlock Deck
k this deck
35
The prices of 100 common products was recorded from two major supermarkets (Market A and Market B).It was observed that out of the 100 products,51 products were more expensive at Market A,34 products were more expensive at Market B,and 15 products were the same price.Is the median difference in price between items at these supermarkets different from 0? Carry out a Sign Test.Use a significance level of 0.05.
Unlock Deck
Unlock for access to all 35 flashcards in this deck.
Unlock Deck
k this deck
Unlock Deck
Unlock for access to all 35 flashcards in this deck.


