Deck 5: The Standard Deviation As a Ruler and the Normal Model
Full screen (f)
Question
Question
Question
Question
Question
Question
Question
Question
Question
Question
Question
Question
Question
Question
Question
Question
Question
Question
Question
Question
Question
Question
Question
Question
Question
Question
Question
Question
Question
Question
Question
Question
Question
An English instructor gave a final exam and found a mean score of 69 points and a standard deviation of 5.8 points.Assume that a Normal model can be applied.Draw and label the Normal model for the exam scores.Then find the interval for the central 68% of the scores.
A) ; 57.4 to 80.6 points
B)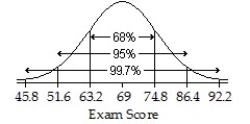 ; 63.2 to 74.8 points
C)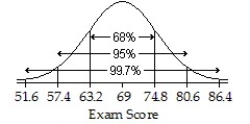 ; 63.2 to 74.8 points
D)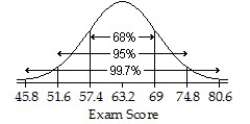 ; 57.4 to 69 points
E)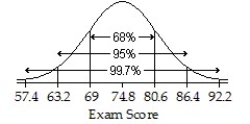 ; 69 to 80.6 points
A)
; 57.4 to 80.6 pointsB)
; 63.2 to 74.8 pointsC)
; 63.2 to 74.8 pointsD)
; 57.4 to 69 pointsE)
; 69 to 80.6 points Question
Question
The systolic blood pressure of women is normally distributed with a mean of and a standard deviation of Draw and label the Normal model for systolic blood pressure.What percentage of women have a systolic blood pressure between and
A)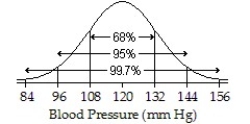 ; 95%
; 95%
B) ; 99.7%
C) ; 68%
; 68%
D) ; 34%
; 34%
E) ; 84%
; 84%
A)
; 95%B)
; 99.7%C)
; 68%D)
; 34%E)
; 84% Question
Question
The amount of Jen's monthly phone bill is normally distributed with a mean of $55 and a standard deviation of $8.Draw and label the Normal model for Jen's monthly phone bill.In what interval would you expect the central 68% of bills to be found?
A) ; $31 to $79
B) ; $39 to $71
C) ; $47 to $71
D)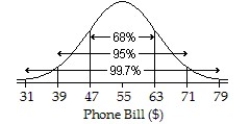 ; $47 to $63
E) ; $39 to $63
A)
; $31 to $79B)
; $39 to $71C)
; $47 to $71D)
; $47 to $63E)
; $39 to $63 Question
Question
Question
Question
Question
An English instructor gave a final exam and found a mean score of 70 points and a standard deviation of 6.8 points.Assume that a Normal model can be applied.Draw and label the Normal model for the exam scores.Describe the scores of the top 2.5%.
A)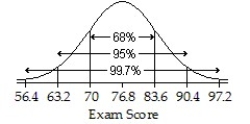 ; Higher than 90.4 points
B)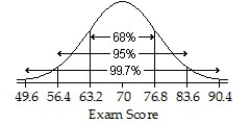 ; Higher than 76.8 points
C) ; 83.6 points
D) ; Higher than 83.6 points
E)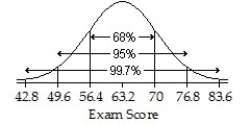 ; Higher than 76.8 points
A)
; Higher than 90.4 pointsB)
; Higher than 76.8 pointsC)
; 83.6 pointsD)
; Higher than 83.6 pointsE)
; Higher than 76.8 points Question
Question
Question
Question
Question
Question
An English instructor gave a final exam and found a mean score of 70 points and a standard deviation of 5.1 points.Assume that a Normal model can be applied.Draw and label the Normal model for the exam scores.Then find the percent of scores above 85.3 points.
A) ; 0.3%
B) ; 2.5%
C) ; 16%
; 16%
D) ; 0.15%
E)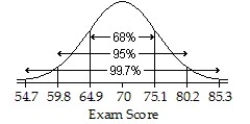 ; 5%
; 5%
A)
; 0.3%B)
; 2.5%C)
; 16%D)
; 0.15%E)
; 5% Question
Question
Assuming a Normal model applies,a town's average annual snowfall (in cm)is modeled by Draw and label the Normal model.What percent of snowfall is between 39 cm and 45 cm?
A) ; 81.5%
B) ; 41%
; 41%
C) ; 95%
; 95%
D)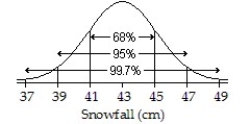 ; 68%
; 68%
E) ; 54.5%
A)
; 81.5%B)
; 41%C)
; 95%D)
; 68%E)
; 54.5% Question
Assuming a Normal model applies,a town's average annual snowfall (in cm)is modeled by Draw and label the Normal model.What percent of snowfall is between 52 cm and 59 cm?
A) ; 11%
; 11%
B) ; 13.5%
C) ; 32%
; 32%
D)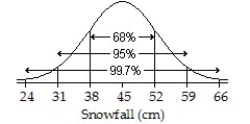 ; 16%
; 16%
E) ; 27%
; 27%
A)
; 11%B)
; 13.5%C)
; 32%D)
; 16%E)
; 27% Question
Question
Assuming a Normal model applies,a town's average annual snowfall (in cm)is modeled by Draw and label the Normal model.Then find the interval for the middle 95% of snowfall.
A)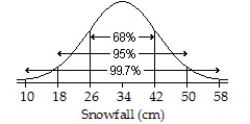 ; 18 to 50 cm
B) ; 34 to 50 cm
C)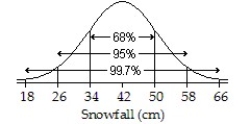 ; 26 to 58 cm
D)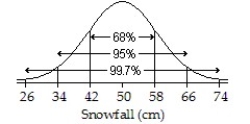 ; 34 to 66 cm
E) ; 18 to 66 cm
A)
; 18 to 50 cmB)
; 34 to 50 cmC)
; 26 to 58 cmD)
; 34 to 66 cmE)
; 18 to 66 cm Question
Question
Assuming a Normal model applies,a town's average annual snowfall (in cm)is modeled by Draw and label the Normal model.About what percent represents snowfall of less than 62 cm?
A) ; 0.15%
B) ; 2.5%
C)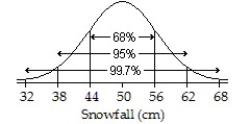 ; 84%
; 84%
D) ; 99.85%
E) ; 97.5%
A)
; 0.15%B)
; 2.5%C)
; 84%D)
; 99.85%E)
; 97.5% Question
Question
Question
An English instructor gave a final exam and found a mean score of 72 points and a standard deviation of 6.9 points.Assume that a Normal model can be applied.Draw and label the Normal model for the exam scores.What percent of scores should be between 85.8 and 92.7 points?
A) ; 5%
; 5%
B)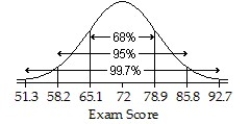 ; 2.5%
C) ; 2.35%
D) ; 4.7%
E) ; 35.9318841%
A)
; 5%B)
; 2.5%C)
; 2.35%D)
; 4.7%E)
; 35.9318841% Question
Question
Question
Question
Question
Question
Question
Question
Question
Question
Question
Question
Question
Question
Question
Question
Question
Question
Question
Question
Question
Question

Unlock Deck
Sign up to unlock the cards in this deck!
Unlock Deck
Unlock Deck
1/111
Play
Full screen (f)
Deck 5: The Standard Deviation As a Ruler and the Normal Model
1
The mean test score on a statistics test was 72 with a standard deviation of 10.How many standard deviations from the mean is a test score of 90?
A)1.80 standard deviations above the mean
B)1.80 standard deviations below the mean
C)0.69 standard deviations above the mean
D)0.80 standard deviations above the mean
E)0.69 standard deviations below the mean
A)1.80 standard deviations above the mean
B)1.80 standard deviations below the mean
C)0.69 standard deviations above the mean
D)0.80 standard deviations above the mean
E)0.69 standard deviations below the mean
1.80 standard deviations above the mean
2
Suppose that the average amount of sugar a person eats per year is 7 kg with a standard deviation of 1.5 kg.How many standard deviations from the mean is the consumption of 11 kg of sugar?
A)About 1.33 standard deviations above the mean
B)About 1.33 standard deviations below the mean
C)About 4.67 standard deviations above the mean
D)About 2.67 standard deviations above the mean
E)About 2.67 standard deviations below the mean
A)About 1.33 standard deviations above the mean
B)About 1.33 standard deviations below the mean
C)About 4.67 standard deviations above the mean
D)About 2.67 standard deviations above the mean
E)About 2.67 standard deviations below the mean
About 2.67 standard deviations above the mean
3
Adam played golf on Saturday and Sunday.He scored 82 both days.The scores of all golfers Saturday averaged 68 with a standard deviation of 17.The scores on Sunday averaged 81 with a standard deviation of 9.On which day did Adam do better compared with the other golfers? Explain.Note that the smaller the score the better in golf.
A)Sunday.A score of 82 Sunday is standard deviations from the mean while a score of 82 Saturday is standard deviations from the mean.
B)Sunday.A score of 82 Sunday is standard deviations from the mean while a score of 82 Saturday is standard deviations from the mean.
C)Saturday.A score of 82 Saturday is standard deviations from the mean while a score of 82 Sunday is standard deviations from the mean.
D)He did not do better either day,he scored the same.
E)Saturday.A score of 82 Saturday is standard deviations from the mean while a score of 82 Sunday is standard deviations from the mean.
Sunday.A score of 82 Sunday is standard deviations from the mean while a score of 82 Saturday is standard deviations from the mean.
4
The setter on your school's volleyball team averages 58 assists per match with a standard deviation of 6.How many standard deviations from the mean is an outing with 79 assists?
A)1.75 standard deviations below the mean
B)1.36 standard deviations below the mean
C)3.50 standard deviations below the mean
D)3.50 standard deviations above the mean
E)1.75 standard deviations above the mean
A)1.75 standard deviations below the mean
B)1.36 standard deviations below the mean
C)3.50 standard deviations below the mean
D)3.50 standard deviations above the mean
E)1.75 standard deviations above the mean
Unlock Deck
Unlock for access to all 111 flashcards in this deck.
Unlock Deck
k this deck
5
The average number of days absent per student per year at West Valley School is 16 days with a standard deviation of 5 days.How many standard deviations from the mean is of 6 absent days?
A)0.83 standard deviations above the mean
B)1.83 standard deviations below the mean
C)2.00 standard deviations above the mean
D)2.00 standard deviations below the mean
E)1.83 standard deviations above the mean
A)0.83 standard deviations above the mean
B)1.83 standard deviations below the mean
C)2.00 standard deviations above the mean
D)2.00 standard deviations below the mean
E)1.83 standard deviations above the mean
Unlock Deck
Unlock for access to all 111 flashcards in this deck.
Unlock Deck
k this deck
6
A basketball coach kept statistics for his team in free throw percentage and steals (among others).At the last game,Erin's free throw percentage was 79% and she had 4 steals.The team averaged 90% from the free throw line with a standard deviation of 6% and they averaged 7 steals with a standard deviation of 4.In which category did Erin do better compared with her team? Explain.
A)Steals.4 steals is - standard deviations from the mean while 79% free throw average is - standard deviations from the mean.
B)Free throw percentage.79% free throw average is - standard deviations from the mean while 4 steals is - standard deviations from the mean.
C)Free throw percentage.79% free throw average is - standard deviations from the mean while 4 steals is - standard deviations from the mean.
D)One can't compare the two categories,they are too different.
E)Steals.4 steals is - standard deviations from the mean while 79% free throw average is - standard deviations from the mean.
Unlock Deck
Unlock for access to all 111 flashcards in this deck.
Unlock Deck
k this deck
7
The average amount of sugar a person eats per year is 4 kg.A person who consumes 3.25 kg of sugar has a z-score of -0.75.Find the standard deviation.
A)4 kg
B)1 kg
C)0.1 kg
D)5 kg
E)10 kg
A)4 kg
B)1 kg
C)0.1 kg
D)5 kg
E)10 kg
Unlock Deck
Unlock for access to all 111 flashcards in this deck.
Unlock Deck
k this deck
8
The mean weights for medium navel oranges is 274 grams.Suppose that the standard deviation for the oranges is 92 grams.Which would be more likely,an orange weighing 392 grams or an orange weighing 137 grams? Explain.
A)A 137 gram orange is more likely (z = 1.49)compared with an orange weighing 392 grams (z = 4.24).
B)A 137 gram orange is more likely (z = -1.49)compared with an orange weighing 392 grams (z = 1.28).
C)A 137 gram orange is more likely (z = 1.28)compared with an orange weighing 392 grams (z = -1.49).
D)A 392 gram orange is more likely (z = -1.49)compared with an orange weighing 137 grams (z = 1.28).
E)A 392 gram orange is more likely (z = 1.28)compared with an orange weighing 137 grams (z = -1.49).
Unlock Deck
Unlock for access to all 111 flashcards in this deck.
Unlock Deck
k this deck
9
The mean weight of babies born in a hospital last year was 2.84 kg.Suppose the standard deviation of the weights is 0.95 kg.Which would be more unusual,a baby weighing 1.8 kg or a baby weighing 3.83 kg? Explain.
A)A 1.8 kg baby is more unusual (z = -1.09)compared with a 3.83 kg baby (z = 1.04).
B)A 3.83 kg baby is more unusual (z = 1.90)compared with a 1.8 kg baby (z = 4.05).
C)A 3.83 kg baby is more unusual (z = -1.09)compared with a 1.8 kg baby (z = -1.09).
D)A 1.8 kg baby is more unusual (z = -1.05)compared with a 3.83 kg baby (z = -1.04).
E)A 3.83 kg baby is more unusual (z = 1.04)compared with a 1.8 kg baby (z = -1.09).
Unlock Deck
Unlock for access to all 111 flashcards in this deck.
Unlock Deck
k this deck
10
Two different running shoe manufacturers market running shoes to first time marathon runners.Swift claims a mean shoe life of 600 km,while Enduramax claims a shoe life of 650 km.If the standard deviation for both shoes is 51 km,which shoe would you purchase before starting your marathon training (where you figure to run 500 km)? Explain.
A)Swift.Swift shoes are - standard deviations from the mean while Enduramax shoes are - standard deviations from the mean.
B)Enduramax.Enduramax shoes are - standard deviations from the mean while Swift shoes are - standard deviations from the mean.
C)Swift.I only need to run 500 km and the Swift will last 100 km beyond that.
D)Enduramax.Enduramax shoes are - standard deviations from the mean while Swift shoes are - standard deviations from the mean.
E)Swift.Swift shoes are - standard deviations from the mean while Enduramax shoes are - standard deviations from the mean.
Unlock Deck
Unlock for access to all 111 flashcards in this deck.
Unlock Deck
k this deck
11
The weights of children age two average 24 pounds with a standard deviation of 2 pounds.How many standard deviations from the mean is a weight of 17 pounds?
A)3.50 standard deviations below the mean
B)1.29 standard deviations above the mean
C)1.29 standard deviations below the mean
D)1.41 standard deviations above the mean
E)3.50 standard deviations above the mean
A)3.50 standard deviations below the mean
B)1.29 standard deviations above the mean
C)1.29 standard deviations below the mean
D)1.41 standard deviations above the mean
E)3.50 standard deviations above the mean
Unlock Deck
Unlock for access to all 111 flashcards in this deck.
Unlock Deck
k this deck
12
Mario's poker winnings average $319 per week with a standard deviation of $56.How many standard deviations from the mean is winning $195?
A)About 1.11 standard deviations below the mean
B)About 2.21 standard deviations above the mean
C)About 1.64 standard deviations below the mean
D)About 2.21 standard deviations below the mean
E)About 1.11 standard deviations above the mean
A)About 1.11 standard deviations below the mean
B)About 2.21 standard deviations above the mean
C)About 1.64 standard deviations below the mean
D)About 2.21 standard deviations below the mean
E)About 1.11 standard deviations above the mean
Unlock Deck
Unlock for access to all 111 flashcards in this deck.
Unlock Deck
k this deck
13
The average size of forest fires last year was 968 acres with a standard deviation of 182 acres.How many standard deviations from the mean is a forest fire consuming 245 acres?
A)About 3.97 standard deviations below the mean
B)About 1.35 standard deviations above the mean
C)About 3.97 standard deviations above the mean
D)About 1.99 standard deviations below the mean
E)About 1.99 standard deviations above the mean
A)About 3.97 standard deviations below the mean
B)About 1.35 standard deviations above the mean
C)About 3.97 standard deviations above the mean
D)About 1.99 standard deviations below the mean
E)About 1.99 standard deviations above the mean
Unlock Deck
Unlock for access to all 111 flashcards in this deck.
Unlock Deck
k this deck
14
A town's snowfall in December averages 10 cm with a standard deviation of 10 cm while in February,the average snowfall is 42 cm with a standard deviation of 16 cm.In which month is it more likely to snow 32 cm? Explain.
A)February.Snowfall of 32 cm is from the mean while snowfall of 32 cm is - from the mean in December.
B)December.Snowfall of 32 cm is - from the mean while snowfall of 32 cm is from the mean in February.
C)It is equally likely in either month.One can't predict Mother Nature.
D)December.Snowfall of 32 cm is from the mean while snowfall of 32 cm is - from the mean in February.
E)February.Snowfall of 32 cm is - from the mean while snowfall of 32 cm is from the mean in December.
Unlock Deck
Unlock for access to all 111 flashcards in this deck.
Unlock Deck
k this deck
15
Two different running shoe manufacturers market running shoes to first time marathon runners.Swift claims a mean shoe life of 600 km,while Enduramax claims a shoe life of 650 km.If the standard deviation for Swift shoes is 54 km and 124 km for Enduramax,which shoe would you purchase before starting your marathon training (where you figure to run 500 km)? Explain.
A)Enduramax.Enduramax shoes are - standard deviations from the mean while Swift shoes are - standard deviations from the mean.
B)Enduramax.The Enduramax shoes have a longer mean shoe life.
C)Swift.Swift shoes are - standard deviations from the mean while Enduramax shoes are - standard deviations from the mean.
D)Swift.Swift shoes are - standard deviations from the mean while Enduramax shoes are - standard deviations from the mean.
E)Enduramax.Enduramax shoes are - standard deviations from the mean while Swift shoes are - standard deviations from the mean.
Unlock Deck
Unlock for access to all 111 flashcards in this deck.
Unlock Deck
k this deck
16
You heard that the average number of years of experience among stockbrokers is 14 years.You can't remember the standard deviation somebody with 8 years' experience has a z-score of -2.Find the standard deviation.
A)3 years
B)9 months
C)6 months
D)9 years
E)3 months
A)3 years
B)9 months
C)6 months
D)9 years
E)3 months
Unlock Deck
Unlock for access to all 111 flashcards in this deck.
Unlock Deck
k this deck
17
The average number of average number of hours per day a university student spends on homework is 5 hours with a standard deviation of 1.25 hours.How many standard deviations from the mean is 2 hours spent on homework?
A)2.40 standard deviations below the mean
B)1.20 standard deviations below the mean
C)2.50 standard deviations above the mean
D)1.20 standard deviations above the mean
E)2.40 standard deviations above the mean
A)2.40 standard deviations below the mean
B)1.20 standard deviations below the mean
C)2.50 standard deviations above the mean
D)1.20 standard deviations above the mean
E)2.40 standard deviations above the mean
Unlock Deck
Unlock for access to all 111 flashcards in this deck.
Unlock Deck
k this deck
18
A town's average snowfall is 40 cm per year with a standard deviation of 12 cm.How many standard deviations from the mean is a snowfall of 64 cm?
A)0.44 standard deviations below the mean
B)2.00 standard deviations above the mean
C)2.00 standard deviations below the mean
D)1.60 standard deviations above the mean
E)0.44 standard deviations above the mean
A)0.44 standard deviations below the mean
B)2.00 standard deviations above the mean
C)2.00 standard deviations below the mean
D)1.60 standard deviations above the mean
E)0.44 standard deviations above the mean
Unlock Deck
Unlock for access to all 111 flashcards in this deck.
Unlock Deck
k this deck
19
The average number of babies born in a certain town each year is 218 with a standard deviation of 26.How many standard deviations from the mean is a year with 387 babies born?
A)3.25 standard deviations below the mean
B)6.50 standard deviations above the mean
C)3.25 standard deviations above the mean
D)6.50 standard deviations below the mean
E)1.78 standard deviations above the mean
A)3.25 standard deviations below the mean
B)6.50 standard deviations above the mean
C)3.25 standard deviations above the mean
D)6.50 standard deviations below the mean
E)1.78 standard deviations above the mean
Unlock Deck
Unlock for access to all 111 flashcards in this deck.
Unlock Deck
k this deck
20
The local basketball team averages 65% from the free throw line.A player who makes 72.5% of his free throws has a z-score of 1.5.Find the standard deviation.
A)5%
B)15%
C)3%
D)1%
E)10%
A)5%
B)15%
C)3%
D)1%
E)10%
Unlock Deck
Unlock for access to all 111 flashcards in this deck.
Unlock Deck
k this deck
21
The average amount of snowfall in a certain town is 54 cm per year.Last year's snowfall was 67.5 cm which corresponded to a z-score of 1.5.Find the standard deviation.
A)5 cm
B)30 cm
C)9 cm
D)20 cm
E)1 cm
A)5 cm
B)30 cm
C)9 cm
D)20 cm
E)1 cm
Unlock Deck
Unlock for access to all 111 flashcards in this deck.
Unlock Deck
k this deck
22
On an exam Bob scored 75% and was 1.5 standard deviations above the mean of 63%.What was the standard deviation?
A)12%
B)18%
C)16%
D)8%
E)1.5%
A)12%
B)18%
C)16%
D)8%
E)1.5%
Unlock Deck
Unlock for access to all 111 flashcards in this deck.
Unlock Deck
k this deck
23
The speed vehicles traveled on a local road was recorded for one month.The speeds ranged from 48 km/h to 63 km/h with a mean speed of 57 km/h and a standard deviation of 6 km/h.The quartiles and median speeds were 51 km/h,60 km/h,and 54 km/h.Suppose increased patrols reduced speeds by 7%.Find the new mean and standard deviation.Express your answer in exact decimals.
A)Mean: 53.01 km/h,SD: 5.58 km/h
B)Mean: 53.01 km/h,SD: 6 km/h
C)Mean: 60.99 km/h,SD: 6.42 km/h
D)Mean: 3.99 km/h,SD: 0.42 km/h
E)Mean: 60.99 km/h,SD: 6 km/h
A)Mean: 53.01 km/h,SD: 5.58 km/h
B)Mean: 53.01 km/h,SD: 6 km/h
C)Mean: 60.99 km/h,SD: 6.42 km/h
D)Mean: 3.99 km/h,SD: 0.42 km/h
E)Mean: 60.99 km/h,SD: 6 km/h
Unlock Deck
Unlock for access to all 111 flashcards in this deck.
Unlock Deck
k this deck
24
Here are some summary statistics for annual snowfall in a certain town compiled over the last 15 years: lowest cm, cm, cm, cm, standard cm.Suppose snowfall was tracked for 5 additional years and the annual snowfall was found to increase by 20%.Find the new mean and standard deviation.
A)Mean: 9.4 cm,SD: 2 cm
B)Mean: 37.6 cm,SD: 10 cm
C)Mean: 56.4 cm,SD: 10 cm
D)Mean: 37.6 cm,SD: 8 cm
E)Mean: 56.4 cm,SD: 12 cm
A)Mean: 9.4 cm,SD: 2 cm
B)Mean: 37.6 cm,SD: 10 cm
C)Mean: 56.4 cm,SD: 10 cm
D)Mean: 37.6 cm,SD: 8 cm
E)Mean: 56.4 cm,SD: 12 cm
Unlock Deck
Unlock for access to all 111 flashcards in this deck.
Unlock Deck
k this deck
25
The average weight of a newborn infant is 2.7 kg.An infant that weighs 3.15 kg has a z-score of 1.Find the standard deviation.
A)0.05 kg
B)0.14 kg
C)1.35 kg
D)0.45 kg
E)2.7 kg
A)0.05 kg
B)0.14 kg
C)1.35 kg
D)0.45 kg
E)2.7 kg
Unlock Deck
Unlock for access to all 111 flashcards in this deck.
Unlock Deck
k this deck
26
The free throw percentages for the participants of a basketball tournament were compiled.The percents ranged from 40% to 96% with a mean of 53% and a standard deviation of 8%.The quartiles and median percentages were 50%,84%,and 53%.This year's tournament percentages are 3% higher than last year's tournament percentages.Find last year's tournament mean,median,and standard deviation of the free throw percentages.
A)Mean: 56%,median: 56%,SD: 11%
B)Mean: 53%,median: 56%,SD: 11%
C)Mean: 51.5%,median: 53%,SD: 7.8%
D)Mean: 51.5%,median: 54.4%,SD: 7.8%
E)Mean: 50%,median: 50%,SD: 5%
A)Mean: 56%,median: 56%,SD: 11%
B)Mean: 53%,median: 56%,SD: 11%
C)Mean: 51.5%,median: 53%,SD: 7.8%
D)Mean: 51.5%,median: 54.4%,SD: 7.8%
E)Mean: 50%,median: 50%,SD: 5%
Unlock Deck
Unlock for access to all 111 flashcards in this deck.
Unlock Deck
k this deck
27
Here are some summary statistics for last year's basketball team scoring output: lowest points, points, points, points, standard points.Suppose the opponents' scoring output was 10% lower.Find the opponents' mean and standard deviation.
A)Mean: 52.2 points,SD: 8.1 points
B)Mean: 52.2 points,SD: 9 points
C)Mean: 63.8 points,SD: 9.9 points
D)Mean: 63.8 points,SD: 9 points
E)Mean: 5.8 points,SD: 0.9 points
A)Mean: 52.2 points,SD: 8.1 points
B)Mean: 52.2 points,SD: 9 points
C)Mean: 63.8 points,SD: 9.9 points
D)Mean: 63.8 points,SD: 9 points
E)Mean: 5.8 points,SD: 0.9 points
Unlock Deck
Unlock for access to all 111 flashcards in this deck.
Unlock Deck
k this deck
28
Here are the summary statistics for the monthly payroll for an accounting firm: median = $100,000,range = $240,000, IQR = $120,000, standard deviation = $80,000.
Suppose that business has been good and the company gives every employee a raise.Give the new value of each of the summary statistics.
A)Minimum: 60,000; Mean: 140,000; Median: 100,000; Range: 240,000; IQR: 120,000; Q1: 80,000; SD: 80,000
B)Minimum: 70,000; Mean: 150,000; Median: 100,000; Range: 240,000; IQR: 120,000; Q1: 80,000; SD: 80,000
C)Minimum: 70,000; Mean: 140,000; Median: 110,000; Range: 240,000; IQR: 120,000; Q1: 80,000; SD: 80,000
D)Minimum: 70,000; Mean: 150,000; Median: 110,000; Range: 240,000; IQR: 120,000; Q1: 80,000; SD: 80,000
E)Minimum: 60,000; Mean: 150,000; Median: 110,000; Range: 240,000; IQR: 120,000; Q1: 80,000; SD: 80,000
Unlock Deck
Unlock for access to all 111 flashcards in this deck.
Unlock Deck
k this deck
29
A family of four averages 85 loads of laundry per month.One such family does 62 loads per month and has a z-score of -2.3.Find the standard deviation.
A)20 loads
B)10 loads
C)1 load
D)2 loads
E)3 loads
A)20 loads
B)10 loads
C)1 load
D)2 loads
E)3 loads
Unlock Deck
Unlock for access to all 111 flashcards in this deck.
Unlock Deck
k this deck
30
The average attendance for your local hockey team is 450,000 per game.The attendance during the last game was only 320,000 which corresponded to a z-score of -16.25.Find the standard deviation.
A)1000 people
B)17,000 people
C)3000 people
D)20,000 people
E)8000 people
A)1000 people
B)17,000 people
C)3000 people
D)20,000 people
E)8000 people
Unlock Deck
Unlock for access to all 111 flashcards in this deck.
Unlock Deck
k this deck
31
The average speed cars travel on a road is 77 km/h.A car travelling 60 km/h has a z-score of -1.7.Find the standard deviation.
A)40 km/h
B)10 km/h
C)30 km/h
D)0.5 km/h
E)1 km/h
A)40 km/h
B)10 km/h
C)30 km/h
D)0.5 km/h
E)1 km/h
Unlock Deck
Unlock for access to all 111 flashcards in this deck.
Unlock Deck
k this deck
32
Here are some statistics for the annual Wildcat golf tournament: lowest mean median = 103,range = 92,IQR = 110, standard Suppose it was very windy and all the golfers' scores went up by 7 strokes.Tell the new value for each of the summary statistics.
A)Lowest score: 65,mean: 102,median: 110,range: 92,IQR: 110,Q1: 45,SD: 15
B)Lowest score: 65,mean: 102,median: 110,range: 85,IQR: 110,Q1: 45,SD: 15
C)Lowest score: 65,mean: 102,median: 110,range: 85,IQR: 117,Q1: 45,SD: 15
D)Lowest score: 65,mean: 95,median: 103,range: 85,IQR: 110,Q1: 45,SD: 15
E)Lowest score: 65,mean: 102,median: 110,range: 85,IQR: 110,Q1: 45,SD: 22
Unlock Deck
Unlock for access to all 111 flashcards in this deck.
Unlock Deck
k this deck
33
An English instructor gave a final exam and found a mean score of 69 points and a standard deviation of 5.8 points.Assume that a Normal model can be applied.Draw and label the Normal model for the exam scores.Then find the interval for the central 68% of the scores.
A) ; 57.4 to 80.6 points
B) ; 63.2 to 74.8 points
C) ; 63.2 to 74.8 points
D) ; 57.4 to 69 points
E) ; 69 to 80.6 points
A)
; 57.4 to 80.6 pointsB)
; 63.2 to 74.8 pointsC)
; 63.2 to 74.8 pointsD)
; 57.4 to 69 pointsE)
; 69 to 80.6 points Unlock Deck
Unlock for access to all 111 flashcards in this deck.
Unlock Deck
k this deck
34
Here are some summary statistics for the size of forest fires last year: smallest acres, acres, acres, acres, standard acres.If it costs $1200 per acre to fight the fires,find the minimum,median,standard deviation,and IQR of the cost.
A)Minimum: 1292; median: 1662; SD: 1257; IQR: 1575
B)Minimum: 92; median: 462; SD: 57; IQR: 375
C)Minimum: 110,400; median: 554,400; SD: 68,400; IQR: 450,000
D)Minimum: 110,400; median: 462; SD: 68,400; IQR: 375
E)Minimum: 110,400; median: 554,400; SD: 57; IQR: 375
A)Minimum: 1292; median: 1662; SD: 1257; IQR: 1575
B)Minimum: 92; median: 462; SD: 57; IQR: 375
C)Minimum: 110,400; median: 554,400; SD: 68,400; IQR: 450,000
D)Minimum: 110,400; median: 462; SD: 68,400; IQR: 375
E)Minimum: 110,400; median: 554,400; SD: 57; IQR: 375
Unlock Deck
Unlock for access to all 111 flashcards in this deck.
Unlock Deck
k this deck
35
The systolic blood pressure of women is normally distributed with a mean of and a standard deviation of Draw and label the Normal model for systolic blood pressure.What percentage of women have a systolic blood pressure between and
A) ; 95%
B) ; 99.7%
C) ; 68%
D) ; 34%
E) ; 84%
A)
; 95%B)
; 99.7%C)
; 68%D)
; 34%E)
; 84% Unlock Deck
Unlock for access to all 111 flashcards in this deck.
Unlock Deck
k this deck
36
Here are some summary statistics for the recent English exam: lowest mean standard Suppose the students did not study for the exam and each score went down 15%.Tell the new value for each of the summary statistics.Express your answer in exact decimals.
A)Lowest score: 35.65,mean: 75.9,median: 92.23,range: 90.85,IQR: 66.7,Q1: 22.1, SD: 9.545
B)Lowest score: 26.35,mean: 56.1,median: 68.17,range: 79,IQR: 49.3,Q1: 22.1,SD: 7.055
C)Lowest score: 26.35,mean: 56.1,median: 68.17,range: 67.15,IQR: 49.3,Q1: 22.1, SD: 7.055
D)Lowest score: 4.65,mean: 9.9,median: 12.03,range: 11.85,IQR: 8.7,Q1: 22.1,SD: 1.245
E)Lowest score: 26.35,mean: 56.1,median: 68.17,range: 79,IQR: 58,Q1: 22.1,SD: 7.055
Unlock Deck
Unlock for access to all 111 flashcards in this deck.
Unlock Deck
k this deck
37
The amount of Jen's monthly phone bill is normally distributed with a mean of $55 and a standard deviation of $8.Draw and label the Normal model for Jen's monthly phone bill.In what interval would you expect the central 68% of bills to be found?
A) ; $31 to $79
B) ; $39 to $71
C) ; $47 to $71
D) ; $47 to $63
E) ; $39 to $63
A)
; $31 to $79B)
; $39 to $71C)
; $47 to $71D)
; $47 to $63E)
; $39 to $63 Unlock Deck
Unlock for access to all 111 flashcards in this deck.
Unlock Deck
k this deck
38
Here are some summary statistics for all of the runners in a local 12 kilometre race: slowest minutes, minutes, minutes, minutes, standard minutes.Suppose last year's race results were better by 8%.Find last year's mean and standard deviation.Express your answer in exact decimals.
A)Mean: 6.32 minutes,SD: 0.88 minutes
B)Mean: 85.32 minutes,SD: 11 minutes
C)Mean: 85.32 minutes,SD: 11.88 minutes
D)Mean: 72.68 minutes,SD: 10.12 minutes
E)Mean: 72.68 minutes,SD: 11 minutes
A)Mean: 6.32 minutes,SD: 0.88 minutes
B)Mean: 85.32 minutes,SD: 11 minutes
C)Mean: 85.32 minutes,SD: 11.88 minutes
D)Mean: 72.68 minutes,SD: 10.12 minutes
E)Mean: 72.68 minutes,SD: 11 minutes
Unlock Deck
Unlock for access to all 111 flashcards in this deck.
Unlock Deck
k this deck
39
A salesman's commission averages $23,700 per year.Last year his commission was $18,900 which corresponded to a z-score of -1.2.Find the standard deviation.
A)$10,000
B)$500
C)$15,000
D)$1000
E)$4000
A)$10,000
B)$500
C)$15,000
D)$1000
E)$4000
Unlock Deck
Unlock for access to all 111 flashcards in this deck.
Unlock Deck
k this deck
40
The average score on a mathematics test was 64%.A student who scored 80% had a z-score of 2.Find the standard deviation.
A)16%
B)8%
C)3%
D)20%
E)1%
A)16%
B)8%
C)3%
D)20%
E)1%
Unlock Deck
Unlock for access to all 111 flashcards in this deck.
Unlock Deck
k this deck
41
-2.41 < z < 0
A)49.10%
B)9.48%
C)52.16%
D)50.80%
E)49.20%
A)49.10%
B)9.48%
C)52.16%
D)50.80%
E)49.20%
Unlock Deck
Unlock for access to all 111 flashcards in this deck.
Unlock Deck
k this deck
42
An English instructor gave a final exam and found a mean score of 70 points and a standard deviation of 6.8 points.Assume that a Normal model can be applied.Draw and label the Normal model for the exam scores.Describe the scores of the top 2.5%.
A) ; Higher than 90.4 points
B) ; Higher than 76.8 points
C) ; 83.6 points
D) ; Higher than 83.6 points
E) ; Higher than 76.8 points
A)
; Higher than 90.4 pointsB)
; Higher than 76.8 pointsC)
; 83.6 pointsD)
; Higher than 83.6 pointsE)
; Higher than 76.8 points Unlock Deck
Unlock for access to all 111 flashcards in this deck.
Unlock Deck
k this deck
43
The lengths of human pregnancies can be described by a Normal model with a mean of 268 days and a standard deviation of 15 days.What percentage can we expect for a pregnancy that will last at least 300 days?
A)98.34%
B)1.66%
C)1.79%
D)48.34%
E)1.99%
A)98.34%
B)1.66%
C)1.79%
D)48.34%
E)1.99%
Unlock Deck
Unlock for access to all 111 flashcards in this deck.
Unlock Deck
k this deck
44
For a recent English exam,use the Normal model N(73,9.2)to find the percent of scores between 56 and 87.Round to the nearest tenth of a percent.
A)90.4%
B)3.2%
C)3.37%
D)9.7%
E)96.6%
A)90.4%
B)3.2%
C)3.37%
D)9.7%
E)96.6%
Unlock Deck
Unlock for access to all 111 flashcards in this deck.
Unlock Deck
k this deck
45
The test scores from a recent Mathematics test are as follows: 95.5,65.9,93.2,88.6,56.8,50,86.4,54.5,40.9,77.3,79.5,65.9,70.5,77.3,81.8,50,79.5,and 68.2.The mean score was 71.2 with a standard deviation of 15.5.If the Normal model is appropriate,what percent of the scores will be less than 40.2?
A)0.15%
B)10%
C)5%
D)15.87%
E)2.28%
A)0.15%
B)10%
C)5%
D)15.87%
E)2.28%
Unlock Deck
Unlock for access to all 111 flashcards in this deck.
Unlock Deck
k this deck
46
A town's average snowfall is 45 cm per year with a standard deviation of 9 cm.Using a Normal model,what values should border the middle 68% of the model?
A)49.5 cm and 40.5 cm
B)45 cm and 41.94 cm
C)54 cm and 36 cm
D)63 cm and 27 cm
E)46.8 cm and 43.2 cm
A)49.5 cm and 40.5 cm
B)45 cm and 41.94 cm
C)54 cm and 36 cm
D)63 cm and 27 cm
E)46.8 cm and 43.2 cm
Unlock Deck
Unlock for access to all 111 flashcards in this deck.
Unlock Deck
k this deck
47
The test scores from a recent Mathematics test are as follows: 95.5,65.9,93.2,88.6,56.8,50,86.4,54.5,40.9,77.3,79.5,65.9,70.5,77.3,81.8,50,79.5,and 68.2.The mean score was 71.2 with a standard deviation of 15.5.If the Normal model is appropriate,what percent of the scores will be greater than 86.7?
A)15.87%
B)0.15%
C)10%
D)34%
E)2.28%
A)15.87%
B)0.15%
C)10%
D)34%
E)2.28%
Unlock Deck
Unlock for access to all 111 flashcards in this deck.
Unlock Deck
k this deck
48
An English instructor gave a final exam and found a mean score of 70 points and a standard deviation of 5.1 points.Assume that a Normal model can be applied.Draw and label the Normal model for the exam scores.Then find the percent of scores above 85.3 points.
A) ; 0.3%
B) ; 2.5%
C) ; 16%
D) ; 0.15%
E) ; 5%
A)
; 0.3%B)
; 2.5%C)
; 16%D)
; 0.15%E)
; 5% Unlock Deck
Unlock for access to all 111 flashcards in this deck.
Unlock Deck
k this deck
49
For a recent English exam,use the Normal model N(73,9.2)to find the percent of scores under 58.Round to the nearest tenth of a percent.
A)94.8%
B)4.2%
C)95.8%
D)1.63%
E)5.2%
A)94.8%
B)4.2%
C)95.8%
D)1.63%
E)5.2%
Unlock Deck
Unlock for access to all 111 flashcards in this deck.
Unlock Deck
k this deck
50
Assuming a Normal model applies,a town's average annual snowfall (in cm)is modeled by Draw and label the Normal model.What percent of snowfall is between 39 cm and 45 cm?
A) ; 81.5%
B) ; 41%
C) ; 95%
D) ; 68%
E) ; 54.5%
A)
; 81.5%B)
; 41%C)
; 95%D)
; 68%E)
; 54.5% Unlock Deck
Unlock for access to all 111 flashcards in this deck.
Unlock Deck
k this deck
51
Assuming a Normal model applies,a town's average annual snowfall (in cm)is modeled by Draw and label the Normal model.What percent of snowfall is between 52 cm and 59 cm?
A) ; 11%
B) ; 13.5%
C) ; 32%
D) ; 16%
E) ; 27%
A)
; 11%B)
; 13.5%C)
; 32%D)
; 16%E)
; 27% Unlock Deck
Unlock for access to all 111 flashcards in this deck.
Unlock Deck
k this deck
52
0 < z < 3.01
A)99.87%
B)43.67%
C)49.87%
D)12.17%
E)50.13%
A)99.87%
B)43.67%
C)49.87%
D)12.17%
E)50.13%
Unlock Deck
Unlock for access to all 111 flashcards in this deck.
Unlock Deck
k this deck
53
Assuming a Normal model applies,a town's average annual snowfall (in cm)is modeled by Draw and label the Normal model.Then find the interval for the middle 95% of snowfall.
A) ; 18 to 50 cm
B) ; 34 to 50 cm
C) ; 26 to 58 cm
D) ; 34 to 66 cm
E) ; 18 to 66 cm
A)
; 18 to 50 cmB)
; 34 to 50 cmC)
; 26 to 58 cmD)
; 34 to 66 cmE)
; 18 to 66 cm Unlock Deck
Unlock for access to all 111 flashcards in this deck.
Unlock Deck
k this deck
54
The volumes of soda in 1 litre cola bottle can be described by a Normal model with a mean of 0.95 L and a standard deviation of 0.04 L.What percentage of bottles can we expect to have a volume less than 0.94 L?
A)40.13%
B)9.87%
C)47.15%
D)38.21%
E)59.87%
A)40.13%
B)9.87%
C)47.15%
D)38.21%
E)59.87%
Unlock Deck
Unlock for access to all 111 flashcards in this deck.
Unlock Deck
k this deck
55
Assuming a Normal model applies,a town's average annual snowfall (in cm)is modeled by Draw and label the Normal model.About what percent represents snowfall of less than 62 cm?
A) ; 0.15%
B) ; 2.5%
C) ; 84%
D) ; 99.85%
E) ; 97.5%
A)
; 0.15%B)
; 2.5%C)
; 84%D)
; 99.85%E)
; 97.5% Unlock Deck
Unlock for access to all 111 flashcards in this deck.
Unlock Deck
k this deck
56
For a recent English exam,use the Normal model N(73,9.2)to find the percent of scores over 85.Round to the nearest tenth of a percent.
A)88.5%
B)90.3%
C)9.7%
D)8.1%
E)11.5%
A)88.5%
B)90.3%
C)9.7%
D)8.1%
E)11.5%
Unlock Deck
Unlock for access to all 111 flashcards in this deck.
Unlock Deck
k this deck
57
A town's average snowfall is 40 cm per year with a standard deviation of 5 cm.According to the Normal model,what percent of snowfall is less than 3 standard deviations from the mean?
A)15.87%
B)99.74%
C)5%
D)2.28%
E)0.26%
A)15.87%
B)99.74%
C)5%
D)2.28%
E)0.26%
Unlock Deck
Unlock for access to all 111 flashcards in this deck.
Unlock Deck
k this deck
58
An English instructor gave a final exam and found a mean score of 72 points and a standard deviation of 6.9 points.Assume that a Normal model can be applied.Draw and label the Normal model for the exam scores.What percent of scores should be between 85.8 and 92.7 points?
A) ; 5%
B) ; 2.5%
C) ; 2.35%
D) ; 4.7%
E) ; 35.9318841%
A)
; 5%B)
; 2.5%C)
; 2.35%D)
; 4.7%E)
; 35.9318841% Unlock Deck
Unlock for access to all 111 flashcards in this deck.
Unlock Deck
k this deck
59
z < 1.13
A)89.07%
B)87.08%
C)12.92%
D)84.85%
E)88.09%
A)89.07%
B)87.08%
C)12.92%
D)84.85%
E)88.09%
Unlock Deck
Unlock for access to all 111 flashcards in this deck.
Unlock Deck
k this deck
60
A bank's loan officer rates applicants for credit.The ratings can be described by a Normal model with a mean of 200 and a standard deviation of 50.If an applicant is randomly selected,what percentage can be expected to be between 200 and 275?
A)6.68%
B)43.32%
C)93.32%
D)42.37%
E)5.00%
A)6.68%
B)43.32%
C)93.32%
D)42.37%
E)5.00%
Unlock Deck
Unlock for access to all 111 flashcards in this deck.
Unlock Deck
k this deck
61
For a recent English exam,use the Normal model N(73,9.2)to find the score that represents the 60th percentile.
A)75.3
B)70.7
C)82.2
D)63.8
E)43.8
A)75.3
B)70.7
C)82.2
D)63.8
E)43.8
Unlock Deck
Unlock for access to all 111 flashcards in this deck.
Unlock Deck
k this deck
62
the lowest 4%
A)-1.48
B)-1.89
C)-1.75
D)-1.63
E)1.75
A)-1.48
B)-1.89
C)-1.75
D)-1.63
E)1.75
Unlock Deck
Unlock for access to all 111 flashcards in this deck.
Unlock Deck
k this deck
63
For a recent English exam,use the Normal model N(73,9.2)to find the score that represents the 90th percentile.
A)63.8
B)61.2
C)81.3
D)84.8
E)82.2
A)63.8
B)61.2
C)81.3
D)84.8
E)82.2
Unlock Deck
Unlock for access to all 111 flashcards in this deck.
Unlock Deck
k this deck
64
the lowest 40%
A)0.50
B)0.57
C)-0.57
D)0.25
E)-0.25
A)0.50
B)0.57
C)-0.57
D)0.25
E)-0.25
Unlock Deck
Unlock for access to all 111 flashcards in this deck.
Unlock Deck
k this deck
65
z > 0.59
A)25.47%
B)72.24%
C)22.24%
D)27.76%
E)21.90%
A)25.47%
B)72.24%
C)22.24%
D)27.76%
E)21.90%
Unlock Deck
Unlock for access to all 111 flashcards in this deck.
Unlock Deck
k this deck
66
the lowest 96%
A)-1.75
B)1.03
C)-1.38
D)1.82
E)1.75
A)-1.75
B)1.03
C)-1.38
D)1.82
E)1.75
Unlock Deck
Unlock for access to all 111 flashcards in this deck.
Unlock Deck
k this deck
67
z < 0.97
A)80.78%
B)82.35%
C)83.40%
D)16.60%
E)83.15%
A)80.78%
B)82.35%
C)83.40%
D)16.60%
E)83.15%
Unlock Deck
Unlock for access to all 111 flashcards in this deck.
Unlock Deck
k this deck
68
the highest 86%
A)-1.08
B)0.8051
C)1.08
D)0.5557
E)-1.02
A)-1.08
B)0.8051
C)1.08
D)0.5557
E)-1.02
Unlock Deck
Unlock for access to all 111 flashcards in this deck.
Unlock Deck
k this deck
69
the highest 7%
A)-1.48
B)1.45
C)1.48
D)1.26
E)1.39
A)-1.48
B)1.45
C)1.48
D)1.26
E)1.39
Unlock Deck
Unlock for access to all 111 flashcards in this deck.
Unlock Deck
k this deck
70
-0.55 < z < 0.55
A)41.76%
B)-90.00%
C)90.00%
D)-41.76%
E)43.57%
A)41.76%
B)-90.00%
C)90.00%
D)-41.76%
E)43.57%
Unlock Deck
Unlock for access to all 111 flashcards in this deck.
Unlock Deck
k this deck
71
-0.73 < z < 2.27
A)76.47%
B)154.00%
C)48.84%
D)75.57%
E)22.11%
A)76.47%
B)154.00%
C)48.84%
D)75.57%
E)22.11%
Unlock Deck
Unlock for access to all 111 flashcards in this deck.
Unlock Deck
k this deck
72
For a recent English exam,use the Normal model N(73,9.2)to find the score that represents the 30th percentile.
A)82.2
B)63.8
C)77.8
D)68.2
E)61.2
A)82.2
B)63.8
C)77.8
D)68.2
E)61.2
Unlock Deck
Unlock for access to all 111 flashcards in this deck.
Unlock Deck
k this deck
73
Based on the Normal model for snowfall in a certain town N(57,8),how many cm of snow would represent the 25th percentile?
A)51.6 cm
B)65 cm
C)49 cm
D)62.4 cm
E)14.3 cm
A)51.6 cm
B)65 cm
C)49 cm
D)62.4 cm
E)14.3 cm
Unlock Deck
Unlock for access to all 111 flashcards in this deck.
Unlock Deck
k this deck
74
0.7 < z < 1.98
A)-21.81%
B)21.75%
C)23.45%
D)173.41%
E)21.81%
A)-21.81%
B)21.75%
C)23.45%
D)173.41%
E)21.81%
Unlock Deck
Unlock for access to all 111 flashcards in this deck.
Unlock Deck
k this deck
75
-1.10 < z < -0.36
A)24.57%
B)-22.37%
C)22.37%
D)49.51%
E)22.39%
A)24.57%
B)-22.37%
C)22.37%
D)49.51%
E)22.39%
Unlock Deck
Unlock for access to all 111 flashcards in this deck.
Unlock Deck
k this deck
76
the highest 9%
A)-1.34
B)1.39
C)1.26
D)1.34
E)1.45
A)-1.34
B)1.39
C)1.26
D)1.34
E)1.45
Unlock Deck
Unlock for access to all 111 flashcards in this deck.
Unlock Deck
k this deck
77
the middle 96%
A)0 to 2.05
B)-2.33 to 2.33
C)-3.00 to 3.00
D)-1.75 to 1.75
E)-2.05 to 2.05
A)0 to 2.05
B)-2.33 to 2.33
C)-3.00 to 3.00
D)-1.75 to 1.75
E)-2.05 to 2.05
Unlock Deck
Unlock for access to all 111 flashcards in this deck.
Unlock Deck
k this deck
78
the middle 87.4%
A)-1.46 to 1.46
B)-1.45 to 1.45
C)-1.39 to 1.39
D)-1.53 to 1.53
E)-1.00 to 1.00
A)-1.46 to 1.46
B)-1.45 to 1.45
C)-1.39 to 1.39
D)-1.53 to 1.53
E)-1.00 to 1.00
Unlock Deck
Unlock for access to all 111 flashcards in this deck.
Unlock Deck
k this deck
79
the lowest 9%
A)-1.39
B)-1.34
C)-1.45
D)1.34
E)-1.26
A)-1.39
B)-1.34
C)-1.45
D)1.34
E)-1.26
Unlock Deck
Unlock for access to all 111 flashcards in this deck.
Unlock Deck
k this deck
80
z > -1.82
A)3.44%
B)-3.44%
C)96.56%
D)46.56%
E)92.57%
A)3.44%
B)-3.44%
C)96.56%
D)46.56%
E)92.57%
Unlock Deck
Unlock for access to all 111 flashcards in this deck.
Unlock Deck
k this deck
Unlock Deck
Unlock for access to all 111 flashcards in this deck.


