Deck 19: Categorical Outcomes: Chi-Square and Loglinear Analysis
Full screen (f)
Question
Question
Question
Question
Question
Question
A recent story in the media has claimed that women who eat breakfast every day are more likely to have boy babies than girl babies. Imagine you conducted a study to investigate this in women from two different age groups (18-30 and 31-43 years). Looking at the output tables below, which of the following sentences best describes the results?
A)Whether or not a woman eats breakfast significantly affects the gender of her baby at any age.
B)Women who ate breakfast were significantly more likely to give birth to baby boys than girls.
C)There was a significant two-way interaction between eating breakfast and age group of the mother.
D)The model is a poor fit of the data.
Question
A recent story in the media has claimed that women who eat breakfast every day are more likely to have boy babies than girl babies. Imagine you conducted a study to investigate this in women from two different age groups (18-30 and 31-43 years). Looking at the output tables below, which of the following sentences best describes the results?
A)Removing the two-way interactions (age × gender, age × breakfast, breakfast × gender) has a significant detrimental effect on the model.
B)The three-way interaction (age ? gender ? breakfast) was not significant.
C)All of these statements are correct.
D)None of the main effects were significant.
A)Removing the two-way interactions (age × gender, age × breakfast, breakfast × gender) has a significant detrimental effect on the model.
B)The three-way interaction (age ? gender ? breakfast) was not significant.
C)All of these statements are correct.
D)None of the main effects were significant.
Question
Question
Question
Question
Question
Question
Question
Question
Question
Question
Question
Question

Unlock Deck
Sign up to unlock the cards in this deck!
Unlock Deck
Unlock Deck
1/19
Play
Full screen (f)
Deck 19: Categorical Outcomes: Chi-Square and Loglinear Analysis
1
Men and women were asked which type of animal they thought made the best pets. Data are in the table below. If the expected frequencies rule for chi-square had been violated by the data, which categories could be combined together in a meaningful way to increase the expected frequencies?
A)It depends on the research hypothesis.
B)Reptiles, mammals and neither
C)Men and women
D)Reptiles and mammals
A)It depends on the research hypothesis.
B)Reptiles, mammals and neither
C)Men and women
D)Reptiles and mammals
It depends on the research hypothesis.
2
Are directional hypotheses possible with chi-square?
A)Yes, but only when you have a 2 × 2 design.
B)Yes, but only when there are 12 or more degrees of freedom.
C)Directional hypotheses are never possible with the chi-squared test.
D)Yes, but only when your sample is greater than 200.
A)Yes, but only when you have a 2 × 2 design.
B)Yes, but only when there are 12 or more degrees of freedom.
C)Directional hypotheses are never possible with the chi-squared test.
D)Yes, but only when your sample is greater than 200.
A
3
With 2 2 contingency tables (i.e., two categorical variables both with two categories) no expected values should be below ____.
A)0.8
B)10
C)5
D)1
A)0.8
B)10
C)5
D)1
5
4
When conducting a loglinear analysis, if our model is a good fit of the data then the goodness-of-fit statistic for the final model should be:
A)Non-significant (p should be bigger than .05)
B)Significant (p should be smaller than .05)
C)Greater than 5
D)Less than 5 but greater than 1
A)Non-significant (p should be bigger than .05)
B)Significant (p should be smaller than .05)
C)Greater than 5
D)Less than 5 but greater than 1
Unlock Deck
Unlock for access to all 19 flashcards in this deck.
Unlock Deck
k this deck
5
What are phi and Cramér's V used for?
A)They can be used as remedies when the assumption of expected frequencies has been violated.
B)They are used as a correction when the assumption of independence has been violated.
C)They are measures of the strength of association between two continuous variables.
D)They are measures of the strength of association between two categorical variables.
Unlock Deck
Unlock for access to all 19 flashcards in this deck.
Unlock Deck
k this deck
6
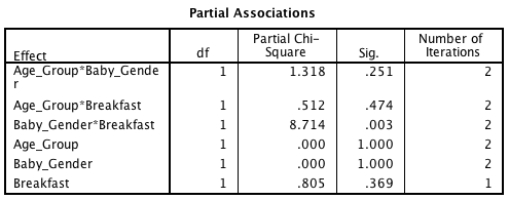
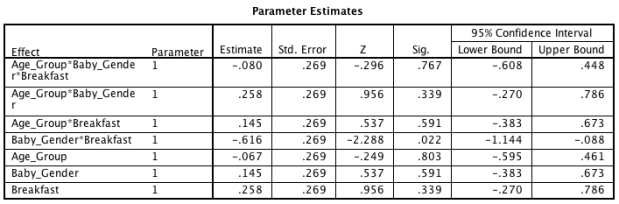
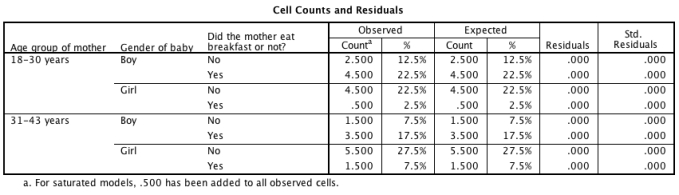
A recent story in the media has claimed that women who eat breakfast every day are more likely to have boy babies than girl babies. Imagine you conducted a study to investigate this in women from two different age groups (18-30 and 31-43 years). Looking at the output tables below, which of the following sentences best describes the results?
A)Whether or not a woman eats breakfast significantly affects the gender of her baby at any age.
B)Women who ate breakfast were significantly more likely to give birth to baby boys than girls.
C)There was a significant two-way interaction between eating breakfast and age group of the mother.
D)The model is a poor fit of the data.
Unlock Deck
Unlock for access to all 19 flashcards in this deck.
Unlock Deck
k this deck
7
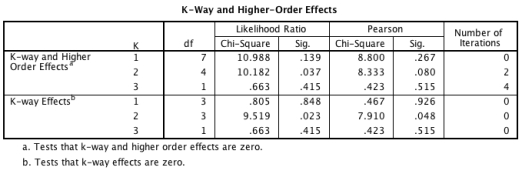
A recent story in the media has claimed that women who eat breakfast every day are more likely to have boy babies than girl babies. Imagine you conducted a study to investigate this in women from two different age groups (18-30 and 31-43 years). Looking at the output tables below, which of the following sentences best describes the results?
A)Removing the two-way interactions (age × gender, age × breakfast, breakfast × gender) has a significant detrimental effect on the model.
B)The three-way interaction (age ? gender ? breakfast) was not significant.
C)All of these statements are correct.
D)None of the main effects were significant.
A)Removing the two-way interactions (age × gender, age × breakfast, breakfast × gender) has a significant detrimental effect on the model.
B)The three-way interaction (age ? gender ? breakfast) was not significant.
C)All of these statements are correct.
D)None of the main effects were significant.
Unlock Deck
Unlock for access to all 19 flashcards in this deck.
Unlock Deck
k this deck
8
In what way do the assumptions in loglinear analysis differ from those for the chi-square test?
A)The chi-square test assumes independence.
B)Loglinear analysis assumes complete separation.
C)Loglinear analysis assumes expected frequencies less than 1.
D)Up to 20% of expected frequencies can be less than 5 in loglinear analysis.
A)The chi-square test assumes independence.
B)Loglinear analysis assumes complete separation.
C)Loglinear analysis assumes expected frequencies less than 1.
D)Up to 20% of expected frequencies can be less than 5 in loglinear analysis.
Unlock Deck
Unlock for access to all 19 flashcards in this deck.
Unlock Deck
k this deck
9
How are the degrees of freedom calculated for a chi-square test?
A)(r - 1) / (c - 1)
B)(r - 1)(c -1)
C)(r 2) - (c 2)
D)(r + 1) - (c + 1)
A)(r - 1) / (c - 1)
B)(r - 1)(c -1)
C)(r 2) - (c 2)
D)(r + 1) - (c + 1)
Unlock Deck
Unlock for access to all 19 flashcards in this deck.
Unlock Deck
k this deck
10
Imagine you conducted a study to look at the association between whether an expectant mother eats breakfast (or not) and the gender of her baby. Cramér's V = .22. How would you interpret this value?
A)2.2% of the variation in frequency counts of baby gender (boy or girl) can be explained by whether or not the mother ate breakfast every day.
B)There is a medium to large association between the gender of the baby and whether or not the mother ate breakfast every day.
C)There was a small to medium association between baby gender and whether the mother ate breakfast every day.
D)22% of the variation in frequency counts of baby gender (boy or girl) can be explained by whether or not the mother ate breakfast every day.
Unlock Deck
Unlock for access to all 19 flashcards in this deck.
Unlock Deck
k this deck
11
Recent research has shown that women who skip breakfast are more likely to give birth to baby girls, whereas women who eat breakfast are more likely to have baby boys. To test this, we took a sample of pregnant women who already knew the gender of their baby and asked them how often they eat breakfast (every day, some days, or never). We want to analyse our data with a chi-square test. How would our analysis be described?
A)1 × 2
B)3 × 3
C)3 × 2
D)2 × 2
A)1 × 2
B)3 × 3
C)3 × 2
D)2 × 2
Unlock Deck
Unlock for access to all 19 flashcards in this deck.
Unlock Deck
k this deck
12
Which of the following statements about loglinear analysis is false?
A)The likelihood ratio statistic is used to assess each model in loglinear analysis.
B)Loglinear analysis can be used when you want to test the relationship between more than two categorical variables.
C)Loglinear analysis is hierarchical: the initial model contains all main effects and interactions.
D)Loglinear analysis relies on all of the same assumptions of a linear model.
Unlock Deck
Unlock for access to all 19 flashcards in this deck.
Unlock Deck
k this deck
13
Which of the following statements about the chi-square test is false?
A)The chi-square test can be used to check how well a model fits the data.
B)The chi-square test is used to quantify the relationship between two categorical variables.
C)The chi-square test is based on the idea of comparing the frequencies you observe in certain categories to the frequencies you might expect to get in those categories by chance.
D)In some circumstances the chi-square test can be used on continuous variables.
Unlock Deck
Unlock for access to all 19 flashcards in this deck.
Unlock Deck
k this deck
14
Which of the hypotheses below would be suited for testing with a one-variable chi-square test?
A)All of these.
B)It was hypothesized that more people would choose the number 7 as their 'lucky' number than any other number.
C)People who choose the number 7 as their 'lucky' number are significantly more superstitious than people who choose the number 13 as their 'lucky' number.
D)Choice of 'lucky' number is directly related to measures superstition.
Unlock Deck
Unlock for access to all 19 flashcards in this deck.
Unlock Deck
k this deck
15
What does Fisher's exact probability show?
A)It is the amount of variation that one variable can explain in the other variable.
B)It tests whether the assumption of independence has been met.
C)It tests whether the assumption of expected frequencies has been met.
D)It is the probability of obtaining a chi-square value at least as big as the one observed if the null hypothesis were true.
Unlock Deck
Unlock for access to all 19 flashcards in this deck.
Unlock Deck
k this deck
16
If the assumption of expected frequencies is not met for a 2 × 2 chi-square test, which of the following remedies could you consider using?
A)Add a constant to each cell in the table
B)Conduct a Pearson's correlation coefficient
C)Fisher's exact probability test
D)Square each of the cells in the table
A)Add a constant to each cell in the table
B)Conduct a Pearson's correlation coefficient
C)Fisher's exact probability test
D)Square each of the cells in the table
Unlock Deck
Unlock for access to all 19 flashcards in this deck.
Unlock Deck
k this deck
17
A researcher asked 933 people which type of programme they prefer to watch on television. Results are below. A chi-square test produced the SPSS output below. What can we conclude from this output?
a. 0 cells have expected count less than 5 . The minimum expected count is 94.19 .
A)The profile of programmes watched was significantly different between men and women.
B)Women watched significantly more programmes than men.
C)Significantly more soap operas were watched.
D)Men and women watch similar types of programmes.
Unlock Deck
Unlock for access to all 19 flashcards in this deck.
Unlock Deck
k this deck
18
Imagine that you are conducting a one-variable chi-square test to investigate the hypothesis that there are equal numbers of cat lovers and dog lovers in the office at work. Having conducted a survey, you found 150 preferred dogs and 120 preferred cats. What would the expected frequencies be in each cell?
A)150 and 120
B)270
C)135
D)More information is needed to calculate the expected frequencies.
A)150 and 120
B)270
C)135
D)More information is needed to calculate the expected frequencies.
Unlock Deck
Unlock for access to all 19 flashcards in this deck.
Unlock Deck
k this deck
19
In loglinear analysis, the saturated model:
A)All of these are true.
B)Is a perfect fit of the data.
C)Gives a value of zero for the likelihood ratio.
D)Involves every possible source of variance.
A)All of these are true.
B)Is a perfect fit of the data.
C)Gives a value of zero for the likelihood ratio.
D)Involves every possible source of variance.
Unlock Deck
Unlock for access to all 19 flashcards in this deck.
Unlock Deck
k this deck
Unlock Deck
Unlock for access to all 19 flashcards in this deck.


