Deck 6: The Beast of Bias
Full screen (f)
Question
Question
Question
Question
Question
Question
Question
Question
Question
Question
Question
Question
Question
Question
Question
Question
What does the graph below indicate about the normality of our data? 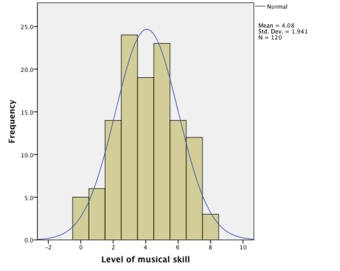
A)The histogram reveals that the data have multivariate normality.
B)We cannot infer anything about the normality of our data from this graph.
C)The histogram reveals that the data are more or less normal.
D)The histogram reveals that the data deviate substantially from normal.
A)The histogram reveals that the data have multivariate normality.
B)We cannot infer anything about the normality of our data from this graph.
C)The histogram reveals that the data are more or less normal.
D)The histogram reveals that the data deviate substantially from normal.
Question
Question
Question
Question
What does the graph below indicate about the normality of our data? 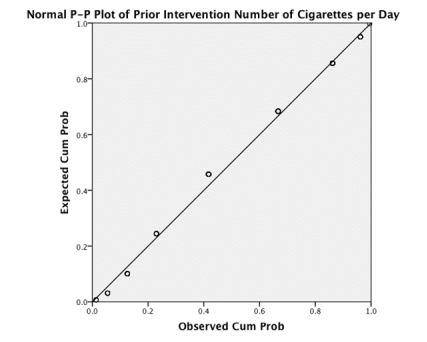
A)We cannot infer anything about the normality of our data from this type of graph.
B)The P-P plot reveals that the data deviate mildly from normal.
C)The P-P plot reveals that the data are normal.
D)The P-P plot reveals that the data deviate substantially from normal.
A)We cannot infer anything about the normality of our data from this type of graph.
B)The P-P plot reveals that the data deviate mildly from normal.
C)The P-P plot reveals that the data are normal.
D)The P-P plot reveals that the data deviate substantially from normal.
Question
Question
Question
Looking at the table below, which of the following statements is the most accurate? 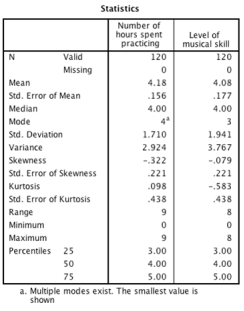
A)For the number of hours spent practising, the data are fairly positively skewed.
B)For the number of hours spent practising, there is not an issue with kurtosis.
C)For the level of musical skill, the data are heavily negatively skewed.
D)For the number of hours spent practising, there is an issue with kurtosis.
Question
A researcher investigating 'Pygmalion in the classroom' measured teachers' perceptions of male and female students' mathematical abilities. She wanted to test whether teachers perceived males as being better at maths by comparing teachers' mean ratings of 97 male and female students. Based on the output, what action should the researcher take before testing whether the mean teacher perceptions are different for male and female students? 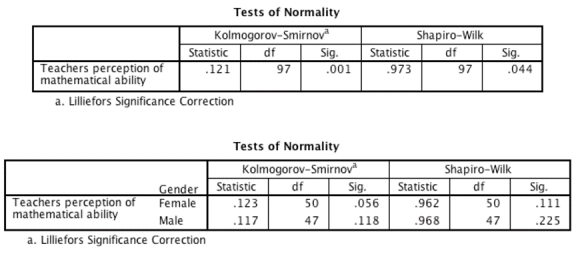
A)Use bootstrapping.
B)Automatically delete extreme scores.
C)Take no action.
D)Log-transform the data.
A)Use bootstrapping.
B)Automatically delete extreme scores.
C)Take no action.
D)Log-transform the data.
Question
Question
Question
Question
Question
Question
Question
Question
Looking at the table below, which of the following statements is correct? 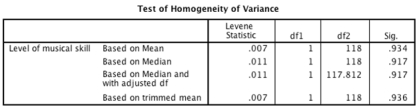
A)Levene's test was non-significant, F(1, 118) = 0.01, p = .93, indicating that the assumption of homogenity of variance had been met.
B)Levene's test was significant, F(1, 118) = 0.93, p = .007, indicating that the assumption of homogenity of variance had been met.
C)Levene's test was non-significant, F(1, 118) = 0.01, p = .93, indicating that the assumption of homogenity of variance had been violated.
D)Levene's test was significant, F(1, 118) = 0.01, p = .93, indicating that the assumption of homogenity of variance had been violated.

Unlock Deck
Sign up to unlock the cards in this deck!
Unlock Deck
Unlock Deck
1/32
Play
Full screen (f)
Deck 6: The Beast of Bias
1
Which of the following transformations is most useful for correcting skewed data?
A)Log transformation
B)Tangent transformation
C)Arcsine transformation
D)Cosine transformation
A)Log transformation
B)Tangent transformation
C)Arcsine transformation
D)Cosine transformation
A
2
What does the assumption of independence mean?
A)This assumption means that you must use an independent design rather than a repeated-measures design.
B)This assumption means that the residuals in your model are not independent.
C)This assumption means that the errors in your model are not related to each other.
D)This assumption means that none of your independent variables are correlated.
C
3
Which of the following is not an assumption of the general linear model?
A)Linearity
B)Normally distributed residuals
C)Dependence
D)Additivity
A)Linearity
B)Normally distributed residuals
C)Dependence
D)Additivity
C
4
Should you use significance tests of skew and kurtosis in large samples?
A)No, because they are likely to be significant even when skew and kurtosis are not too different from normal.
B)No, because they are likely to be non-significant even when skew and kurtosis are significantly different from normal.
C)Yes, because large samples produce more accurate results.
D)Yes, because large samples add power to the test.
Unlock Deck
Unlock for access to all 32 flashcards in this deck.
Unlock Deck
k this deck
5
The assumption of homogeneity of variance is met when:
A)The variances in different groups are significantly different.
B)The variance across groups is proportional to the means of those groups.
C)The variance is the same as the interquartile range.
D)The variances in different groups are approximately equal.
A)The variances in different groups are significantly different.
B)The variance across groups is proportional to the means of those groups.
C)The variance is the same as the interquartile range.
D)The variances in different groups are approximately equal.
Unlock Deck
Unlock for access to all 32 flashcards in this deck.
Unlock Deck
k this deck
6
We predict an outcome variable from some kind of model. That model is described by one or more _______ variables and ________ that tell us something about the relationship between the predictor and outcome variable.
A)parameter, outcome variables
B)dependent, predictors
C)outcome, estimates
D)predictor, parameters
A)parameter, outcome variables
B)dependent, predictors
C)outcome, estimates
D)predictor, parameters
Unlock Deck
Unlock for access to all 32 flashcards in this deck.
Unlock Deck
k this deck
7
The Kolmogorov-Smirnov test can be used to test:
A)Whether group means differ.
B)Whether scores are measured at the interval level.
C)Whether scores are normally distributed.
D)Whether group variances are equal.
A)Whether group means differ.
B)Whether scores are measured at the interval level.
C)Whether scores are normally distributed.
D)Whether group variances are equal.
Unlock Deck
Unlock for access to all 32 flashcards in this deck.
Unlock Deck
k this deck
8
What is the Shapiro-Wilk test primarily used for?
A)To test for heterogeneity of variance
B)To test for homogeneity of variance
C)It is used to test for problematic outliers that could bias the results.
D)To test whether the distribution of scores deviates from a comparable normal distribution.
A)To test for heterogeneity of variance
B)To test for homogeneity of variance
C)It is used to test for problematic outliers that could bias the results.
D)To test whether the distribution of scores deviates from a comparable normal distribution.
Unlock Deck
Unlock for access to all 32 flashcards in this deck.
Unlock Deck
k this deck
9
A kurtosis value of -2.89 indicates:
A)There is a mistake in your calculation.
B)A flat and light-tailed distribution
C)A pointy and heavy-tailed distribution
D)A flat and heavy-tailed distribution
A)There is a mistake in your calculation.
B)A flat and light-tailed distribution
C)A pointy and heavy-tailed distribution
D)A flat and heavy-tailed distribution
Unlock Deck
Unlock for access to all 32 flashcards in this deck.
Unlock Deck
k this deck
10
Imagine you conduct a t-test using IBM SPSS and the output reveals that Levene's test for equality of variance is significant. What should you do?
A)Interpret the figures in the row labelled 'equal variances not assumed'.
B)Interpret the figures in the row labelled 'equal variances assumed'.
C)Conduct a Kruskal-Wallis test instead.
D)Collect more data.
A)Interpret the figures in the row labelled 'equal variances not assumed'.
B)Interpret the figures in the row labelled 'equal variances assumed'.
C)Conduct a Kruskal-Wallis test instead.
D)Collect more data.
Unlock Deck
Unlock for access to all 32 flashcards in this deck.
Unlock Deck
k this deck
11
A standard score is:
A)A z-score
B)The standard deviation of a particular score
C)The population mean
D)The variance
A)A z-score
B)The standard deviation of a particular score
C)The population mean
D)The variance
Unlock Deck
Unlock for access to all 32 flashcards in this deck.
Unlock Deck
k this deck
12
A _____ is a numerical characteristic of a sample and a _____ is a numerical characteristic of a population.
A)distribution, variable
B)statistic, parameter
C)parameter, statistic
D)variable, distribution
A)distribution, variable
B)statistic, parameter
C)parameter, statistic
D)variable, distribution
Unlock Deck
Unlock for access to all 32 flashcards in this deck.
Unlock Deck
k this deck
13
Which of these variables would be considered not to have met the assumptions of parametric tests based on the normal distribution?
A)Heart rate
B)Gender
C)Reaction time
D)Temperature
A)Heart rate
B)Gender
C)Reaction time
D)Temperature
Unlock Deck
Unlock for access to all 32 flashcards in this deck.
Unlock Deck
k this deck
14
Is it possible to calculate the skewness of a set of numerical scores?
A)Yes.
B)No.
C)Only if you have a large sample size.
D)Only if you have used an independent-measures design.
A)Yes.
B)No.
C)Only if you have a large sample size.
D)Only if you have used an independent-measures design.
Unlock Deck
Unlock for access to all 32 flashcards in this deck.
Unlock Deck
k this deck
15
15,467 people rated how much they liked my textbook on a scale of 1 (it is rubbish) to 10 (I love it). The distribution of scores had a skew of 1.23 (SE = 0.65). Which of the following would be the best way to decide whether the skew is problematic? (Hint: Think about what you know about the central limit theorem.)
A)Use the Kolmogorov-Smirnov test.
B)None of the options, because of the large sample size.
C)See if the z-score is bigger than 1.96 or smaller than -1.96
D)See if the skew is significant at p < .05.
A)Use the Kolmogorov-Smirnov test.
B)None of the options, because of the large sample size.
C)See if the z-score is bigger than 1.96 or smaller than -1.96
D)See if the skew is significant at p < .05.
Unlock Deck
Unlock for access to all 32 flashcards in this deck.
Unlock Deck
k this deck
16
What does the graph below indicate about the normality of our data?
A)The histogram reveals that the data have multivariate normality.
B)We cannot infer anything about the normality of our data from this graph.
C)The histogram reveals that the data are more or less normal.
D)The histogram reveals that the data deviate substantially from normal.
A)The histogram reveals that the data have multivariate normality.
B)We cannot infer anything about the normality of our data from this graph.
C)The histogram reveals that the data are more or less normal.
D)The histogram reveals that the data deviate substantially from normal.
Unlock Deck
Unlock for access to all 32 flashcards in this deck.
Unlock Deck
k this deck
17
The test statistics we use to assess a linear model are usually _______ based on the normal distribution.
A)parametric tests
B)non-parametric tests
C)robust
D)not
A)parametric tests
B)non-parametric tests
C)robust
D)not
Unlock Deck
Unlock for access to all 32 flashcards in this deck.
Unlock Deck
k this deck
18
In which of the following situations is the assumption of normality least important?
A)If you want only to estimate the parameters of your model.
B)If you have a small sample.
C)If you want to construct confidence intervals around the parameter estimates of your model.
D)If you want to compute significance tests relating to the parameter estimates of your model.
A)If you want only to estimate the parameters of your model.
B)If you have a small sample.
C)If you want to construct confidence intervals around the parameter estimates of your model.
D)If you want to compute significance tests relating to the parameter estimates of your model.
Unlock Deck
Unlock for access to all 32 flashcards in this deck.
Unlock Deck
k this deck
19
Which of the following symbols does not represent a population parameter?
A)
B)
C)SD
D)
A)
B)
C)SD
D)
Unlock Deck
Unlock for access to all 32 flashcards in this deck.
Unlock Deck
k this deck
20
What does the graph below indicate about the normality of our data?
A)We cannot infer anything about the normality of our data from this type of graph.
B)The P-P plot reveals that the data deviate mildly from normal.
C)The P-P plot reveals that the data are normal.
D)The P-P plot reveals that the data deviate substantially from normal.
A)We cannot infer anything about the normality of our data from this type of graph.
B)The P-P plot reveals that the data deviate mildly from normal.
C)The P-P plot reveals that the data are normal.
D)The P-P plot reveals that the data deviate substantially from normal.
Unlock Deck
Unlock for access to all 32 flashcards in this deck.
Unlock Deck
k this deck
21
In a small data sample (N = 20), what can we say about a z-score of 2.37?
A)It is significant at p < .05
B)It is significant at p < .001
C)It is significant at p < .01
D)It is non-significant
A)It is significant at p < .05
B)It is significant at p < .001
C)It is significant at p < .01
D)It is non-significant
Unlock Deck
Unlock for access to all 32 flashcards in this deck.
Unlock Deck
k this deck
22
The central limit theorem tells us:
A)In small samples, significance tests can't be trusted.
B)In small samples, the assumptions of parametric tests matter less.
C)If the sample is large enough we can assume homogeneity of variance.
D)If the sample is large enough, the sampling distribution of a parameter will be normal.
A)In small samples, significance tests can't be trusted.
B)In small samples, the assumptions of parametric tests matter less.
C)If the sample is large enough we can assume homogeneity of variance.
D)If the sample is large enough, the sampling distribution of a parameter will be normal.
Unlock Deck
Unlock for access to all 32 flashcards in this deck.
Unlock Deck
k this deck
23
Looking at the table below, which of the following statements is the most accurate?
A)For the number of hours spent practising, the data are fairly positively skewed.
B)For the number of hours spent practising, there is not an issue with kurtosis.
C)For the level of musical skill, the data are heavily negatively skewed.
D)For the number of hours spent practising, there is an issue with kurtosis.
Unlock Deck
Unlock for access to all 32 flashcards in this deck.
Unlock Deck
k this deck
24
A researcher investigating 'Pygmalion in the classroom' measured teachers' perceptions of male and female students' mathematical abilities. She wanted to test whether teachers perceived males as being better at maths by comparing teachers' mean ratings of 97 male and female students. Based on the output, what action should the researcher take before testing whether the mean teacher perceptions are different for male and female students?
A)Use bootstrapping.
B)Automatically delete extreme scores.
C)Take no action.
D)Log-transform the data.
A)Use bootstrapping.
B)Automatically delete extreme scores.
C)Take no action.
D)Log-transform the data.
Unlock Deck
Unlock for access to all 32 flashcards in this deck.
Unlock Deck
k this deck
25
Levene's test can be used to measure:
A)Whether scores are normally distributed.
B)Whether scores are independent.
C)Whether group means are equal.
D)Whether group variances differ.
A)Whether scores are normally distributed.
B)Whether scores are independent.
C)Whether group means are equal.
D)Whether group variances differ.
Unlock Deck
Unlock for access to all 32 flashcards in this deck.
Unlock Deck
k this deck
26
Which of the following is not a way to deal with bias in the observed data?
A)Watsonize the scores.
B)Transform the data.
C)Use bootstrapping.
D)Trim the data.
A)Watsonize the scores.
B)Transform the data.
C)Use bootstrapping.
D)Trim the data.
Unlock Deck
Unlock for access to all 32 flashcards in this deck.
Unlock Deck
k this deck
27
A confidence interval (and p-value) associated with a parameter (e.g., the mean, or a b in regression) assumes:
A)The residuals are normally distributed.
B)The sampling distribution of the parameter estimate is normal.
C)The data are normally distributed.
D)The data have heterogeneity of variance.
A)The residuals are normally distributed.
B)The sampling distribution of the parameter estimate is normal.
C)The data are normally distributed.
D)The data have heterogeneity of variance.
Unlock Deck
Unlock for access to all 32 flashcards in this deck.
Unlock Deck
k this deck
28
A researcher investigating 'Pygmalion in the classroom' measured teachers' perceptions of male and female students' mathematical abilities. She collected teacher ratings of 97 male and female students. Based on the output, what can you say about the data?
A)The variances of ratings were significantly different for males and females.
B)Homogeneity of variance can be assumed.
C)Mean perceptions of male and female students were significantly different.
D)Mean and median ratings were similar for males and females
A)The variances of ratings were significantly different for males and females.
B)Homogeneity of variance can be assumed.
C)Mean perceptions of male and female students were significantly different.
D)Mean and median ratings were similar for males and females
Unlock Deck
Unlock for access to all 32 flashcards in this deck.
Unlock Deck
k this deck
29
To get a sample of a certain size, scores are taken one-by-one from the observed data and each time replaced. The parameter of interest (e.g., the mean or b in regression) is computed within the sample. This process is repeated numerous times. The resulting parameter estimates are used to compute a confidence interval. The process I am describing is:
A)Significance testing
B)Bootstrapping
C)Sampling
D)The standard error
A)Significance testing
B)Bootstrapping
C)Sampling
D)The standard error
Unlock Deck
Unlock for access to all 32 flashcards in this deck.
Unlock Deck
k this deck
30
When it is not necessary to use Levene's test?
A)When you have unequal group sizes.
B)When you have a small sample.
C)When you are conducting a two-tailed test.
D)When you have equal group sizes.
A)When you have unequal group sizes.
B)When you have a small sample.
C)When you are conducting a two-tailed test.
D)When you have equal group sizes.
Unlock Deck
Unlock for access to all 32 flashcards in this deck.
Unlock Deck
k this deck
31
When we talk about the assumption of normality, what do we mean?
A)The sampling distribution of the parameter estimate must be normally distributed.
B)Observed scores must be normally distributed.
C)The Kolmogorov-Smirnov test must be significant.
D)Residuals should not have a funnel shape.
A)The sampling distribution of the parameter estimate must be normally distributed.
B)Observed scores must be normally distributed.
C)The Kolmogorov-Smirnov test must be significant.
D)Residuals should not have a funnel shape.
Unlock Deck
Unlock for access to all 32 flashcards in this deck.
Unlock Deck
k this deck
32
Looking at the table below, which of the following statements is correct?
A)Levene's test was non-significant, F(1, 118) = 0.01, p = .93, indicating that the assumption of homogenity of variance had been met.
B)Levene's test was significant, F(1, 118) = 0.93, p = .007, indicating that the assumption of homogenity of variance had been met.
C)Levene's test was non-significant, F(1, 118) = 0.01, p = .93, indicating that the assumption of homogenity of variance had been violated.
D)Levene's test was significant, F(1, 118) = 0.01, p = .93, indicating that the assumption of homogenity of variance had been violated.
Unlock Deck
Unlock for access to all 32 flashcards in this deck.
Unlock Deck
k this deck
Unlock Deck
Unlock for access to all 32 flashcards in this deck.


