Deck 8: Further Topics in Probability and Data Description
Full screen (f)
Question
Question
Question
If the probability that a certain couple will have a blue-eyed child is  , and they have 12 children, what is the probability that at least 1 child has blue eyes?
A)
B)
C)
D)
E)
, and they have 12 children, what is the probability that at least 1 child has blue eyes? A)
B)
C)
D)
E)
Question
Suppose that 30% of the patients who have a certain disease die from it. If 13 patients have the disease, what is the probability that no more than 4 patients will die from it? Round your answer to six decimal places.
A) Pr(Deaths 4) = 0.308168
B) Pr(Deaths 4) = 0.192789
C) Pr(Deaths 4) = 0.356936
D) Pr(Deaths 4) = 0.898811
E) Pr(Deaths 4) = 0.451835
A) Pr(Deaths
4) = 0.308168B) Pr(Deaths
4) = 0.192789C) Pr(Deaths
4) = 0.356936D) Pr(Deaths
4) = 0.898811E) Pr(Deaths
4) = 0.451835 Question
Question
Question
Question
Question
Suppose a fair coin is tossed 12 times. What is the probability that exactly 10 heads will occur?
A) Pr(10 Heads) =
B) Pr(10 Heads) =
C) Pr(10 Heads) =
D) Pr(10 Heads) =
E) Pr(10 Heads) =
A) Pr(10 Heads) =
B) Pr(10 Heads) =
C) Pr(10 Heads) =
D) Pr(10 Heads) =
E) Pr(10 Heads) =
Question
If a fair die is rolled 7 times, what is the probability that an odd number will result 4 times?
A)
B)
C)
D)
E)
A)
B)
C)
D)
E)
Question
Question
Question
Question
Question
The probability that a certain couple will have a blue-eyed child is  , and they have 5 children. What is the probability that none of their children have blue eyes? Round your answer to six decimal places.
A) Pr(0 Blue) = 0
B) Pr(0 Blue) = 0.001978
C) Pr(0 Blue) = 0.000260
D) Pr(0 Blue) = 0.000648
E) Pr(0 Blue) = 1
, and they have 5 children. What is the probability that none of their children have blue eyes? Round your answer to six decimal places. A) Pr(0 Blue) = 0
B) Pr(0 Blue) = 0.001978
C) Pr(0 Blue) = 0.000260
D) Pr(0 Blue) = 0.000648
E) Pr(0 Blue) = 1
Question
Question
Question
Question
Question
Question
Question
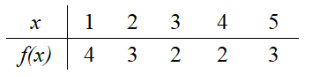
Find the mode of the following data. Round your answer to the nearest integer.
Interval
Frequency 5
5  9
9  4
4  2
2  3
3
A) 29
B) 34
C) 14
D) 24
E) 19
Interval
Frequency
5 9 4 2 3A) 29
B) 34
C) 14
D) 24
E) 19
Question
Question
Question
Find the standard deviation of the sample data in the frequency table. Round your answer to two decimal places.
A) 2.79
B) 39.00
C) 2.49
D) 1.58
E) 2.50
A) 2.79
B) 39.00
C) 2.49
D) 1.58
E) 2.50
Question
Question
Find the mean of the following data. Round your answer to the nearest integer.
A) 24
B) 64
C) 41
D) 60
E) 102
A) 24
B) 64
C) 41
D) 60
E) 102
Question
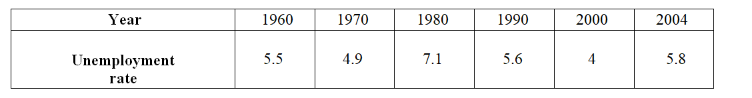
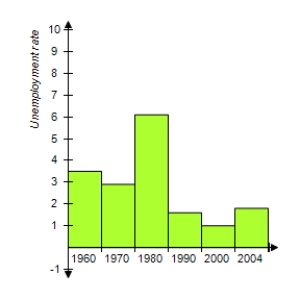
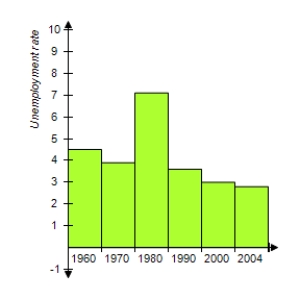
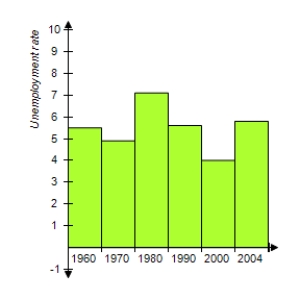
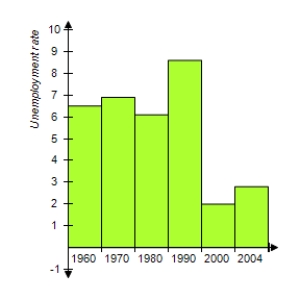
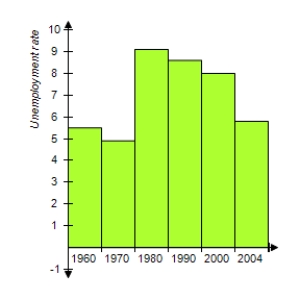
The following table gives a city's unemployment rates for civilian workers for selected years from 1960 to 2004. Which bar graph represents the information given in the table?
A)
B)
C)
D)
E)
A)
B)
C)
D)
E)
Question
Which list of data is displayed in this frequency histogram? 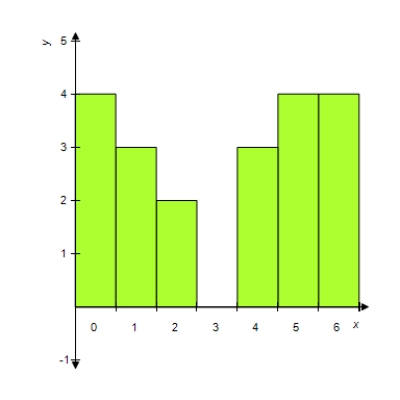
A) 0, 0, 0, 0, 0, 1, 1, 2, 2, 4, 4, 5, 5, 5, 5
B) 1, 1, 1, 1, 2, 2, 2, 3, 4, 5, 5, 5, 5
C) 0, 1, 2, 3, 3, 3, 3, 3, 5, 5, 5, 5, 6, 6
D) 0, 0, 0, 2, 2, 4, 4, 4, 5, 5, 5, 5, 6, 6, 6, 6, 6
E) 0, 0, 0, 0, 1, 1, 1, 2, 2, 4, 4, 4, 5, 5, 5, 5, 6, 6, 6, 6
A) 0, 0, 0, 0, 0, 1, 1, 2, 2, 4, 4, 5, 5, 5, 5
B) 1, 1, 1, 1, 2, 2, 2, 3, 4, 5, 5, 5, 5
C) 0, 1, 2, 3, 3, 3, 3, 3, 5, 5, 5, 5, 6, 6
D) 0, 0, 0, 2, 2, 4, 4, 4, 5, 5, 5, 5, 6, 6, 6, 6, 6
E) 0, 0, 0, 0, 1, 1, 1, 2, 2, 4, 4, 4, 5, 5, 5, 5, 6, 6, 6, 6
Question
Question
Question
Question
Question
Question
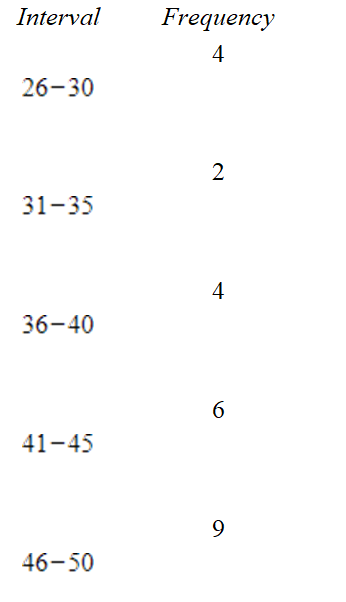
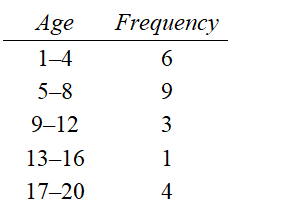
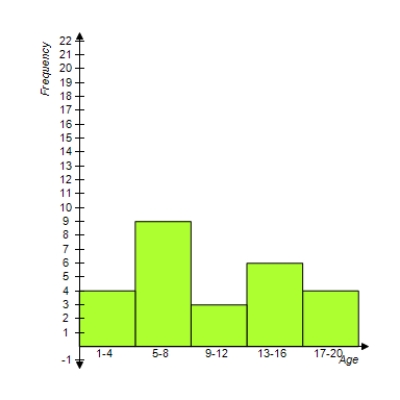
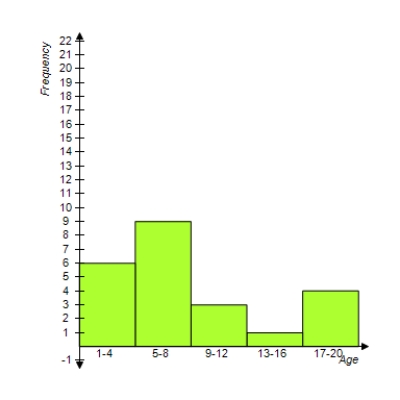
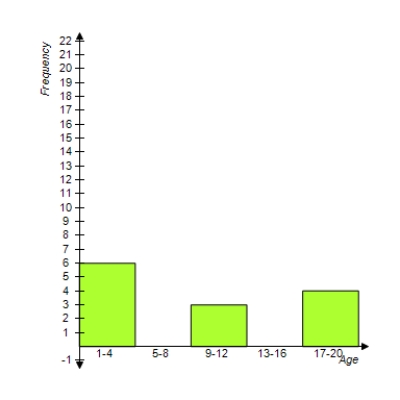
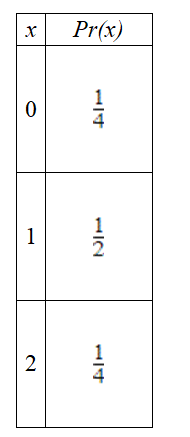
Which frequency histogram best describes the data given in the frequency table?
A) 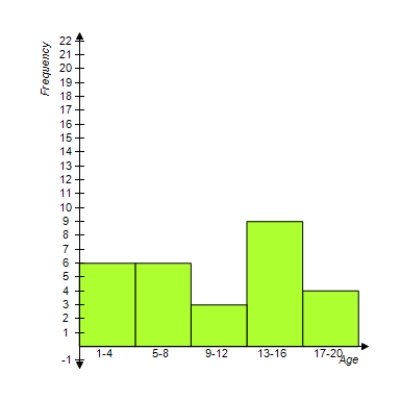
B)
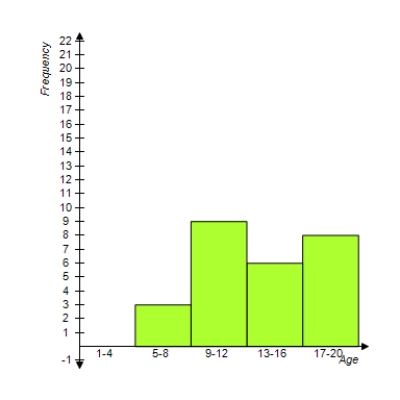
C)
D)
E)
A)
B)
C)
D)
E)
Question
Question
Question
Question
Which frequency table best describes the data displayed in the frequency histogram? 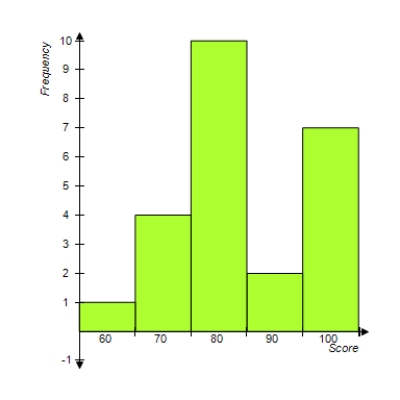
A)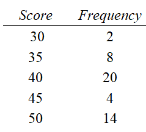
B)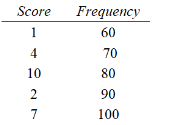
C)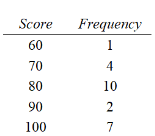
D)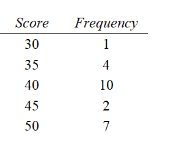
E)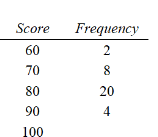
A)
B)
C)
D)
E)
Question
Question
The following bar graph shows the size of the average farm (in acres) for selected years from 1940 to 2000. Which table shows the data displayed in the graph? 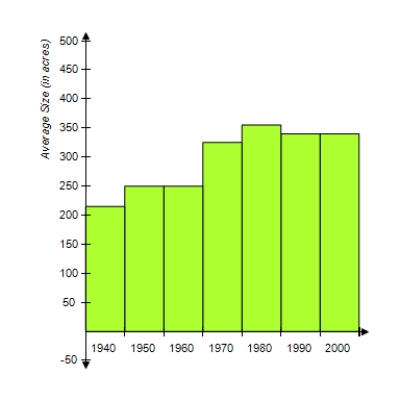
A)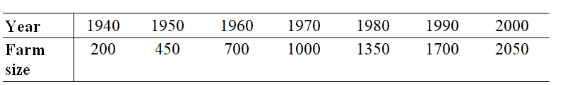
B)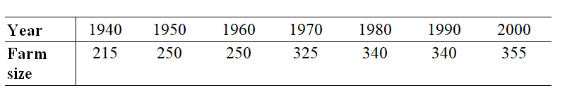
C)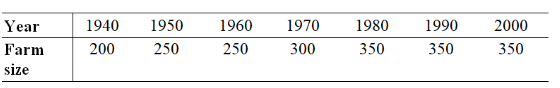
D)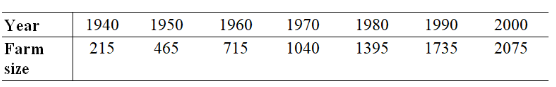
E)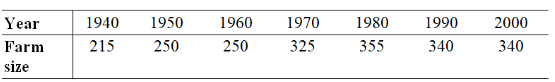
A)
B)
C)
D)
E)
Question
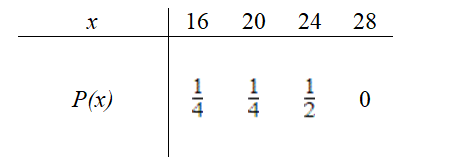
Determine y, if possible, so that the table describes a discrete probability distribution.
X
P(x)
1 2
2  3
3  4
4
Y
A) y =
B) y =
C)
D)
E) not possible
X
P(x)
1
2 3 4Y
A) y =
B) y =
C)
D)
E) not possible
Question
Determine c, if possible, so that the formula 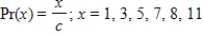 describes a discrete probability distribution.
A) 11
B)
C) 35
D) 
E) not possible
describes a discrete probability distribution. A) 11
B)
C) 35
D)
E) not possible
Question
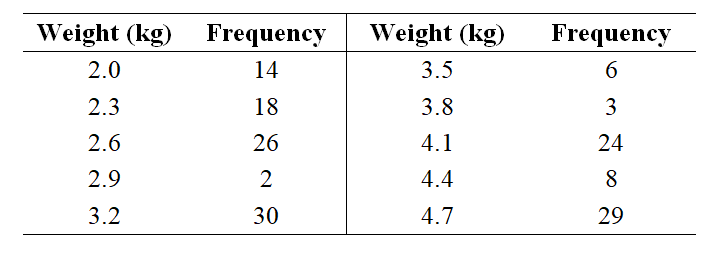
The birth weights (in kilograms) of a sample of 160 children are given in the following table. What is the mean of the weights? Round your answer to two decimal places.
A) 5.12
B) 16.15
C) 3.35
D) 3.38
E) 16.00
A) 5.12
B) 16.15
C) 3.35
D) 3.38
E) 16.00
Question
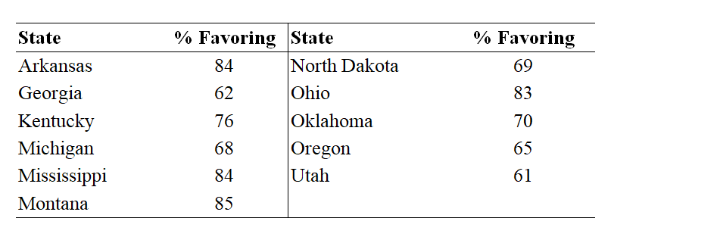
The table below gives the votes in favor of the measure "Amend the state constitution to recognize marriage only between a man and a woman" in states that had it on the ballot. What is the mean of the state percents favoring this measure? Round your answer to two decimal places.
A) 70.00
B) 73.36
C) 67.25
D) 16.14
E) 80.70
A) 70.00
B) 73.36
C) 67.25
D) 16.14
E) 80.70
Question
A new car with a $19,700 list price can be bought for different prices from different dealers. In one city the car can be bought for $18,900 from 2 dealers, for $17,500 from 1 dealer, for $17800 from 3 dealers, for $18,300 from 2 dealers, and for $18,200 from 2 dealers. What are the mean and standard deviation of this sample of car prices? Round your answer to two decimal places wherever applicable.
A)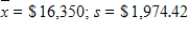
B)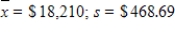
C)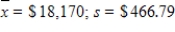
D)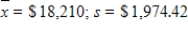
E)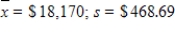
A)
B)
C)
D)
E)
Question
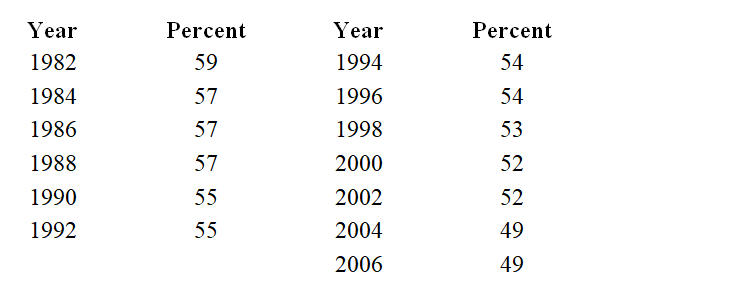
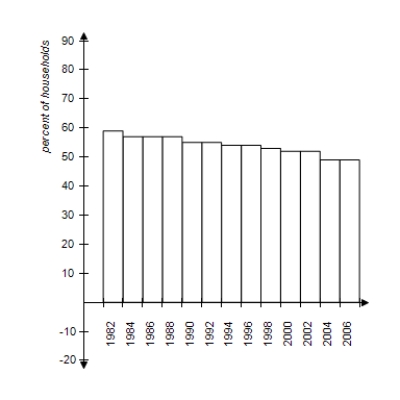
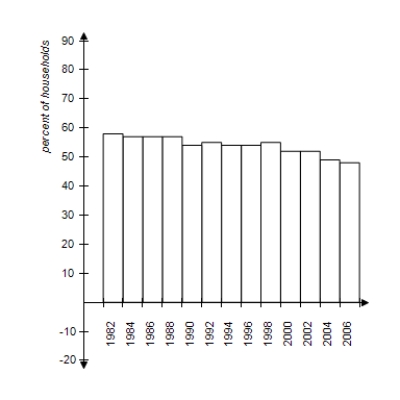
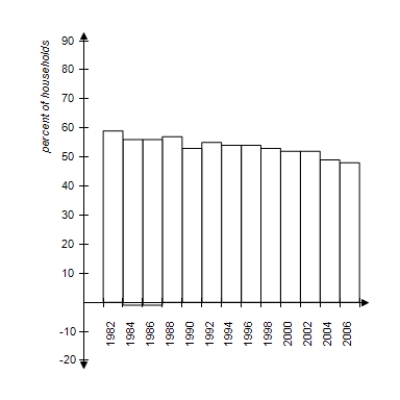
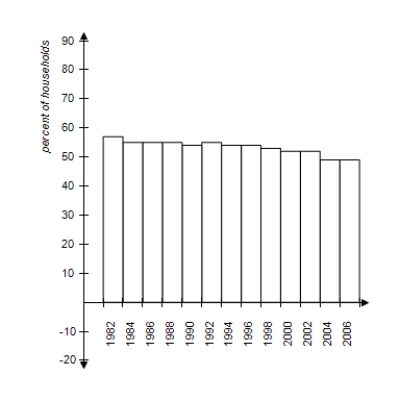
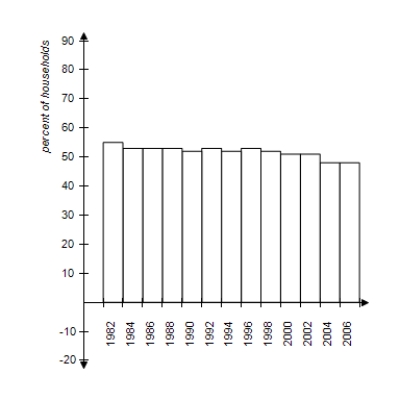
The percents of total households that contain married couples for the years 1982 to 2006 are given in the table below. Construct a frequency histogram of the percents.
A)
B)
C)
D)
E)
A)
B)
C)
D)
E)
Question
The following table defines a discrete probability distribution. Find the expected value of the distribution.
A)
B)
C)
D)
E)
A)
B)
C)
D)
E)
Question
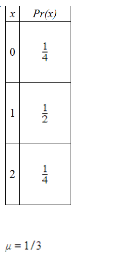
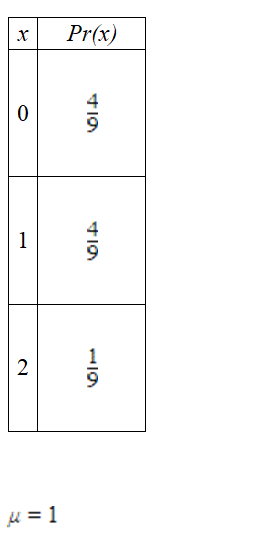
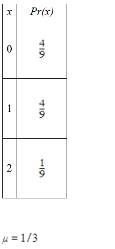
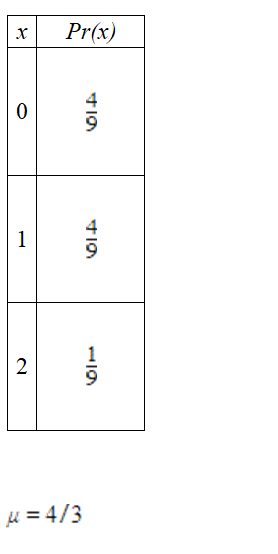
A die is rolled 2 times, and success is rolling a number greater than 3. Let x = number of success. Construct the binomial distribution that describes this experiment, and find the mean of this distribution.
A)
B)
C)
D)
E)
A)
B)
C)
D)
E)
Question
Data on the amounts of federal on-budget funds for research programs at universities and related institutions for selected years appear in the table below. What is the standard deviation of the federal on-budget funds for research programs for this period? Round your answer to three decimal places.
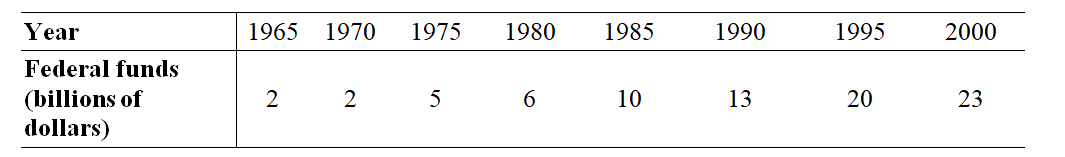
A) 10.125
B) 8.000
C) 7.990
D) 11.571
E) 7.474
A) 10.125
B) 8.000
C) 7.990
D) 11.571
E) 7.474
Question
A variable x has a binomial distribution with probability of success 0.65 for each trial. For a total of 50 trials, what are the mean and the standard deviation of the distribution?
A)
B)
C)
D)
E)
A)
B)
C)
D)
E)
Question
Question
The following table defines a discrete probability distribution. Find the expected value of the distribution.
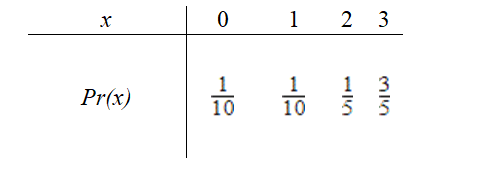
A) E(x)=
B) E(x)=
C) E(x)=
D) E(x)=10
E) E(x)=1
A) E(x)=
B) E(x)=
C) E(x)=
D) E(x)=10
E) E(x)=1
Question
A coin is "loaded" so that the probability of tossing a head is  . If it is tossed 24 times, what are the mean and the standard deviation of the number of heads that occur?
A)
B)
C)
D)
E)
. If it is tossed 24 times, what are the mean and the standard deviation of the number of heads that occur? A)
B)
C)
D)
E)
Question
Determine c, if possible, so that the formula 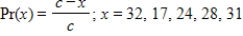 describes a discrete probability distribution.
A) 2
B)
C) 194
D) 33
E) not possible
describes a discrete probability distribution. A) 2
B)
C) 194
D) 33
E) not possible
Question
Estimate the variance for the following probability distribution to two decimal places.
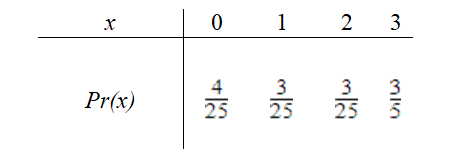
A) 2.16
B) 1.33
C) 1.16
D) 1.78
E) 1.00
A) 2.16
B) 1.33
C) 1.16
D) 1.78
E) 1.00
Question
Question
Suppose an experiment has five possible outcomes for x: 1, 2, 3, 4, 5. The probability that each of these outcomes occurs is  . Estimate the expected value of x for the experiment to two decimal places?
A)
B)
C)
D)
E)
. Estimate the expected value of x for the experiment to two decimal places? A)
B)
C)
D)
E)
Question
Estimate the variance for the following probability distribution to two decimal places. 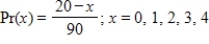
A) 1.89
B) 1.99
C) 1.41
D) 3.95
E) 1.00
A) 1.89
B) 1.99
C) 1.41
D) 3.95
E) 1.00
Question
Question
Suppose a population of scores x is normally distributed with  and
and  Use the standard normal distribution to find
 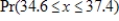 . Round your answer to four decimal places.
A) 0.0980
B) 0.1378
C) 0.2358
D) 0.0398
E) 0.1179
and Use the standard normal distribution to find . Round your answer to four decimal places. A) 0.0980
B) 0.1378
C) 0.2358
D) 0.0398
E) 0.1179
Question
Question
Suppose a population of scores x is normally distributed with  and
and  . Use the standard normal distribution to find
  . Round your answer to four decimal places.
A) 0.1915
B) 0.5000
C) 0.8085
D) 0.0958
E) 0.6915
and . Use the standard normal distribution to find . Round your answer to four decimal places. A) 0.1915
B) 0.5000
C) 0.8085
D) 0.0958
E) 0.6915
Question
Expand 
A)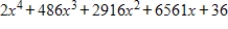
B)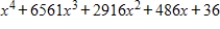
C)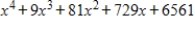
D)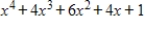
E)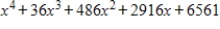
A)
B)
C)
D)
E)
Question
Suppose that 8% of the patients who have a certain disease will die from it. If 80 people have the disease, how many would we expect to die from it, and what is the standard deviation of the number of deaths that could occur? Round any estimated quantities to two decimal places.
A) 
B) 
C) 
D)
E)
A)
B)
C)
D)
E)
Question
Question
In studying a certain endangered species, scientists have found that when the animals are relocated, it takes x years without offspring before the first young are born, where x and the probability of x are given below. What is the expected number of years before the first young are born?
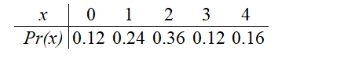
A) 1.96 years
B) 0.96 years
C) 0.64 years
D) 1.56 years
E) 1.68 years
A) 1.96 years
B) 0.96 years
C) 0.64 years
D) 1.56 years
E) 1.68 years
Question
Use a table of the standard normal distribution to find the probability that a z-score from the standard normal distribution will lie within the interval  . Round your answer to four decimal places.
A) 0.4643
B) 0.9285
C) 0.0715
D) 0.1715
E) 0.6964
. Round your answer to four decimal places. A) 0.4643
B) 0.9285
C) 0.0715
D) 0.1715
E) 0.6964
Question
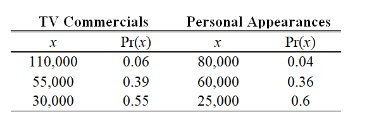
A candidate must decide whether he should spend his time and money on TV commercials or making personal appearances. His staff determines that by using TV he can reach 110,000 people with probability 0.06, 55,000 people with probability 0.39, and 30,000 people with probability 0.55; by making personal appearances he can reach 80,000 people with probability 0.04, 60,000 people with probability 0.36, and 25,000 people with probability 0.6. In the following table, x represents the number of people reached by each choice. In each case, find the expected value of x to decide which method, if either, will reach more people.
A) 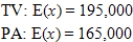
B) 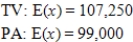
C) 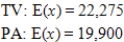
D) 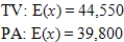
E) 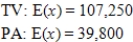
A)
B)
C)
D)
E)
Question
A multiple-choice test has 45 questions and 5 choices for each question. If a student is totally unprepared and guesses on each question, how many questions can she expect to answer correctly, and what is the standard deviation of the number of correct answers? Round any estimated quantities to two decimal places.
A)
B)
C)
D)
E)
A)
B)
C)
D)
E)
Question
Suppose a population of scores x is normally distributed with  and
and  . Use the standard normal distribution to find
 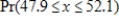 . Round your answer to four decimal places.
A) 0.1368
B) 0.7264
C) 0.7736
D) 0.2264
E) 0.2736
and . Use the standard normal distribution to find . Round your answer to four decimal places. A) 0.1368
B) 0.7264
C) 0.7736
D) 0.2264
E) 0.2736
Question
A candidate claims that 60% of the voters in his district will vote for him. If his district contains 120,300 voters, how many votes does he expect to get from his district, and what is the standard deviation of the number of these votes? Round any estimated quantities to the nearest integer.
A)
B)
C)
D)
E) 
A)
B)
C)
D)
E)
Question
Question
Question
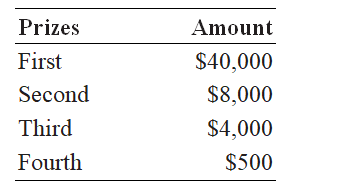
A nonprofit organization sells chances for a $40,000 automobile at $125 per ticket. It sells 2,000 tickets and offers four prizes, summarized in the table that follows. What are the expected winnings (or loss) for each ticket?
A)
B)
C)
D)
E)
A)
B)
C)
D)
E)
Question
If the probability that a newborn child is a male is  , what is the expected number of male children in a family having 2 children? Round your answer to two decimal places.
A) 1.50
B) 1.13
C) 2.00
D) 0.50
E) 1.00
, what is the expected number of male children in a family having 2 children? Round your answer to two decimal places. A) 1.50
B) 1.13
C) 2.00
D) 0.50
E) 1.00
Question
Use a table of the standard normal distribution to find the probability that a z-score from the standard normal distribution will lie within the interval  . Round your answer to four decimal places.
A) 0.4969
B) 0.0062
C) 0.6625
D) 0.9938
E) 0.4938
. Round your answer to four decimal places. A) 0.4969
B) 0.0062
C) 0.6625
D) 0.9938
E) 0.4938
Question
Question
Use a table of the standard normal distribution to find the probability that a z-score from the standard normal distribution will lie within the interval  . Round your answer to four decimal places.
A) 0.0446
B) 0.0223
C) 0.2446
D) 0.4446
E) 0.9554
. Round your answer to four decimal places. A) 0.0446
B) 0.0223
C) 0.2446
D) 0.4446
E) 0.9554
Question
Suppose a population of scores x is normally distributed with  and
and  . Use the standard normal distribution to find
  . Round your answer to four decimal places.
A) 0.1056
B) 0.6056
C) 0.8944
D) 0.3944
E) 0.4000
and . Use the standard normal distribution to find . Round your answer to four decimal places. A) 0.1056
B) 0.6056
C) 0.8944
D) 0.3944
E) 0.4000

Unlock Deck
Sign up to unlock the cards in this deck!
Unlock Deck
Unlock Deck
1/114
Play
Full screen (f)
Deck 8: Further Topics in Probability and Data Description
1
Suppose a fair die is rolled 13 times. What is the probability that 1 "aces" (1's) will occur? Round your answer to six digital places.
A) Pr(1 Aces) = 0.033399
B) Pr(1 Aces) = 0.001587
C) Pr(1 Aces) = 0.000016
D) Pr(1 Aces) = 0.000000
E) Pr(1 Aces) = 0.243006
A) Pr(1 Aces) = 0.033399
B) Pr(1 Aces) = 0.001587
C) Pr(1 Aces) = 0.000016
D) Pr(1 Aces) = 0.000000
E) Pr(1 Aces) = 0.243006
Pr(1 Aces) = 0.243006
2
A bag contains 5 red balls and 2 black balls. We draw 5 balls, with each one replaced before the next is drawn. What is the probability that 3 balls drawn will be red? Round your answer to six decimal places.
A) Pr(3 Red) = 0.600000
B) Pr(3 Red) = 0.014875
C) Pr(3 Red) = 0.297495
D) Pr(3 Red) = 0.002479
E) Pr(3 Red) = 0.578330
A) Pr(3 Red) = 0.600000
B) Pr(3 Red) = 0.014875
C) Pr(3 Red) = 0.297495
D) Pr(3 Red) = 0.002479
E) Pr(3 Red) = 0.578330
Pr(3 Red) = 0.297495
3
If the probability that a certain couple will have a blue-eyed child is , and they have 12 children, what is the probability that at least 1 child has blue eyes?
A)
B)
C)
D)
E)
, and they have 12 children, what is the probability that at least 1 child has blue eyes? A)
B)
C)
D)
E)
4
Suppose that 30% of the patients who have a certain disease die from it. If 13 patients have the disease, what is the probability that no more than 4 patients will die from it? Round your answer to six decimal places.
A) Pr(Deaths 4) = 0.308168
B) Pr(Deaths 4) = 0.192789
C) Pr(Deaths 4) = 0.356936
D) Pr(Deaths 4) = 0.898811
E) Pr(Deaths 4) = 0.451835
A) Pr(Deaths
4) = 0.308168B) Pr(Deaths
4) = 0.192789C) Pr(Deaths
4) = 0.356936D) Pr(Deaths
4) = 0.898811E) Pr(Deaths
4) = 0.451835 Unlock Deck
Unlock for access to all 114 flashcards in this deck.
Unlock Deck
k this deck
5
A bag contains 6 red balls and 6 black balls. We draw 6 balls, with each one replaced before the next is drawn. What is the probability that at least 4 black balls will be drawn? Round your answer to five decimal places.
A) 0.23438
B) 0.09375
C) 0.01563
D) 0.32813
E) 0.34375
A) 0.23438
B) 0.09375
C) 0.01563
D) 0.32813
E) 0.34375
Unlock Deck
Unlock for access to all 114 flashcards in this deck.
Unlock Deck
k this deck
6
A baseball player has a lifetime batting average of 0.3. If he comes to bat 7 times in a given game, what is the probability that he will get more than 3 hits? Round your answer to six decimal places.
A) Pr(>3 Hits) = 0.873964
B) Pr(>3 Hits) = 0.435285
C) Pr(>3 Hits) = 0.670583
D) Pr(>3 Hits) = 0.208390
E) Pr(>3 Hits) = 0.126036
A) Pr(>3 Hits) = 0.873964
B) Pr(>3 Hits) = 0.435285
C) Pr(>3 Hits) = 0.670583
D) Pr(>3 Hits) = 0.208390
E) Pr(>3 Hits) = 0.126036
Unlock Deck
Unlock for access to all 114 flashcards in this deck.
Unlock Deck
k this deck
7
Suppose a fair die is rolled 10 times. What is the probability that a 6 will occur 3 times in the 10 rolls? Round your answer to six decimal places.
A) Pr(3 6-es) = 0.310091
B) Pr(3 6-es) = 0.155045
C) Pr(3 6-es) = 0.387613
D) Pr(3 6-es) = 0.232568
E) Pr(3 6-es) = 0.193807
A) Pr(3 6-es) = 0.310091
B) Pr(3 6-es) = 0.155045
C) Pr(3 6-es) = 0.387613
D) Pr(3 6-es) = 0.232568
E) Pr(3 6-es) = 0.193807
Unlock Deck
Unlock for access to all 114 flashcards in this deck.
Unlock Deck
k this deck
8
Suppose the probability that a marksman will hit a target each time he shoots is 0.67. If he fires 7 shots at a target, what is the probability he will hit it 2 times? Round your answer to six decimal places.
A) Pr(2 Hits) = 0.036893
B) Pr(2 Hits) = 0.008950
C) Pr(2 Hits) = 0.000615
D) Pr(2 Hits) = 0.012298
E) Pr(2 Hits) = 0.006149
A) Pr(2 Hits) = 0.036893
B) Pr(2 Hits) = 0.008950
C) Pr(2 Hits) = 0.000615
D) Pr(2 Hits) = 0.012298
E) Pr(2 Hits) = 0.006149
Unlock Deck
Unlock for access to all 114 flashcards in this deck.
Unlock Deck
k this deck
9
Suppose a fair coin is tossed 12 times. What is the probability that exactly 10 heads will occur?
A) Pr(10 Heads) =
B) Pr(10 Heads) =
C) Pr(10 Heads) =
D) Pr(10 Heads) =
E) Pr(10 Heads) =
A) Pr(10 Heads) =
B) Pr(10 Heads) =
C) Pr(10 Heads) =
D) Pr(10 Heads) =
E) Pr(10 Heads) =
Unlock Deck
Unlock for access to all 114 flashcards in this deck.
Unlock Deck
k this deck
10
If a fair die is rolled 7 times, what is the probability that an odd number will result 4 times?
A)
B)
C)
D)
E)
A)
B)
C)
D)
E)
Unlock Deck
Unlock for access to all 114 flashcards in this deck.
Unlock Deck
k this deck
11
A multiple-choice test has 28 questions and 3 choices for each question. If a student is totally unprepared and guesses on each question, what is the probability that she will answer 15 questions correctly? Round your answer to four decimal places.
A) 0.0067
B) 0.0134
C) 0.0089
D) 0.0149
E) 0.0206
A) 0.0067
B) 0.0134
C) 0.0089
D) 0.0149
E) 0.0206
Unlock Deck
Unlock for access to all 114 flashcards in this deck.
Unlock Deck
k this deck
12
If the ratio of boys born to girls born is 75 to 60, and if 17 children are born in a certain hospital in a day, what is the probability that 6 of them are boys? Round your answer to six decimal places.
A) Pr(6 Boys) = 0.048634
B) Pr(6 Boys) = 0.024317
C) Pr(6 Boys) = 0.032422
D) Pr(6 Boys) = 0.040528
E) Pr(6 Boys) = 0.019453
A) Pr(6 Boys) = 0.048634
B) Pr(6 Boys) = 0.024317
C) Pr(6 Boys) = 0.032422
D) Pr(6 Boys) = 0.040528
E) Pr(6 Boys) = 0.019453
Unlock Deck
Unlock for access to all 114 flashcards in this deck.
Unlock Deck
k this deck
13
Suppose a pair of dice is thrown 11 times. What is the probability that a sum of 10 occurs exactly 4 times? Round your answer to six decimal places.
A) 0.022053
B) 0.043112
C) 0.071062
D) 0.008655
E) 0.103840
A) 0.022053
B) 0.043112
C) 0.071062
D) 0.008655
E) 0.103840
Unlock Deck
Unlock for access to all 114 flashcards in this deck.
Unlock Deck
k this deck
14
If the probability of success on each trial of an experiment is 0.8, what is the probability of 6 successes in 10 independent trials? Round your answer to four decimal places.
A) Pr(6 Successes) = 0.0440
B) Pr(6 Successes) = 0.0220
C) Pr(6 Successes) = 0.1762
D) Pr(6 Successes) = 0.0881
E) Pr(6 Successes) = 0.3523
A) Pr(6 Successes) = 0.0440
B) Pr(6 Successes) = 0.0220
C) Pr(6 Successes) = 0.1762
D) Pr(6 Successes) = 0.0881
E) Pr(6 Successes) = 0.3523
Unlock Deck
Unlock for access to all 114 flashcards in this deck.
Unlock Deck
k this deck
15
The probability that a certain couple will have a blue-eyed child is , and they have 5 children. What is the probability that none of their children have blue eyes? Round your answer to six decimal places.
A) Pr(0 Blue) = 0
B) Pr(0 Blue) = 0.001978
C) Pr(0 Blue) = 0.000260
D) Pr(0 Blue) = 0.000648
E) Pr(0 Blue) = 1
, and they have 5 children. What is the probability that none of their children have blue eyes? Round your answer to six decimal places. A) Pr(0 Blue) = 0
B) Pr(0 Blue) = 0.001978
C) Pr(0 Blue) = 0.000260
D) Pr(0 Blue) = 0.000648
E) Pr(0 Blue) = 1
Unlock Deck
Unlock for access to all 114 flashcards in this deck.
Unlock Deck
k this deck
16
If records indicate that 8 houses out of 1000 are expected to be damaged by fire in any year, what is the probability that a woman who owns 16 houses will have fire damage in 2 of them in a year? Round your answers to six decimal places.
A) Pr(2 Fires) = 0.003432
B) Pr(2 Fires) = 0.006863
C) Pr(2 Fires) = 0.034316
D) Pr(2 Fires) = 0.005719
E) Pr(2 Fires) = 0.013726
A) Pr(2 Fires) = 0.003432
B) Pr(2 Fires) = 0.006863
C) Pr(2 Fires) = 0.034316
D) Pr(2 Fires) = 0.005719
E) Pr(2 Fires) = 0.013726
Unlock Deck
Unlock for access to all 114 flashcards in this deck.
Unlock Deck
k this deck
17
In a certain school district, 23% of the faculty use none of their sick days in a school year. Find the probability that 4 faculty members selected at random used no sick days in a given year. Round your answer to eight decimal places.
A) 0.00279841
B) 0.01216700
C) 0.00064363
D) 0.35153041
E) 0.45653300
A) 0.00279841
B) 0.01216700
C) 0.00064363
D) 0.35153041
E) 0.45653300
Unlock Deck
Unlock for access to all 114 flashcards in this deck.
Unlock Deck
k this deck
18
The manager of a store buys portable radios in lots of 12. Suppose that, on the average, 2 out of each group of 12 are defective. The manager randomly selects 6 radios out of the group to test. What is the probability that he will find 3 defective radios? Round your answer to six decimal places.
A) Pr(3 Defective) = 0.017861
B) Pr(3 Defective) = 0.021433
C) Pr(3 Defective) = 0.035722
D) Pr(3 Defective) = 0.026792
E) Pr(3 Defective) = 0.053584
A) Pr(3 Defective) = 0.017861
B) Pr(3 Defective) = 0.021433
C) Pr(3 Defective) = 0.035722
D) Pr(3 Defective) = 0.026792
E) Pr(3 Defective) = 0.053584
Unlock Deck
Unlock for access to all 114 flashcards in this deck.
Unlock Deck
k this deck
19
It has been determined empirically that the probability that a given cell will survive for a given period of time is 0.65. Find the probability that 3 out of 7 of these cells will survive for this period of time. Round your answer to six decimal places.
A) Pr(3 Survive) = 0.072119
B) Pr(3 Survive) = 0.096159
C) Pr(3 Survive) = 0.144238
D) Pr(3 Survive) = 0.057695
E) Pr(3 Survive) = 0.125425
A) Pr(3 Survive) = 0.072119
B) Pr(3 Survive) = 0.096159
C) Pr(3 Survive) = 0.144238
D) Pr(3 Survive) = 0.057695
E) Pr(3 Survive) = 0.125425
Unlock Deck
Unlock for access to all 114 flashcards in this deck.
Unlock Deck
k this deck
20
A family has 5 children. If the probability that each child is a girl is 0.5, what is the probability that 4 of the children are girls? Round your answer to six decimal places.
A) Pr(4 Girls) = 0.078125
B) Pr(4 Girls) = 0.039063
C) Pr(4 Girls) = 0.156250
D) Pr(4 Girls) = 0.062500
E) Pr(4 Girls) = 0.125000
A) Pr(4 Girls) = 0.078125
B) Pr(4 Girls) = 0.039063
C) Pr(4 Girls) = 0.156250
D) Pr(4 Girls) = 0.062500
E) Pr(4 Girls) = 0.125000
Unlock Deck
Unlock for access to all 114 flashcards in this deck.
Unlock Deck
k this deck
21
Suppose the probability of suicide among a certain age group is 0.006. If a randomly selected group of 150 Native Americans within this age group had no suicides, find the probability of this occurring by chance. Round your answer to four decimal places.
A) 0.3818
B) 0.3595
C) 0.4055
D) 0.2221
E) 0.2661
A) 0.3818
B) 0.3595
C) 0.4055
D) 0.2221
E) 0.2661
Unlock Deck
Unlock for access to all 114 flashcards in this deck.
Unlock Deck
k this deck
22
Find the mode of the following data. Round your answer to the nearest integer.
Interval
Frequency 5 9 4 2 3
A) 29
B) 34
C) 14
D) 24
E) 19
Interval
Frequency
5 9 4 2 3A) 29
B) 34
C) 14
D) 24
E) 19
Unlock Deck
Unlock for access to all 114 flashcards in this deck.
Unlock Deck
k this deck
23
Find the median of the set of scores.
44, 86, 92, 58, 62, 70, 92
A) 58
B) 72
C) 92
D) 70
E) 48
44, 86, 92, 58, 62, 70, 92
A) 58
B) 72
C) 92
D) 70
E) 48
Unlock Deck
Unlock for access to all 114 flashcards in this deck.
Unlock Deck
k this deck
24
Find the mode of the set of scores.
6, 11, 12, 6, 7, 5, 6, 5
A) 6
B) 7.25
C) 5
D) 8
E) 7
6, 11, 12, 6, 7, 5, 6, 5
A) 6
B) 7.25
C) 5
D) 8
E) 7
Unlock Deck
Unlock for access to all 114 flashcards in this deck.
Unlock Deck
k this deck
25
Find the standard deviation of the sample data in the frequency table. Round your answer to two decimal places.
A) 2.79
B) 39.00
C) 2.49
D) 1.58
E) 2.50
A) 2.79
B) 39.00
C) 2.49
D) 1.58
E) 2.50
Unlock Deck
Unlock for access to all 114 flashcards in this deck.
Unlock Deck
k this deck
26
In a certain community, 45% of the population is Jewish. A study shows that of 12 social service agencies, 4 have board presidents who are Jewish. Find the probability that this could happen by chance. Round your answer to six decimal places.
A) Pr(4 Jewish Presidents) = 0.169964
B) Pr(4 Jewish Presidents) = 0.076165
C) Pr(4 Jewish Presidents) = 0.041006
D) Pr(4 Jewish Presidents) = 0.150000
E) Pr(4 Jewish Presidents) = 0.007407
A) Pr(4 Jewish Presidents) = 0.169964
B) Pr(4 Jewish Presidents) = 0.076165
C) Pr(4 Jewish Presidents) = 0.041006
D) Pr(4 Jewish Presidents) = 0.150000
E) Pr(4 Jewish Presidents) = 0.007407
Unlock Deck
Unlock for access to all 114 flashcards in this deck.
Unlock Deck
k this deck
27
Find the mean of the following data. Round your answer to the nearest integer.
A) 24
B) 64
C) 41
D) 60
E) 102
A) 24
B) 64
C) 41
D) 60
E) 102
Unlock Deck
Unlock for access to all 114 flashcards in this deck.
Unlock Deck
k this deck
28
The following table gives a city's unemployment rates for civilian workers for selected years from 1960 to 2004. Which bar graph represents the information given in the table?
A)
B)
C)
D)
E)
A)
B)
C)
D)
E)
Unlock Deck
Unlock for access to all 114 flashcards in this deck.
Unlock Deck
k this deck
29
Which list of data is displayed in this frequency histogram?
A) 0, 0, 0, 0, 0, 1, 1, 2, 2, 4, 4, 5, 5, 5, 5
B) 1, 1, 1, 1, 2, 2, 2, 3, 4, 5, 5, 5, 5
C) 0, 1, 2, 3, 3, 3, 3, 3, 5, 5, 5, 5, 6, 6
D) 0, 0, 0, 2, 2, 4, 4, 4, 5, 5, 5, 5, 6, 6, 6, 6, 6
E) 0, 0, 0, 0, 1, 1, 1, 2, 2, 4, 4, 4, 5, 5, 5, 5, 6, 6, 6, 6
A) 0, 0, 0, 0, 0, 1, 1, 2, 2, 4, 4, 5, 5, 5, 5
B) 1, 1, 1, 1, 2, 2, 2, 3, 4, 5, 5, 5, 5
C) 0, 1, 2, 3, 3, 3, 3, 3, 5, 5, 5, 5, 6, 6
D) 0, 0, 0, 2, 2, 4, 4, 4, 5, 5, 5, 5, 6, 6, 6, 6, 6
E) 0, 0, 0, 0, 1, 1, 1, 2, 2, 4, 4, 4, 5, 5, 5, 5, 6, 6, 6, 6
Unlock Deck
Unlock for access to all 114 flashcards in this deck.
Unlock Deck
k this deck
30
Find the variance of the set of sample data.
83, 89, 87, 99, 92, 99
A) 42.3
B) 90.5
C) 91.5
D) 549
E) 6.5
83, 89, 87, 99, 92, 99
A) 42.3
B) 90.5
C) 91.5
D) 549
E) 6.5
Unlock Deck
Unlock for access to all 114 flashcards in this deck.
Unlock Deck
k this deck
31
A quiz consists of 10 multiple-choice questions with 5 choices for each question. Suppose a student is sure of the first 5 answers and has each of the last 5 questions narrowed to 3 of the possible 5 choices. If the student guesses among the narrowed choices on the last 5 questions, find the probability of getting at least a C (at least 70%). Round your answer to four decimal places.
A) Pr(Grade ≥ C) = 0.0412
B) Pr(Grade ≥ C) = 0.4200
C) Pr(Grade ≥ C) = 0.5391
D) Pr(Grade ≥ C) = 0.4609
E) Pr(Grade ≥ C) = 0.0163
A) Pr(Grade ≥ C) = 0.0412
B) Pr(Grade ≥ C) = 0.4200
C) Pr(Grade ≥ C) = 0.5391
D) Pr(Grade ≥ C) = 0.4609
E) Pr(Grade ≥ C) = 0.0163
Unlock Deck
Unlock for access to all 114 flashcards in this deck.
Unlock Deck
k this deck
32
Find the mode(s) of the scores.
11, 12, 14, 10, 18, 12, 13, 14
A) 12
B) 12, 13
C) 13
D) 14
E) 12, 14
11, 12, 14, 10, 18, 12, 13, 14
A) 12
B) 12, 13
C) 13
D) 14
E) 12, 14
Unlock Deck
Unlock for access to all 114 flashcards in this deck.
Unlock Deck
k this deck
33
Find the range of the set of numbers given.
2, 9, 4, 2, 7, 3, 8
A) 4
B) 2
C) 7
D) 5
E) 8
2, 9, 4, 2, 7, 3, 8
A) 4
B) 2
C) 7
D) 5
E) 8
Unlock Deck
Unlock for access to all 114 flashcards in this deck.
Unlock Deck
k this deck
34
Find the median of the set of scores.
16, 19, 21, 30, 40, 26, 24, 32
A) 25
B) 12
C) 35
D) 24
E) 30
16, 19, 21, 30, 40, 26, 24, 32
A) 25
B) 12
C) 35
D) 24
E) 30
Unlock Deck
Unlock for access to all 114 flashcards in this deck.
Unlock Deck
k this deck
35
Which frequency histogram best describes the data given in the frequency table?
A)
B)
C)
D)
E)
A)
B)
C)
D)
E)
Unlock Deck
Unlock for access to all 114 flashcards in this deck.
Unlock Deck
k this deck
36
Find the mean of the set of sample data.
58, 62, 90, 82, 76, 60, 90
A) 76
B) 74
C) 32
D) 82
E) 90
58, 62, 90, 82, 76, 60, 90
A) 76
B) 74
C) 32
D) 82
E) 90
Unlock Deck
Unlock for access to all 114 flashcards in this deck.
Unlock Deck
k this deck
37
A company produces shotgun shells in batches of 100. A sample of 5 is tested from each batch, and if more than one defect is found, the entire batch is tested. If 4% of the shells are actually defective, what is the probability of more than 1 defective shell in a batch of 5? Round your answer to six decimal places.
A) Pr(>1 Defect) = 0.002000
B) Pr(>1 Defect) = 0.169869
C) Pr(>1 Defect) = 0.014156
D) Pr(>1 Defect) = 0.014758
E) Pr(>1 Defect) = 0.008000
A) Pr(>1 Defect) = 0.002000
B) Pr(>1 Defect) = 0.169869
C) Pr(>1 Defect) = 0.014156
D) Pr(>1 Defect) = 0.014758
E) Pr(>1 Defect) = 0.008000
Unlock Deck
Unlock for access to all 114 flashcards in this deck.
Unlock Deck
k this deck
38
Find the median of the set of scores.
24)8, 28.4, 27.3, 27.3, 29.2
A) 28.4
B) 29.2
C) 12.4
D) 13.7
E) 27.3
24)8, 28.4, 27.3, 27.3, 29.2
A) 28.4
B) 29.2
C) 12.4
D) 13.7
E) 27.3
Unlock Deck
Unlock for access to all 114 flashcards in this deck.
Unlock Deck
k this deck
39
Which frequency table best describes the data displayed in the frequency histogram?
A)
B)
C)
D)
E)
A)
B)
C)
D)
E)
Unlock Deck
Unlock for access to all 114 flashcards in this deck.
Unlock Deck
k this deck
40
Find the mean of the scores.
7, 3, 4, 1, 6, 3
A) 3.5
B) 4
C) 3
D) 2.5
E) 6
7, 3, 4, 1, 6, 3
A) 3.5
B) 4
C) 3
D) 2.5
E) 6
Unlock Deck
Unlock for access to all 114 flashcards in this deck.
Unlock Deck
k this deck
41
The following bar graph shows the size of the average farm (in acres) for selected years from 1940 to 2000. Which table shows the data displayed in the graph?
A)
B)
C)
D)
E)
A)
B)
C)
D)
E)
Unlock Deck
Unlock for access to all 114 flashcards in this deck.
Unlock Deck
k this deck
42
Determine y, if possible, so that the table describes a discrete probability distribution.
X
P(x)
1 2 3 4
Y
A) y =
B) y =
C)
D)
E) not possible
X
P(x)
1
2 3 4Y
A) y =
B) y =
C)
D)
E) not possible
Unlock Deck
Unlock for access to all 114 flashcards in this deck.
Unlock Deck
k this deck
43
Determine c, if possible, so that the formula describes a discrete probability distribution.
A) 11
B)
C) 35
D)
E) not possible
describes a discrete probability distribution. A) 11
B)
C) 35
D)
E) not possible
Unlock Deck
Unlock for access to all 114 flashcards in this deck.
Unlock Deck
k this deck
44
The birth weights (in kilograms) of a sample of 160 children are given in the following table. What is the mean of the weights? Round your answer to two decimal places.
A) 5.12
B) 16.15
C) 3.35
D) 3.38
E) 16.00
A) 5.12
B) 16.15
C) 3.35
D) 3.38
E) 16.00
Unlock Deck
Unlock for access to all 114 flashcards in this deck.
Unlock Deck
k this deck
45
The table below gives the votes in favor of the measure "Amend the state constitution to recognize marriage only between a man and a woman" in states that had it on the ballot. What is the mean of the state percents favoring this measure? Round your answer to two decimal places.
A) 70.00
B) 73.36
C) 67.25
D) 16.14
E) 80.70
A) 70.00
B) 73.36
C) 67.25
D) 16.14
E) 80.70
Unlock Deck
Unlock for access to all 114 flashcards in this deck.
Unlock Deck
k this deck
46
A new car with a $19,700 list price can be bought for different prices from different dealers. In one city the car can be bought for $18,900 from 2 dealers, for $17,500 from 1 dealer, for $17800 from 3 dealers, for $18,300 from 2 dealers, and for $18,200 from 2 dealers. What are the mean and standard deviation of this sample of car prices? Round your answer to two decimal places wherever applicable.
A)
B)
C)
D)
E)
A)
B)
C)
D)
E)
Unlock Deck
Unlock for access to all 114 flashcards in this deck.
Unlock Deck
k this deck
47
The percents of total households that contain married couples for the years 1982 to 2006 are given in the table below. Construct a frequency histogram of the percents.
A)
B)
C)
D)
E)
A)
B)
C)
D)
E)
Unlock Deck
Unlock for access to all 114 flashcards in this deck.
Unlock Deck
k this deck
48
The following table defines a discrete probability distribution. Find the expected value of the distribution.
A)
B)
C)
D)
E)
A)
B)
C)
D)
E)
Unlock Deck
Unlock for access to all 114 flashcards in this deck.
Unlock Deck
k this deck
49
A die is rolled 2 times, and success is rolling a number greater than 3. Let x = number of success. Construct the binomial distribution that describes this experiment, and find the mean of this distribution.
A)
B)
C)
D)
E)
A)
B)
C)
D)
E)
Unlock Deck
Unlock for access to all 114 flashcards in this deck.
Unlock Deck
k this deck
50
Data on the amounts of federal on-budget funds for research programs at universities and related institutions for selected years appear in the table below. What is the standard deviation of the federal on-budget funds for research programs for this period? Round your answer to three decimal places.
A) 10.125
B) 8.000
C) 7.990
D) 11.571
E) 7.474
A) 10.125
B) 8.000
C) 7.990
D) 11.571
E) 7.474
Unlock Deck
Unlock for access to all 114 flashcards in this deck.
Unlock Deck
k this deck
51
A variable x has a binomial distribution with probability of success 0.65 for each trial. For a total of 50 trials, what are the mean and the standard deviation of the distribution?
A)
B)
C)
D)
E)
A)
B)
C)
D)
E)
Unlock Deck
Unlock for access to all 114 flashcards in this deck.
Unlock Deck
k this deck
52
Suppose a company has 11 employees, 1 earning $160,000, 2 earning $120,000, 3 earning $60,000, 4 earning $40,000, and 1 earning $32,000. What is the mode of the salaries?
A) $40,000
B) $59,273
C) $60,000
D) $82,400
E) $160,000
A) $40,000
B) $59,273
C) $60,000
D) $82,400
E) $160,000
Unlock Deck
Unlock for access to all 114 flashcards in this deck.
Unlock Deck
k this deck
53
The following table defines a discrete probability distribution. Find the expected value of the distribution.
A) E(x)=
B) E(x)=
C) E(x)=
D) E(x)=10
E) E(x)=1
A) E(x)=
B) E(x)=
C) E(x)=
D) E(x)=10
E) E(x)=1
Unlock Deck
Unlock for access to all 114 flashcards in this deck.
Unlock Deck
k this deck
54
A coin is "loaded" so that the probability of tossing a head is . If it is tossed 24 times, what are the mean and the standard deviation of the number of heads that occur?
A)
B)
C)
D)
E)
. If it is tossed 24 times, what are the mean and the standard deviation of the number of heads that occur? A)
B)
C)
D)
E)
Unlock Deck
Unlock for access to all 114 flashcards in this deck.
Unlock Deck
k this deck
55
Determine c, if possible, so that the formula describes a discrete probability distribution.
A) 2
B)
C) 194
D) 33
E) not possible
describes a discrete probability distribution. A) 2
B)
C) 194
D) 33
E) not possible
Unlock Deck
Unlock for access to all 114 flashcards in this deck.
Unlock Deck
k this deck
56
Estimate the variance for the following probability distribution to two decimal places.
A) 2.16
B) 1.33
C) 1.16
D) 1.78
E) 1.00
A) 2.16
B) 1.33
C) 1.16
D) 1.78
E) 1.00
Unlock Deck
Unlock for access to all 114 flashcards in this deck.
Unlock Deck
k this deck
57
Suppose a pair of dice is thrown 950 times. Estimate how many times would we expect a sum of 5 to occur? Round your answer to the nearest integer.
A) 844 times
B) 633 times
C) 106 times
D) 158 times
E) 132 times
A) 844 times
B) 633 times
C) 106 times
D) 158 times
E) 132 times
Unlock Deck
Unlock for access to all 114 flashcards in this deck.
Unlock Deck
k this deck
58
Suppose an experiment has five possible outcomes for x: 1, 2, 3, 4, 5. The probability that each of these outcomes occurs is . Estimate the expected value of x for the experiment to two decimal places?
A)
B)
C)
D)
E)
. Estimate the expected value of x for the experiment to two decimal places? A)
B)
C)
D)
E)
Unlock Deck
Unlock for access to all 114 flashcards in this deck.
Unlock Deck
k this deck
59
Estimate the variance for the following probability distribution to two decimal places.
A) 1.89
B) 1.99
C) 1.41
D) 3.95
E) 1.00
A) 1.89
B) 1.99
C) 1.41
D) 3.95
E) 1.00
Unlock Deck
Unlock for access to all 114 flashcards in this deck.
Unlock Deck
k this deck
60
Suppose you live in a neighborhood with a few expensive homes and many modest homes. If you wanted to impress people with the neighborhood where you lived, which measure would you give as the "average" property value?
A) median
B) minimum
C) standard deviation
D) mean
E) range
A) median
B) minimum
C) standard deviation
D) mean
E) range
Unlock Deck
Unlock for access to all 114 flashcards in this deck.
Unlock Deck
k this deck
61
Suppose a population of scores x is normally distributed with and Use the standard normal distribution to find . Round your answer to four decimal places.
A) 0.0980
B) 0.1378
C) 0.2358
D) 0.0398
E) 0.1179
and Use the standard normal distribution to find . Round your answer to four decimal places. A) 0.0980
B) 0.1378
C) 0.2358
D) 0.0398
E) 0.1179
Unlock Deck
Unlock for access to all 114 flashcards in this deck.
Unlock Deck
k this deck
62
A young man plans to sell umbrellas at the city's Easter Parade. He knows that he can sell 152 umbrellas at $14 each if it rains hard, he can sell 108 if it rains lightly, and he can sell 41 if it doesn't rain at all. Past records show it rains hard 28% of the time on Easter, rains lightly 69% of the time, and does not rain at all 3% of the time. If he can buy 0, 100, or 200 umbrellas at $5 each and return the unsold ones for $3 each, how many should he buy?
A) 200 umbrellas
B) 100 umbrellas
A) 200 umbrellas
B) 100 umbrellas
Unlock Deck
Unlock for access to all 114 flashcards in this deck.
Unlock Deck
k this deck
63
Suppose a population of scores x is normally distributed with and . Use the standard normal distribution to find . Round your answer to four decimal places.
A) 0.1915
B) 0.5000
C) 0.8085
D) 0.0958
E) 0.6915
and . Use the standard normal distribution to find . Round your answer to four decimal places. A) 0.1915
B) 0.5000
C) 0.8085
D) 0.0958
E) 0.6915
Unlock Deck
Unlock for access to all 114 flashcards in this deck.
Unlock Deck
k this deck
64
Expand
A)
B)
C)
D)
E)
A)
B)
C)
D)
E)
Unlock Deck
Unlock for access to all 114 flashcards in this deck.
Unlock Deck
k this deck
65
Suppose that 8% of the patients who have a certain disease will die from it. If 80 people have the disease, how many would we expect to die from it, and what is the standard deviation of the number of deaths that could occur? Round any estimated quantities to two decimal places.
A)
B)
C)
D)
E)
A)
B)
C)
D)
E)
Unlock Deck
Unlock for access to all 114 flashcards in this deck.
Unlock Deck
k this deck
66
A car owner must decide whether she should take out a $100-deductible collision policy in addition to her liability insurance policy. Records show that each year, in her area, 17% of the drivers have an accident that is their fault or for which no fault is assigned, and that the average cost of repairs for these types of accidents is $1200. If the $100-deductible collision policy costs $100 per year, would she save money in the long run by buying the insurance or "taking the chance"? (Hint: Find the expected values if she has the policy and if she doesn't have the policy and compare them.)
A) by buying the insurance
B) by taking the chance
A) by buying the insurance
B) by taking the chance
Unlock Deck
Unlock for access to all 114 flashcards in this deck.
Unlock Deck
k this deck
67
In studying a certain endangered species, scientists have found that when the animals are relocated, it takes x years without offspring before the first young are born, where x and the probability of x are given below. What is the expected number of years before the first young are born?
A) 1.96 years
B) 0.96 years
C) 0.64 years
D) 1.56 years
E) 1.68 years
A) 1.96 years
B) 0.96 years
C) 0.64 years
D) 1.56 years
E) 1.68 years
Unlock Deck
Unlock for access to all 114 flashcards in this deck.
Unlock Deck
k this deck
68
Use a table of the standard normal distribution to find the probability that a z-score from the standard normal distribution will lie within the interval . Round your answer to four decimal places.
A) 0.4643
B) 0.9285
C) 0.0715
D) 0.1715
E) 0.6964
. Round your answer to four decimal places. A) 0.4643
B) 0.9285
C) 0.0715
D) 0.1715
E) 0.6964
Unlock Deck
Unlock for access to all 114 flashcards in this deck.
Unlock Deck
k this deck
69
A candidate must decide whether he should spend his time and money on TV commercials or making personal appearances. His staff determines that by using TV he can reach 110,000 people with probability 0.06, 55,000 people with probability 0.39, and 30,000 people with probability 0.55; by making personal appearances he can reach 80,000 people with probability 0.04, 60,000 people with probability 0.36, and 25,000 people with probability 0.6. In the following table, x represents the number of people reached by each choice. In each case, find the expected value of x to decide which method, if either, will reach more people.
A)
B)
C)
D)
E)
A)
B)
C)
D)
E)
Unlock Deck
Unlock for access to all 114 flashcards in this deck.
Unlock Deck
k this deck
70
A multiple-choice test has 45 questions and 5 choices for each question. If a student is totally unprepared and guesses on each question, how many questions can she expect to answer correctly, and what is the standard deviation of the number of correct answers? Round any estimated quantities to two decimal places.
A)
B)
C)
D)
E)
A)
B)
C)
D)
E)
Unlock Deck
Unlock for access to all 114 flashcards in this deck.
Unlock Deck
k this deck
71
Suppose a population of scores x is normally distributed with and . Use the standard normal distribution to find . Round your answer to four decimal places.
A) 0.1368
B) 0.7264
C) 0.7736
D) 0.2264
E) 0.2736
and . Use the standard normal distribution to find . Round your answer to four decimal places. A) 0.1368
B) 0.7264
C) 0.7736
D) 0.2264
E) 0.2736
Unlock Deck
Unlock for access to all 114 flashcards in this deck.
Unlock Deck
k this deck
72
A candidate claims that 60% of the voters in his district will vote for him. If his district contains 120,300 voters, how many votes does he expect to get from his district, and what is the standard deviation of the number of these votes? Round any estimated quantities to the nearest integer.
A)
B)
C)
D)
E)
A)
B)
C)
D)
E)
Unlock Deck
Unlock for access to all 114 flashcards in this deck.
Unlock Deck
k this deck
73
Suppose that a student is offered a chance to draw a card from an ordinary deck of 52 playing cards and win $18 for an ace, $8 for a king, and $1 for a queen. If $5 must be paid to play the game, what is the expected loss every time the game is played by the student?
A) expected loss $4.08
B) expected loss $2.92
C) expected loss $5.00
D) expected loss $2.08
E) expected loss $1.77
A) expected loss $4.08
B) expected loss $2.92
C) expected loss $5.00
D) expected loss $2.08
E) expected loss $1.77
Unlock Deck
Unlock for access to all 114 flashcards in this deck.
Unlock Deck
k this deck
74
An insurance company insures 100,000 cars in a certain area. The company has determined that on average, each year they will have to pay the following amounts for accidents in the area:
$100,000 with probability 0.0004
$50,000 with probability 0.001
$25,000 with probability 0.006
$5000 with probability 0.011
$1000 with probability 0.023
What is the company's expected payout per car each year?
A) $318.00
B) $4163.00
C) $4140.00
D) $381.60
E) $279.84
$100,000 with probability 0.0004
$50,000 with probability 0.001
$25,000 with probability 0.006
$5000 with probability 0.011
$1000 with probability 0.023
What is the company's expected payout per car each year?
A) $318.00
B) $4163.00
C) $4140.00
D) $381.60
E) $279.84
Unlock Deck
Unlock for access to all 114 flashcards in this deck.
Unlock Deck
k this deck
75
A nonprofit organization sells chances for a $40,000 automobile at $125 per ticket. It sells 2,000 tickets and offers four prizes, summarized in the table that follows. What are the expected winnings (or loss) for each ticket?
A)
B)
C)
D)
E)
A)
B)
C)
D)
E)
Unlock Deck
Unlock for access to all 114 flashcards in this deck.
Unlock Deck
k this deck
76
If the probability that a newborn child is a male is , what is the expected number of male children in a family having 2 children? Round your answer to two decimal places.
A) 1.50
B) 1.13
C) 2.00
D) 0.50
E) 1.00
, what is the expected number of male children in a family having 2 children? Round your answer to two decimal places. A) 1.50
B) 1.13
C) 2.00
D) 0.50
E) 1.00
Unlock Deck
Unlock for access to all 114 flashcards in this deck.
Unlock Deck
k this deck
77
Use a table of the standard normal distribution to find the probability that a z-score from the standard normal distribution will lie within the interval . Round your answer to four decimal places.
A) 0.4969
B) 0.0062
C) 0.6625
D) 0.9938
E) 0.4938
. Round your answer to four decimal places. A) 0.4969
B) 0.0062
C) 0.6625
D) 0.9938
E) 0.4938
Unlock Deck
Unlock for access to all 114 flashcards in this deck.
Unlock Deck
k this deck
78
Forty-nine percent of accountants taking a CPA exam fail the first time. If 1000 candidates take the exam for the first time, what is the expected number that will pass?
A) 951 accountants
B) 949 accountants
C) 851 accountants
D) 490 accountants
E) 510 accountants
A) 951 accountants
B) 949 accountants
C) 851 accountants
D) 490 accountants
E) 510 accountants
Unlock Deck
Unlock for access to all 114 flashcards in this deck.
Unlock Deck
k this deck
79
Use a table of the standard normal distribution to find the probability that a z-score from the standard normal distribution will lie within the interval . Round your answer to four decimal places.
A) 0.0446
B) 0.0223
C) 0.2446
D) 0.4446
E) 0.9554
. Round your answer to four decimal places. A) 0.0446
B) 0.0223
C) 0.2446
D) 0.4446
E) 0.9554
Unlock Deck
Unlock for access to all 114 flashcards in this deck.
Unlock Deck
k this deck
80
Suppose a population of scores x is normally distributed with and . Use the standard normal distribution to find . Round your answer to four decimal places.
A) 0.1056
B) 0.6056
C) 0.8944
D) 0.3944
E) 0.4000
and . Use the standard normal distribution to find . Round your answer to four decimal places. A) 0.1056
B) 0.6056
C) 0.8944
D) 0.3944
E) 0.4000
Unlock Deck
Unlock for access to all 114 flashcards in this deck.
Unlock Deck
k this deck
Unlock Deck
Unlock for access to all 114 flashcards in this deck.


