Deck 2: Section 3: Methods in Psychology
Full screen (f)
Question
Scenario II
A psychologist was interested in the effects of sleep deprivation on performance on a vigilance task. Forty college students served as participants and were placed in either the sleep-deprivation group or the control group by coin flip. Both groups spent the night before the study in a sleep laboratory, but only the control group was allowed to sleep. By the next morning, the sleep-deprived group had been awake for the last 24 hours. At this time, both groups were provided a nutritious breakfast and, shortly thereafter, testing began in sound-attenuating cubicles, each equipped with a computer. The vigilance task consisted of monitoring the computer screen. Participants were instructed that red dots represented allied space crafts and green dots represented enemy space crafts. Throughout the 2-hr hour long task, red dots moved across the screen in irregular patterns. Occasionally and unpredictably, a green dot would quickly move across the screen in a haphazard pattern. When a green dot appeared, the task of the participant was to move a stylus over the green dot and press a button, "destroying" the enemy craft.
The results of this fictitious experiment are shown in Figure 2.2.
Figure 2.2.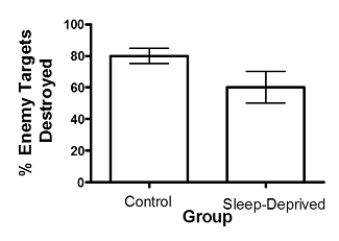
(Scenario II) Vigilance was measured as the percentage of "enemy targets" destroyed. As a measure of vigilance, this illustrates:
A)an operational definition.
B)reliability.
C)statistical significance.
D)a construct.
Question
Scenario II
A psychologist was interested in the effects of sleep deprivation on performance on a vigilance task. Forty college students served as participants and were placed in either the sleep-deprivation group or the control group by coin flip. Both groups spent the night before the study in a sleep laboratory, but only the control group was allowed to sleep. By the next morning, the sleep-deprived group had been awake for the last 24 hours. At this time, both groups were provided a nutritious breakfast and, shortly thereafter, testing began in sound-attenuating cubicles, each equipped with a computer. The vigilance task consisted of monitoring the computer screen. Participants were instructed that red dots represented allied space crafts and green dots represented enemy space crafts. Throughout the 2-hr hour long task, red dots moved across the screen in irregular patterns. Occasionally and unpredictably, a green dot would quickly move across the screen in a haphazard pattern. When a green dot appeared, the task of the participant was to move a stylus over the green dot and press a button, "destroying" the enemy craft.
The results of this fictitious experiment are shown in Figure 2.2.
Figure 2.2.
(Scenario II) The purpose of placing participants into one of the two groups by coin flip was to:
A)eliminate the demand characteristics operating in the study.
B)increase the external validity of the study.
C)help ensure that the two groups were equal on all possible third variables.
D)minimize experimenter bias.
Question
Scenario II
A psychologist was interested in the effects of sleep deprivation on performance on a vigilance task. Forty college students served as participants and were placed in either the sleep-deprivation group or the control group by coin flip. Both groups spent the night before the study in a sleep laboratory, but only the control group was allowed to sleep. By the next morning, the sleep-deprived group had been awake for the last 24 hours. At this time, both groups were provided a nutritious breakfast and, shortly thereafter, testing began in sound-attenuating cubicles, each equipped with a computer. The vigilance task consisted of monitoring the computer screen. Participants were instructed that red dots represented allied space crafts and green dots represented enemy space crafts. Throughout the 2-hr hour long task, red dots moved across the screen in irregular patterns. Occasionally and unpredictably, a green dot would quickly move across the screen in a haphazard pattern. When a green dot appeared, the task of the participant was to move a stylus over the green dot and press a button, "destroying" the enemy craft.
The results of this fictitious experiment are shown in Figure 2.2.
Figure 2.2.
(Scenario II) Shown in Figure 6.2 is the mean and standard deviation of each group's performance. Based only on this figure, what can be concluded?
A)The difference in the sample means is not statistically significant.
B)The difference in the sample means is reliable.
C)On average, the sleep-deprived group performed about as well as the control group.
D)Participants in the sleep-deprived group behaved more variably than those in the control group.
Question
Scenario I
Examine Figure 2.1 and then answer the following questions.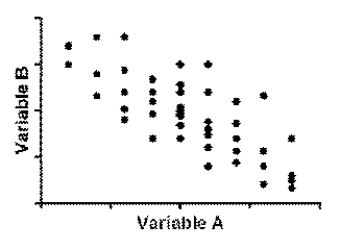
(Scenario I) Which statement is true given that Variables A and B are significantly correlated?
A)Variable A causes Variable B OR Variable B causes Variable A.
B)Knowing the score on Variable A allows for an estimate of the score on Variable B.
C)There is no causal relationship between the two variables.
D)A third variable cannot be responsible for the observed association.
Question
Scenario I
Examine Figure 2.1 and then answer the following questions.
(Scenario I) Which is most likely to be the correlation coefficient (r) between Variables A and B?
A)-)7
B)-)2
C)+)8
D)-1.5
Examine Figure 2.1 and then answer the following questions.
(Scenario I) Which is most likely to be the correlation coefficient (r) between Variables A and B?
A)-)7
B)-)2
C)+)8
D)-1.5
Question
Scenario II
A psychologist was interested in the effects of sleep deprivation on performance on a vigilance task. Forty college students served as participants and were placed in either the sleep-deprivation group or the control group by coin flip. Both groups spent the night before the study in a sleep laboratory, but only the control group was allowed to sleep. By the next morning, the sleep-deprived group had been awake for the last 24 hours. At this time, both groups were provided a nutritious breakfast and, shortly thereafter, testing began in sound-attenuating cubicles, each equipped with a computer. The vigilance task consisted of monitoring the computer screen. Participants were instructed that red dots represented allied space crafts and green dots represented enemy space crafts. Throughout the 2-hr hour long task, red dots moved across the screen in irregular patterns. Occasionally and unpredictably, a green dot would quickly move across the screen in a haphazard pattern. When a green dot appeared, the task of the participant was to move a stylus over the green dot and press a button, "destroying" the enemy craft.
The results of this fictitious experiment are shown in Figure 2.2.
Figure 2.2.
(Scenario II) Participants were placed into groups using:
A)random sampling.
B)random assignment.
C)a double-blind technique.
D)the matched groups technique.
Question
Scenario I
Examine Figure 2.1 and then answer the following questions.
(Scenario I) In a simple correlational design, how would these data be collected?
A)Measure each participant's score on Variables A and B.
B)Randomly assign participants to experience either Variable A or Variable B.
C)Manipulate Variable A and then observe its effects on Variable B.
D)Manipulate both Variables A and B and observe their effects on the target behavior of interest.
Question
Scenario I
Examine Figure 2.1 and then answer the following questions.
(Scenario I) Which of these pairs is MOST likely to represent Variables A and B?
A)height; weight
B)depression level; anxiety level
C)intelligence quotient; income
D)absences in course; score on final exam
Examine Figure 2.1 and then answer the following questions.
(Scenario I) Which of these pairs is MOST likely to represent Variables A and B?
A)height; weight
B)depression level; anxiety level
C)intelligence quotient; income
D)absences in course; score on final exam
Question
Scenario I
Examine Figure 2.1 and then answer the following questions.
(Scenario I) Each data point on the scatterplot represents:
A)a single participant's score on Variable A and B
B)a single participant's score on Variable B
C)the score on Variable B at the group mean of Variable A
D)the score on Variable A at the group mean of Variable B
Question
Scenario II
A psychologist was interested in the effects of sleep deprivation on performance on a vigilance task. Forty college students served as participants and were placed in either the sleep-deprivation group or the control group by coin flip. Both groups spent the night before the study in a sleep laboratory, but only the control group was allowed to sleep. By the next morning, the sleep-deprived group had been awake for the last 24 hours. At this time, both groups were provided a nutritious breakfast and, shortly thereafter, testing began in sound-attenuating cubicles, each equipped with a computer. The vigilance task consisted of monitoring the computer screen. Participants were instructed that red dots represented allied space crafts and green dots represented enemy space crafts. Throughout the 2-hr hour long task, red dots moved across the screen in irregular patterns. Occasionally and unpredictably, a green dot would quickly move across the screen in a haphazard pattern. When a green dot appeared, the task of the participant was to move a stylus over the green dot and press a button, "destroying" the enemy craft.
The results of this fictitious experiment are shown in Figure 2.2.
Figure 2.2.
(Scenario II) The independent variable was:
A)the length of the vigilance task.
B)the instructions given.
C)degree of vigilance.
D)sleep status.
Question
Scenario II
A psychologist was interested in the effects of sleep deprivation on performance on a vigilance task. Forty college students served as participants and were placed in either the sleep-deprivation group or the control group by coin flip. Both groups spent the night before the study in a sleep laboratory, but only the control group was allowed to sleep. By the next morning, the sleep-deprived group had been awake for the last 24 hours. At this time, both groups were provided a nutritious breakfast and, shortly thereafter, testing began in sound-attenuating cubicles, each equipped with a computer. The vigilance task consisted of monitoring the computer screen. Participants were instructed that red dots represented allied space crafts and green dots represented enemy space crafts. Throughout the 2-hr hour long task, red dots moved across the screen in irregular patterns. Occasionally and unpredictably, a green dot would quickly move across the screen in a haphazard pattern. When a green dot appeared, the task of the participant was to move a stylus over the green dot and press a button, "destroying" the enemy craft.
The results of this fictitious experiment are shown in Figure 2.2.
Figure 2.2.
(Scenario II ) Assuming the differences between groups were statistically significant, before concluding that sleep deprivation impairs vigilance, another dependent variable the researchers probably would want to analyze is:
A)the effects of longer or shorter periods of sleep deprivation on vigilance.
B)the number of times participants incorrectly destroyed an allied space craft.
C)how well the task resembles real-world instances of sustained vigilance.
D)the effect of breakfast on performance on the vigilance task.
Question
Scenario I
Examine Figure 2.1 and then answer the following questions.
(Scenario I) Figure 2.1 illustrates a _____ correlation between Variables A and B.
A)moderate positive
B)moderate negative
C)perfect positive
D)perfect negative
Examine Figure 2.1 and then answer the following questions.
(Scenario I) Figure 2.1 illustrates a _____ correlation between Variables A and B.
A)moderate positive
B)moderate negative
C)perfect positive
D)perfect negative

Unlock Deck
Sign up to unlock the cards in this deck!
Unlock Deck
Unlock Deck
1/12
Play
Full screen (f)
Deck 2: Section 3: Methods in Psychology
1
Scenario II
A psychologist was interested in the effects of sleep deprivation on performance on a vigilance task. Forty college students served as participants and were placed in either the sleep-deprivation group or the control group by coin flip. Both groups spent the night before the study in a sleep laboratory, but only the control group was allowed to sleep. By the next morning, the sleep-deprived group had been awake for the last 24 hours. At this time, both groups were provided a nutritious breakfast and, shortly thereafter, testing began in sound-attenuating cubicles, each equipped with a computer. The vigilance task consisted of monitoring the computer screen. Participants were instructed that red dots represented allied space crafts and green dots represented enemy space crafts. Throughout the 2-hr hour long task, red dots moved across the screen in irregular patterns. Occasionally and unpredictably, a green dot would quickly move across the screen in a haphazard pattern. When a green dot appeared, the task of the participant was to move a stylus over the green dot and press a button, "destroying" the enemy craft.
The results of this fictitious experiment are shown in Figure 2.2.
Figure 2.2.
(Scenario II) Vigilance was measured as the percentage of "enemy targets" destroyed. As a measure of vigilance, this illustrates:
A)an operational definition.
B)reliability.
C)statistical significance.
D)a construct.
an operational definition.
2
Scenario II
A psychologist was interested in the effects of sleep deprivation on performance on a vigilance task. Forty college students served as participants and were placed in either the sleep-deprivation group or the control group by coin flip. Both groups spent the night before the study in a sleep laboratory, but only the control group was allowed to sleep. By the next morning, the sleep-deprived group had been awake for the last 24 hours. At this time, both groups were provided a nutritious breakfast and, shortly thereafter, testing began in sound-attenuating cubicles, each equipped with a computer. The vigilance task consisted of monitoring the computer screen. Participants were instructed that red dots represented allied space crafts and green dots represented enemy space crafts. Throughout the 2-hr hour long task, red dots moved across the screen in irregular patterns. Occasionally and unpredictably, a green dot would quickly move across the screen in a haphazard pattern. When a green dot appeared, the task of the participant was to move a stylus over the green dot and press a button, "destroying" the enemy craft.
The results of this fictitious experiment are shown in Figure 2.2.
Figure 2.2.
(Scenario II) The purpose of placing participants into one of the two groups by coin flip was to:
A)eliminate the demand characteristics operating in the study.
B)increase the external validity of the study.
C)help ensure that the two groups were equal on all possible third variables.
D)minimize experimenter bias.
help ensure that the two groups were equal on all possible third variables.
3
Scenario II
A psychologist was interested in the effects of sleep deprivation on performance on a vigilance task. Forty college students served as participants and were placed in either the sleep-deprivation group or the control group by coin flip. Both groups spent the night before the study in a sleep laboratory, but only the control group was allowed to sleep. By the next morning, the sleep-deprived group had been awake for the last 24 hours. At this time, both groups were provided a nutritious breakfast and, shortly thereafter, testing began in sound-attenuating cubicles, each equipped with a computer. The vigilance task consisted of monitoring the computer screen. Participants were instructed that red dots represented allied space crafts and green dots represented enemy space crafts. Throughout the 2-hr hour long task, red dots moved across the screen in irregular patterns. Occasionally and unpredictably, a green dot would quickly move across the screen in a haphazard pattern. When a green dot appeared, the task of the participant was to move a stylus over the green dot and press a button, "destroying" the enemy craft.
The results of this fictitious experiment are shown in Figure 2.2.
Figure 2.2.
(Scenario II) Shown in Figure 6.2 is the mean and standard deviation of each group's performance. Based only on this figure, what can be concluded?
A)The difference in the sample means is not statistically significant.
B)The difference in the sample means is reliable.
C)On average, the sleep-deprived group performed about as well as the control group.
D)Participants in the sleep-deprived group behaved more variably than those in the control group.
Participants in the sleep-deprived group behaved more variably than those in the control group.
4
Scenario I
Examine Figure 2.1 and then answer the following questions.
(Scenario I) Which statement is true given that Variables A and B are significantly correlated?
A)Variable A causes Variable B OR Variable B causes Variable A.
B)Knowing the score on Variable A allows for an estimate of the score on Variable B.
C)There is no causal relationship between the two variables.
D)A third variable cannot be responsible for the observed association.
Unlock Deck
Unlock for access to all 12 flashcards in this deck.
Unlock Deck
k this deck
5
Scenario I
Examine Figure 2.1 and then answer the following questions.
(Scenario I) Which is most likely to be the correlation coefficient (r) between Variables A and B?
A)-)7
B)-)2
C)+)8
D)-1.5
Examine Figure 2.1 and then answer the following questions.
(Scenario I) Which is most likely to be the correlation coefficient (r) between Variables A and B?
A)-)7
B)-)2
C)+)8
D)-1.5
Unlock Deck
Unlock for access to all 12 flashcards in this deck.
Unlock Deck
k this deck
6
Scenario II
A psychologist was interested in the effects of sleep deprivation on performance on a vigilance task. Forty college students served as participants and were placed in either the sleep-deprivation group or the control group by coin flip. Both groups spent the night before the study in a sleep laboratory, but only the control group was allowed to sleep. By the next morning, the sleep-deprived group had been awake for the last 24 hours. At this time, both groups were provided a nutritious breakfast and, shortly thereafter, testing began in sound-attenuating cubicles, each equipped with a computer. The vigilance task consisted of monitoring the computer screen. Participants were instructed that red dots represented allied space crafts and green dots represented enemy space crafts. Throughout the 2-hr hour long task, red dots moved across the screen in irregular patterns. Occasionally and unpredictably, a green dot would quickly move across the screen in a haphazard pattern. When a green dot appeared, the task of the participant was to move a stylus over the green dot and press a button, "destroying" the enemy craft.
The results of this fictitious experiment are shown in Figure 2.2.
Figure 2.2.
(Scenario II) Participants were placed into groups using:
A)random sampling.
B)random assignment.
C)a double-blind technique.
D)the matched groups technique.
Unlock Deck
Unlock for access to all 12 flashcards in this deck.
Unlock Deck
k this deck
7
Scenario I
Examine Figure 2.1 and then answer the following questions.
(Scenario I) In a simple correlational design, how would these data be collected?
A)Measure each participant's score on Variables A and B.
B)Randomly assign participants to experience either Variable A or Variable B.
C)Manipulate Variable A and then observe its effects on Variable B.
D)Manipulate both Variables A and B and observe their effects on the target behavior of interest.
Unlock Deck
Unlock for access to all 12 flashcards in this deck.
Unlock Deck
k this deck
8
Scenario I
Examine Figure 2.1 and then answer the following questions.
(Scenario I) Which of these pairs is MOST likely to represent Variables A and B?
A)height; weight
B)depression level; anxiety level
C)intelligence quotient; income
D)absences in course; score on final exam
Examine Figure 2.1 and then answer the following questions.
(Scenario I) Which of these pairs is MOST likely to represent Variables A and B?
A)height; weight
B)depression level; anxiety level
C)intelligence quotient; income
D)absences in course; score on final exam
Unlock Deck
Unlock for access to all 12 flashcards in this deck.
Unlock Deck
k this deck
9
Scenario I
Examine Figure 2.1 and then answer the following questions.
(Scenario I) Each data point on the scatterplot represents:
A)a single participant's score on Variable A and B
B)a single participant's score on Variable B
C)the score on Variable B at the group mean of Variable A
D)the score on Variable A at the group mean of Variable B
Unlock Deck
Unlock for access to all 12 flashcards in this deck.
Unlock Deck
k this deck
10
Scenario II
A psychologist was interested in the effects of sleep deprivation on performance on a vigilance task. Forty college students served as participants and were placed in either the sleep-deprivation group or the control group by coin flip. Both groups spent the night before the study in a sleep laboratory, but only the control group was allowed to sleep. By the next morning, the sleep-deprived group had been awake for the last 24 hours. At this time, both groups were provided a nutritious breakfast and, shortly thereafter, testing began in sound-attenuating cubicles, each equipped with a computer. The vigilance task consisted of monitoring the computer screen. Participants were instructed that red dots represented allied space crafts and green dots represented enemy space crafts. Throughout the 2-hr hour long task, red dots moved across the screen in irregular patterns. Occasionally and unpredictably, a green dot would quickly move across the screen in a haphazard pattern. When a green dot appeared, the task of the participant was to move a stylus over the green dot and press a button, "destroying" the enemy craft.
The results of this fictitious experiment are shown in Figure 2.2.
Figure 2.2.
(Scenario II) The independent variable was:
A)the length of the vigilance task.
B)the instructions given.
C)degree of vigilance.
D)sleep status.
Unlock Deck
Unlock for access to all 12 flashcards in this deck.
Unlock Deck
k this deck
11
Scenario II
A psychologist was interested in the effects of sleep deprivation on performance on a vigilance task. Forty college students served as participants and were placed in either the sleep-deprivation group or the control group by coin flip. Both groups spent the night before the study in a sleep laboratory, but only the control group was allowed to sleep. By the next morning, the sleep-deprived group had been awake for the last 24 hours. At this time, both groups were provided a nutritious breakfast and, shortly thereafter, testing began in sound-attenuating cubicles, each equipped with a computer. The vigilance task consisted of monitoring the computer screen. Participants were instructed that red dots represented allied space crafts and green dots represented enemy space crafts. Throughout the 2-hr hour long task, red dots moved across the screen in irregular patterns. Occasionally and unpredictably, a green dot would quickly move across the screen in a haphazard pattern. When a green dot appeared, the task of the participant was to move a stylus over the green dot and press a button, "destroying" the enemy craft.
The results of this fictitious experiment are shown in Figure 2.2.
Figure 2.2.
(Scenario II ) Assuming the differences between groups were statistically significant, before concluding that sleep deprivation impairs vigilance, another dependent variable the researchers probably would want to analyze is:
A)the effects of longer or shorter periods of sleep deprivation on vigilance.
B)the number of times participants incorrectly destroyed an allied space craft.
C)how well the task resembles real-world instances of sustained vigilance.
D)the effect of breakfast on performance on the vigilance task.
Unlock Deck
Unlock for access to all 12 flashcards in this deck.
Unlock Deck
k this deck
12
Scenario I
Examine Figure 2.1 and then answer the following questions.
(Scenario I) Figure 2.1 illustrates a _____ correlation between Variables A and B.
A)moderate positive
B)moderate negative
C)perfect positive
D)perfect negative
Examine Figure 2.1 and then answer the following questions.
(Scenario I) Figure 2.1 illustrates a _____ correlation between Variables A and B.
A)moderate positive
B)moderate negative
C)perfect positive
D)perfect negative
Unlock Deck
Unlock for access to all 12 flashcards in this deck.
Unlock Deck
k this deck
Unlock Deck
Unlock for access to all 12 flashcards in this deck.


