Deck 3: Supply and Demand
Full screen (f)
Question
Question
Figure 3-H 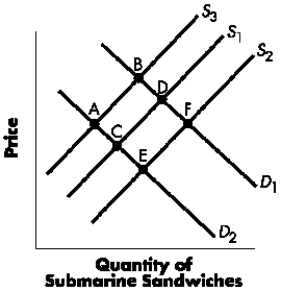
Refer to Figure 3-H.A movement from D1 to D2 could occur if:
A)there is a decrease in the income of consumers and submarine sandwiches are inferior goods.
B)there is an increase in the income of consumers and submarine sandwiches are inferior goods.
C)the wages of submarine sandwich makers decrease.
D)the price of bread, used to make submarine sandwiches, increases.
E)the price of submarine sandwiches falls, leading to a shift of the demand curve to the left.
Question
Question
Figure 3-G
The diagram below represents the market for butter.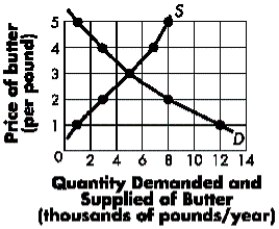
Refer to Figure 3-G.At a market price of $4, there exists a:
A)shortage equal to 4,000 pounds of butter.
B)surplus equal to 4,000 pounds of butter.
C)shortage equal to 7,000 pounds of butter.
D)surplus equal to 7,000 pounds of butter.
E)market equilibrium.
Question
Figure 3-G
The diagram below represents the market for butter.
Refer to Figure 3-G.At a market price of $1, there exists a:
A)shortage equal to 5,000 pounds of butter.
B)surplus equal to 5,000 pounds of butter.
C)shortage equal to 11,000 pounds of butter.
D)surplus equal to 11,000 pounds of butter.
E)market equilibrium.
Question
Figure 3-H
Refer to Figure 3-H.A movement from S1 to S3 could occur if:
A)there is a decrease in the price of submarine sandwiches.
B)there is an increase in price of ingredients such tomatoes and pickles
C)there is a decrease in price of hamburgers, a substitute to submarine sandwiches
D)the price of bread used to make submarine sandwiches decreases
E)promotions on a television program make submarine sandwiches more popular
Question
Figure 3-G
The diagram below represents the market for butter.
Refer to Figure 3-G.If the current price of butter equals $2, you would expect to find:
A)the market in equilibrium at 3,000 pounds per year.
B)the market in equilibrium at 8,000 pounds per year.
C)that the market is not in equilibrium, and that the quantity supplied is greater than the quantity demanded.
D)that the market is not in equilibrium, and that the quantity demanded is greater than the quantity supplied.
Question
Figure 3-H
Refer to Figure 3-H.A decrease in the quantity demanded, but not a decrease in demand, occurs when the equilibrium moves from:
A)Point B to Point D.
B)Point D to Point B.
C)Point D to Point C.
D)Point C to Point D.
E)None of the above are correct.
Refer to Figure 3-H.A decrease in the quantity demanded, but not a decrease in demand, occurs when the equilibrium moves from:
A)Point B to Point D.
B)Point D to Point B.
C)Point D to Point C.
D)Point C to Point D.
E)None of the above are correct.
Question
Question
Figure 3-H
Refer to Figure 3-H.The movement from ____ is consistent with a decrease in demand.
A)Point B to Point D
B)Point D to Point B
C)Point D to Point C
D)Point C to Point D
E)None of the above are correct.
Refer to Figure 3-H.The movement from ____ is consistent with a decrease in demand.
A)Point B to Point D
B)Point D to Point B
C)Point D to Point C
D)Point C to Point D
E)None of the above are correct.
Question
Question
Figure 3-H
Refer to Figure 3-H.A movement from S1 to S2 could occur if:
A)there is an increase in the price of submarine sandwiches.
B)there is an increase in the price of potato chips, a complement to submarine sandwiches.
C)there is a reduction in the price of sliced beef used to make submarine sandwiches.
D)there is an increase in the price of wheat bread used to make submarine sandwiches.
E)consumer tastes change, leading many consumers to choose pizza over submarine sandwiches.
Question
Figure 3-G
The diagram below represents the market for butter.
Refer to Figure 3-G If the current price of butter equals $5, you would expect to find:
A)the market in equilibrium at 2,000 pounds per year.
B)the market in equilibrium at 8,000 pounds per year.
C)that the market is not in equilibrium, and that the quantity supplied is greater than the quantity demanded.
D)that the market is not in equilibrium, and that the quantity demanded is greater than the quantity supplied.
Question
Figure 3-H
Refer to Figure 3-H.The movement from ____ is consistent with an increase in supply.
A)Point B to Point D
B)Point D to Point B
C)Point D to Point C
D)Point C to Point D
E)None of the above are correct.
Refer to Figure 3-H.The movement from ____ is consistent with an increase in supply.
A)Point B to Point D
B)Point D to Point B
C)Point D to Point C
D)Point C to Point D
E)None of the above are correct.
Question
Figure 3-H
Refer to Figure 3-H.An increase in the quantity supplied, but not an increase in supply, occurs when the equilibrium moves from:
A)Point B to Point D.
B)Point D to Point B.
C)Point D to Point C.
D)Point C to Point D.
E)None of the above are correct.
Refer to Figure 3-H.An increase in the quantity supplied, but not an increase in supply, occurs when the equilibrium moves from:
A)Point B to Point D.
B)Point D to Point B.
C)Point D to Point C.
D)Point C to Point D.
E)None of the above are correct.
Question
Question
Question
Question
Figure 3-G
The diagram below represents the market for butter.
Refer to Figure 3-G.The equilibrium price of butter is:
A)$5.
B)$3.
C)$2.
D)$1.
E)50 cents.
The diagram below represents the market for butter.
Refer to Figure 3-G.The equilibrium price of butter is:
A)$5.
B)$3.
C)$2.
D)$1.
E)50 cents.
Question
Question
Question
Figure 3-K 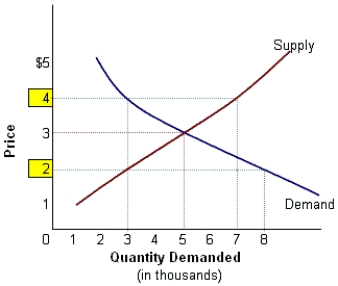
Refer to Figure 3-K.At a market price of $2, which of following conditions exist?
A)Shortage
B)Surplus
C)Equilibrium
D)Either a or b
Refer to Figure 3-K.At a market price of $2, which of following conditions exist?
A)Shortage
B)Surplus
C)Equilibrium
D)Either a or b
Question
Figure 3-A 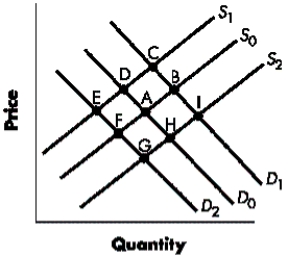
Refer to Figure 3-I.Starting with initial demand curves D0 and S0, a movement from ____ is consistent with an increase in both demand and supply.
A)Point A to Point I
B)Point A to Point C
C)Point A to Point F
D)Point A to Point E
E)Point A to Point D
Refer to Figure 3-I.Starting with initial demand curves D0 and S0, a movement from ____ is consistent with an increase in both demand and supply.
A)Point A to Point I
B)Point A to Point C
C)Point A to Point F
D)Point A to Point E
E)Point A to Point D
Question
Question
Figure 3-J 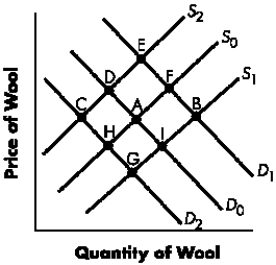
Refer to Figure 3-J.The movement from ____ to ____ is consistent with a decrease in the price of cotton (a substitute).
A)Point A; Point B
B)Point A; Point F
C)Point A; Point D
D)Point A; Point H
E)Point A; Point C
Refer to Figure 3-J.The movement from ____ to ____ is consistent with a decrease in the price of cotton (a substitute).
A)Point A; Point B
B)Point A; Point F
C)Point A; Point D
D)Point A; Point H
E)Point A; Point C
Question
Figure 3-J
Refer to Figure 3-J.The movement from ____ to ____ is consistent with technological improvements in wool mills.
A)Point A; Point B
B)Point A; Point F
C)Point A; Point D
D)Point A; Point H
E)Point A; Point I
Refer to Figure 3-J.The movement from ____ to ____ is consistent with technological improvements in wool mills.
A)Point A; Point B
B)Point A; Point F
C)Point A; Point D
D)Point A; Point H
E)Point A; Point I
Question
Question
Question
Question
Figure 3-J
Refer to Figure 3-J.The movement from ____ to ____ is consistent with a successful advertising campaign that claims wool keeps you warm.
A)Point A; Point B
B)Point A; Point F
C)Point A; Point D
D)Point A; Point H
E)Point A; Point I
Refer to Figure 3-J.The movement from ____ to ____ is consistent with a successful advertising campaign that claims wool keeps you warm.
A)Point A; Point B
B)Point A; Point F
C)Point A; Point D
D)Point A; Point H
E)Point A; Point I
Question
Figure 3-J
Refer to Figure 3-J.The movement from ____ to ____ is consistent with a strike by the Basque Shepherds Guild.
A)Point A; Point I
B)Point A; Point F
C)Point A; Point D
D)Point A; Point H
E)Point A; Point C
Refer to Figure 3-J.The movement from ____ to ____ is consistent with a strike by the Basque Shepherds Guild.
A)Point A; Point I
B)Point A; Point F
C)Point A; Point D
D)Point A; Point H
E)Point A; Point C
Question
Figure 3-K
Refer to Figure 3-K.At a market price of $4, which of following conditions exist?
A)Shortage
B)Surplus
C)Equilibrium
D)Any of the above
Refer to Figure 3-K.At a market price of $4, which of following conditions exist?
A)Shortage
B)Surplus
C)Equilibrium
D)Any of the above
Question
Figure 3-K
Refer to Figure 3-K.The equilibrium price is:
A)$3
B)$1
C)$4
D)Indeterminate
Refer to Figure 3-K.The equilibrium price is:
A)$3
B)$1
C)$4
D)Indeterminate
Question
Question
Question
Question
Question
Question
Figure 3-A
Refer to Figure 3-I.Starting with initial demand curves D0 and S0, a movement from ____ is consistent with a decrease in both demand and supply.
A)Point A to Point I
B)Point A to Point C
C)Point A to Point F
D)Point A to Point E
E)Point A to Point G
Refer to Figure 3-I.Starting with initial demand curves D0 and S0, a movement from ____ is consistent with a decrease in both demand and supply.
A)Point A to Point I
B)Point A to Point C
C)Point A to Point F
D)Point A to Point E
E)Point A to Point G
Question
Question
Question
Question
Question
Question
Question
Question
Question
Question
Question
Question
Question
Question
Question
Question
Question
Question
Question
Question
Question
Question
Question
Question
Question
Question
Question
Question
Question
Question
Question
Question
Question
Question
Question
Question
Question
Question
Question
Question
Question

Unlock Deck
Sign up to unlock the cards in this deck!
Unlock Deck
Unlock Deck
1/252
Play
Full screen (f)
Deck 3: Supply and Demand
1
Table 3-D
Use the following information about demand and supply schedules to answer the question.
-Refer to Table 3-D.Suppose the demand schedule for Good A changes from D1 to D2 because the price of a related good, Good B, decreases.We can say:
A)that Good B is likely a complement to Good A.
B)that Good B is likely a substitute for Good A.
C)that Good B is likely inferior to Good A.
D)that Good B is not related to Good A.
that Good B is likely a complement to Good A.
2
Figure 3-H
Refer to Figure 3-H.A movement from D1 to D2 could occur if:
A)there is a decrease in the income of consumers and submarine sandwiches are inferior goods.
B)there is an increase in the income of consumers and submarine sandwiches are inferior goods.
C)the wages of submarine sandwich makers decrease.
D)the price of bread, used to make submarine sandwiches, increases.
E)the price of submarine sandwiches falls, leading to a shift of the demand curve to the left.
B
3
Table 3-D
Use the following information about demand and supply schedules to answer the question.
-Refer to Table 3-D.If D2 and S1 represent the demand and supply schedules in a particular market, the equilibrium price and quantity are ____ and ____, respectively.
A)$12; 10
B)$12; 9
C)$10; 17
D)$8; 15
E)$6; 13
$8; 15
4
Figure 3-G
The diagram below represents the market for butter.
Refer to Figure 3-G.At a market price of $4, there exists a:
A)shortage equal to 4,000 pounds of butter.
B)surplus equal to 4,000 pounds of butter.
C)shortage equal to 7,000 pounds of butter.
D)surplus equal to 7,000 pounds of butter.
E)market equilibrium.
Unlock Deck
Unlock for access to all 252 flashcards in this deck.
Unlock Deck
k this deck
5
Figure 3-G
The diagram below represents the market for butter.
Refer to Figure 3-G.At a market price of $1, there exists a:
A)shortage equal to 5,000 pounds of butter.
B)surplus equal to 5,000 pounds of butter.
C)shortage equal to 11,000 pounds of butter.
D)surplus equal to 11,000 pounds of butter.
E)market equilibrium.
Unlock Deck
Unlock for access to all 252 flashcards in this deck.
Unlock Deck
k this deck
6
Figure 3-H
Refer to Figure 3-H.A movement from S1 to S3 could occur if:
A)there is a decrease in the price of submarine sandwiches.
B)there is an increase in price of ingredients such tomatoes and pickles
C)there is a decrease in price of hamburgers, a substitute to submarine sandwiches
D)the price of bread used to make submarine sandwiches decreases
E)promotions on a television program make submarine sandwiches more popular
Unlock Deck
Unlock for access to all 252 flashcards in this deck.
Unlock Deck
k this deck
7
Figure 3-G
The diagram below represents the market for butter.
Refer to Figure 3-G.If the current price of butter equals $2, you would expect to find:
A)the market in equilibrium at 3,000 pounds per year.
B)the market in equilibrium at 8,000 pounds per year.
C)that the market is not in equilibrium, and that the quantity supplied is greater than the quantity demanded.
D)that the market is not in equilibrium, and that the quantity demanded is greater than the quantity supplied.
Unlock Deck
Unlock for access to all 252 flashcards in this deck.
Unlock Deck
k this deck
8
Figure 3-H
Refer to Figure 3-H.A decrease in the quantity demanded, but not a decrease in demand, occurs when the equilibrium moves from:
A)Point B to Point D.
B)Point D to Point B.
C)Point D to Point C.
D)Point C to Point D.
E)None of the above are correct.
Refer to Figure 3-H.A decrease in the quantity demanded, but not a decrease in demand, occurs when the equilibrium moves from:
A)Point B to Point D.
B)Point D to Point B.
C)Point D to Point C.
D)Point C to Point D.
E)None of the above are correct.
Unlock Deck
Unlock for access to all 252 flashcards in this deck.
Unlock Deck
k this deck
9
Table 3-D
Use the following information about demand and supply schedules to answer the question.
-Refer to Table 3-D.If D1 and S1 represent the demand and supply schedules in a particular market, the equilibrium price and quantity are ____ and ____, respectively.
A)$8; 15
B)$6; 13
C)$4; 16
D)$4; 11
E)None of the above are correct.
Unlock Deck
Unlock for access to all 252 flashcards in this deck.
Unlock Deck
k this deck
10
Figure 3-H
Refer to Figure 3-H.The movement from ____ is consistent with a decrease in demand.
A)Point B to Point D
B)Point D to Point B
C)Point D to Point C
D)Point C to Point D
E)None of the above are correct.
Refer to Figure 3-H.The movement from ____ is consistent with a decrease in demand.
A)Point B to Point D
B)Point D to Point B
C)Point D to Point C
D)Point C to Point D
E)None of the above are correct.
Unlock Deck
Unlock for access to all 252 flashcards in this deck.
Unlock Deck
k this deck
11
Table 3-D
Use the following information about demand and supply schedules to answer the question.
-Refer to Table 3-D.Suppose the demand schedule for Good A changes from D1 to D2 because the price of a related good, Good B, increases.We can say:
A)that Good B is likely a complement to Good A.
B)that Good B is likely a substitute for Good A.
C)that Good B is likely inferior to Good A.
D)that Good B is not related to Good A.
Unlock Deck
Unlock for access to all 252 flashcards in this deck.
Unlock Deck
k this deck
12
Figure 3-H
Refer to Figure 3-H.A movement from S1 to S2 could occur if:
A)there is an increase in the price of submarine sandwiches.
B)there is an increase in the price of potato chips, a complement to submarine sandwiches.
C)there is a reduction in the price of sliced beef used to make submarine sandwiches.
D)there is an increase in the price of wheat bread used to make submarine sandwiches.
E)consumer tastes change, leading many consumers to choose pizza over submarine sandwiches.
Unlock Deck
Unlock for access to all 252 flashcards in this deck.
Unlock Deck
k this deck
13
Figure 3-G
The diagram below represents the market for butter.
Refer to Figure 3-G If the current price of butter equals $5, you would expect to find:
A)the market in equilibrium at 2,000 pounds per year.
B)the market in equilibrium at 8,000 pounds per year.
C)that the market is not in equilibrium, and that the quantity supplied is greater than the quantity demanded.
D)that the market is not in equilibrium, and that the quantity demanded is greater than the quantity supplied.
Unlock Deck
Unlock for access to all 252 flashcards in this deck.
Unlock Deck
k this deck
14
Figure 3-H
Refer to Figure 3-H.The movement from ____ is consistent with an increase in supply.
A)Point B to Point D
B)Point D to Point B
C)Point D to Point C
D)Point C to Point D
E)None of the above are correct.
Refer to Figure 3-H.The movement from ____ is consistent with an increase in supply.
A)Point B to Point D
B)Point D to Point B
C)Point D to Point C
D)Point C to Point D
E)None of the above are correct.
Unlock Deck
Unlock for access to all 252 flashcards in this deck.
Unlock Deck
k this deck
15
Figure 3-H
Refer to Figure 3-H.An increase in the quantity supplied, but not an increase in supply, occurs when the equilibrium moves from:
A)Point B to Point D.
B)Point D to Point B.
C)Point D to Point C.
D)Point C to Point D.
E)None of the above are correct.
Refer to Figure 3-H.An increase in the quantity supplied, but not an increase in supply, occurs when the equilibrium moves from:
A)Point B to Point D.
B)Point D to Point B.
C)Point D to Point C.
D)Point C to Point D.
E)None of the above are correct.
Unlock Deck
Unlock for access to all 252 flashcards in this deck.
Unlock Deck
k this deck
16
Table 3-D
Use the following information about demand and supply schedules to answer the question.
-Refer to Table 3-D.If D2 and S2 represent the demand and supply schedules in a particular market, the equilibrium price and quantity are ____ and ____, respectively.
A)$12; 12
B)$10; 12
C)$8; 15
D)$6; 18
E)None of the answers are correct.
Unlock Deck
Unlock for access to all 252 flashcards in this deck.
Unlock Deck
k this deck
17
Table 3-D
Use the following information about demand and supply schedules to answer the question.
-Refer to Table 3-D.If D1 and S2 represent the demand and supply schedules in a particular market, the equilibrium price and quantity are ____ and ____, respectively.
A)$12; 9
B)$10; 12
C)$10; 8
D)$8; 11
E)between $8 and $10; between 10 and 12
Unlock Deck
Unlock for access to all 252 flashcards in this deck.
Unlock Deck
k this deck
18
Table 3-D
Use the following information about demand and supply schedules to answer the question.
-Refer to Table 3-D.Suppose that D1 and S1 are the prevailing demand and supply curves for a product.If the demand schedule changes from D1 to D2, then:
A)equilibrium price decreases from $6 to $4.
B)equilibrium quantity decreases from 15 to 13.
C)equilibrium quantity increases from 13 to 18.
D)equilibrium price increases from $6 to $8.
E)equilibrium quantity remains at 13.
Unlock Deck
Unlock for access to all 252 flashcards in this deck.
Unlock Deck
k this deck
19
Figure 3-G
The diagram below represents the market for butter.
Refer to Figure 3-G.The equilibrium price of butter is:
A)$5.
B)$3.
C)$2.
D)$1.
E)50 cents.
The diagram below represents the market for butter.
Refer to Figure 3-G.The equilibrium price of butter is:
A)$5.
B)$3.
C)$2.
D)$1.
E)50 cents.
Unlock Deck
Unlock for access to all 252 flashcards in this deck.
Unlock Deck
k this deck
20
Table 3-D
Use the following information about demand and supply schedules to answer the question.
-Refer to Table 3-D.Suppose that D2 and S1 are the prevailing demand and supply curves for a product.If the demand schedule changes from D2 to D1, then:
A)equilibrium price decreases from $6 to $4.
B)equilibrium quantity decreases from 15 to 13.
C)equilibrium quantity increases from 13 to 18.
D)equilibrium price increases from $6 to $8.
E)equilibrium quantity decreases from 13 to 12.
Unlock Deck
Unlock for access to all 252 flashcards in this deck.
Unlock Deck
k this deck
21
The demand schedule for a good:
A)indicates the quantity that people will buy at the prevailing price.
B)indicates the quantities that suppliers will sell at various market prices.
C)indicates the quantities that will be purchased at alternative market prices.
D)is determined primarily by the cost of producing the good.
A)indicates the quantity that people will buy at the prevailing price.
B)indicates the quantities that suppliers will sell at various market prices.
C)indicates the quantities that will be purchased at alternative market prices.
D)is determined primarily by the cost of producing the good.
Unlock Deck
Unlock for access to all 252 flashcards in this deck.
Unlock Deck
k this deck
22
Figure 3-K
Refer to Figure 3-K.At a market price of $2, which of following conditions exist?
A)Shortage
B)Surplus
C)Equilibrium
D)Either a or b
Refer to Figure 3-K.At a market price of $2, which of following conditions exist?
A)Shortage
B)Surplus
C)Equilibrium
D)Either a or b
Unlock Deck
Unlock for access to all 252 flashcards in this deck.
Unlock Deck
k this deck
23
Figure 3-A
Refer to Figure 3-I.Starting with initial demand curves D0 and S0, a movement from ____ is consistent with an increase in both demand and supply.
A)Point A to Point I
B)Point A to Point C
C)Point A to Point F
D)Point A to Point E
E)Point A to Point D
Refer to Figure 3-I.Starting with initial demand curves D0 and S0, a movement from ____ is consistent with an increase in both demand and supply.
A)Point A to Point I
B)Point A to Point C
C)Point A to Point F
D)Point A to Point E
E)Point A to Point D
Unlock Deck
Unlock for access to all 252 flashcards in this deck.
Unlock Deck
k this deck
24
Which of the following is true of a competitive market?
A)The rules of supply and demand do not apply to it.
B)Buyers and sellers have little market power.
C)Each buyer's or seller's effect on market price is substantial.
D)Few sellers offer similar products.
A)The rules of supply and demand do not apply to it.
B)Buyers and sellers have little market power.
C)Each buyer's or seller's effect on market price is substantial.
D)Few sellers offer similar products.
Unlock Deck
Unlock for access to all 252 flashcards in this deck.
Unlock Deck
k this deck
25
Figure 3-J
Refer to Figure 3-J.The movement from ____ to ____ is consistent with a decrease in the price of cotton (a substitute).
A)Point A; Point B
B)Point A; Point F
C)Point A; Point D
D)Point A; Point H
E)Point A; Point C
Refer to Figure 3-J.The movement from ____ to ____ is consistent with a decrease in the price of cotton (a substitute).
A)Point A; Point B
B)Point A; Point F
C)Point A; Point D
D)Point A; Point H
E)Point A; Point C
Unlock Deck
Unlock for access to all 252 flashcards in this deck.
Unlock Deck
k this deck
26
Figure 3-J
Refer to Figure 3-J.The movement from ____ to ____ is consistent with technological improvements in wool mills.
A)Point A; Point B
B)Point A; Point F
C)Point A; Point D
D)Point A; Point H
E)Point A; Point I
Refer to Figure 3-J.The movement from ____ to ____ is consistent with technological improvements in wool mills.
A)Point A; Point B
B)Point A; Point F
C)Point A; Point D
D)Point A; Point H
E)Point A; Point I
Unlock Deck
Unlock for access to all 252 flashcards in this deck.
Unlock Deck
k this deck
27
Table 3-D
Use the following information about demand and supply schedules to answer the question.
-Refer to Table 3-D.Suppose the supply schedule for Good A changes from S1 to S2 because the price of Good B increases.We can say that:
A)Goods A and B are likely substitutes in production.
B)Goods A and B are likely complements in consumption.
C)Goods A and B are likely substitutes in consumption.
D)Good B is not related to Good A.
Unlock Deck
Unlock for access to all 252 flashcards in this deck.
Unlock Deck
k this deck
28
The law of demand asserts that:
A)output prices are more important than input prices.
B)when people want a good badly enough they will find a way to pay for it.
C)people want to buy more of goods that are priced very high because of their prestige.
D)the quantity of a good that people will buy is inversely related to the product's price.
Unlock Deck
Unlock for access to all 252 flashcards in this deck.
Unlock Deck
k this deck
29
Table 3-D
Use the following information about demand and supply schedules to answer the question.
-Refer to Table 3-D.Suppose that D2 and S1 are the prevailing demand and supply curves for a product.If the supply schedule changes from S1 to S2, then:
A)equilibrium price decreases from $10 to $8.
B)equilibrium quantity decreases from 15 to 12.
C)equilibrium quantity increases from 10 to 12.
D)equilibrium price increases from $10 to $12.
E)equilibrium quantity remains at 15.
Unlock Deck
Unlock for access to all 252 flashcards in this deck.
Unlock Deck
k this deck
30
Figure 3-J
Refer to Figure 3-J.The movement from ____ to ____ is consistent with a successful advertising campaign that claims wool keeps you warm.
A)Point A; Point B
B)Point A; Point F
C)Point A; Point D
D)Point A; Point H
E)Point A; Point I
Refer to Figure 3-J.The movement from ____ to ____ is consistent with a successful advertising campaign that claims wool keeps you warm.
A)Point A; Point B
B)Point A; Point F
C)Point A; Point D
D)Point A; Point H
E)Point A; Point I
Unlock Deck
Unlock for access to all 252 flashcards in this deck.
Unlock Deck
k this deck
31
Figure 3-J
Refer to Figure 3-J.The movement from ____ to ____ is consistent with a strike by the Basque Shepherds Guild.
A)Point A; Point I
B)Point A; Point F
C)Point A; Point D
D)Point A; Point H
E)Point A; Point C
Refer to Figure 3-J.The movement from ____ to ____ is consistent with a strike by the Basque Shepherds Guild.
A)Point A; Point I
B)Point A; Point F
C)Point A; Point D
D)Point A; Point H
E)Point A; Point C
Unlock Deck
Unlock for access to all 252 flashcards in this deck.
Unlock Deck
k this deck
32
Figure 3-K
Refer to Figure 3-K.At a market price of $4, which of following conditions exist?
A)Shortage
B)Surplus
C)Equilibrium
D)Any of the above
Refer to Figure 3-K.At a market price of $4, which of following conditions exist?
A)Shortage
B)Surplus
C)Equilibrium
D)Any of the above
Unlock Deck
Unlock for access to all 252 flashcards in this deck.
Unlock Deck
k this deck
33
Figure 3-K
Refer to Figure 3-K.The equilibrium price is:
A)$3
B)$1
C)$4
D)Indeterminate
Refer to Figure 3-K.The equilibrium price is:
A)$3
B)$1
C)$4
D)Indeterminate
Unlock Deck
Unlock for access to all 252 flashcards in this deck.
Unlock Deck
k this deck
34
Table 3-E
-Refer to Table 3-E.According to the data in the above table, the equilibrium price of gasoline is:
A)$3.00
B)$3.25
C)$3.50
D)$3.75
E)$4.00
-Refer to Table 3-E.According to the data in the above table, the equilibrium price of gasoline is:
A)$3.00
B)$3.25
C)$3.50
D)$3.75
E)$4.00
Unlock Deck
Unlock for access to all 252 flashcards in this deck.
Unlock Deck
k this deck
35
The law of demand illustrates a(n) ____ relationship between price and ____.
A)direct; quantity demanded
B)inverse; quantity demanded
C)inverse; demand
D)direct; demand
A)direct; quantity demanded
B)inverse; quantity demanded
C)inverse; demand
D)direct; demand
Unlock Deck
Unlock for access to all 252 flashcards in this deck.
Unlock Deck
k this deck
36
The law of demand refers to the:
A)decrease in price that results as more units of a product are demanded.
B)increase in price that results from an increase in demand for a good of limited supply.
C)inverse relationship between the price of a good and the quantity demanded.
D)increase in the quantity of a good made available when its price increases.
Unlock Deck
Unlock for access to all 252 flashcards in this deck.
Unlock Deck
k this deck
37
In economics, the demand for a good refers to the amount of the good people:
A)would like to have if the good were free.
B)will buy at various prices.
C)need to achieve a minimum standard of living.
D)will buy at alternative income levels.
A)would like to have if the good were free.
B)will buy at various prices.
C)need to achieve a minimum standard of living.
D)will buy at alternative income levels.
Unlock Deck
Unlock for access to all 252 flashcards in this deck.
Unlock Deck
k this deck
38
The law of demand refers to the:
A)negative relationship between the price of a good and the willingness of producers to sell it.
B)price increase that results from an increase in demand.
C)inverse relationship between the price of a good and the quantity demanded.
D)increase in the quantity of a good made available when its price increases.
Unlock Deck
Unlock for access to all 252 flashcards in this deck.
Unlock Deck
k this deck
39
Figure 3-A
Refer to Figure 3-I.Starting with initial demand curves D0 and S0, a movement from ____ is consistent with a decrease in both demand and supply.
A)Point A to Point I
B)Point A to Point C
C)Point A to Point F
D)Point A to Point E
E)Point A to Point G
Refer to Figure 3-I.Starting with initial demand curves D0 and S0, a movement from ____ is consistent with a decrease in both demand and supply.
A)Point A to Point I
B)Point A to Point C
C)Point A to Point F
D)Point A to Point E
E)Point A to Point G
Unlock Deck
Unlock for access to all 252 flashcards in this deck.
Unlock Deck
k this deck
40
Table 3-E
-Refer to Table 3-E.Assuming the market for gasoline is initially in equilibrium, what is likely to happen when there is a significant decrease in the price of sport utility vehicles? (Assume that sport utility vehicles get very low gas mileage.)
A)The market price and quantity of gasoline will both decrease.
B)The market price for gasoline will increase and the quantity demanded will decrease.
C)The market price of gasoline will decrease and the quantity demanded will increase.
D)Both the market price and quantity of gasoline demanded will increase.
E)There will be no change in the price of gasoline.
Unlock Deck
Unlock for access to all 252 flashcards in this deck.
Unlock Deck
k this deck
41
Which of the following is true about demand and quantity demanded?
A)A change in quantity demanded is caused by a change in current price while a change in demand is caused by a change in some other factor.
B)A change in demand is caused by a change in current price while a change in quantity demanded is caused by a change in some other factor.
C)Both a change in quantity demanded and a change in demand are caused by a change in a factor other than the current price.
D)Both a change in quantity demanded and a change in demand are caused by a change in the current price.
E)None of the above.
Unlock Deck
Unlock for access to all 252 flashcards in this deck.
Unlock Deck
k this deck
42
When a demand schedule is drawn in a graph:
A)price is measured on the vertical axis.
B)quantity is measured on the horizontal axis.
C)the resulting curve has a negative slope.
D)other variables are held constant.
E)all of the above are correct.
A)price is measured on the vertical axis.
B)quantity is measured on the horizontal axis.
C)the resulting curve has a negative slope.
D)other variables are held constant.
E)all of the above are correct.
Unlock Deck
Unlock for access to all 252 flashcards in this deck.
Unlock Deck
k this deck
43
If the price of music downloads decreases, which of the following is most likely to occur?
A)Quantity demanded will decrease.
B)Quantity demanded will increase.
C)Demand will increase.
D)Demand will decrease.
A)Quantity demanded will decrease.
B)Quantity demanded will increase.
C)Demand will increase.
D)Demand will decrease.
Unlock Deck
Unlock for access to all 252 flashcards in this deck.
Unlock Deck
k this deck
44
Which of the following would not cause an increase in demand for tennis balls?
A)a reduction in the price of tennis racquets
B)a decrease in the price of tennis balls
C)an unusually sunny fall and winter
D)an increase in the popularity of tennis
A)a reduction in the price of tennis racquets
B)a decrease in the price of tennis balls
C)an unusually sunny fall and winter
D)an increase in the popularity of tennis
Unlock Deck
Unlock for access to all 252 flashcards in this deck.
Unlock Deck
k this deck
45
Vodka and whiskey are considered by consumers to be substitutes.The likely economic impact of a decrease in the price of whiskey is a:
A)movement up along the demand curve for vodka.
B)movement down along the demand curve for vodka.
C)decrease in the supply of whiskey.
D)rightward shift of the demand curve for vodka.
E)leftward shift of the demand curve for vodka.
A)movement up along the demand curve for vodka.
B)movement down along the demand curve for vodka.
C)decrease in the supply of whiskey.
D)rightward shift of the demand curve for vodka.
E)leftward shift of the demand curve for vodka.
Unlock Deck
Unlock for access to all 252 flashcards in this deck.
Unlock Deck
k this deck
46
The difference between a change in quantity demanded and a change in demand is that a change in:
A)quantity demanded is caused by a change in a good's own current price, while a change in demand is caused by a change in some other variable, such as income, tastes, or expectations.
B)demand is caused by a change in a good's own current price, while a change in quantity demanded is caused by a change in some other variable, such as income, tastes, or expectations.
C)quantity demanded is a change in the amount people actually buy, while a change in demand is a change in the amount they want to buy.
D)A change in demand and a change in quantity demanded are the same thing.
Unlock Deck
Unlock for access to all 252 flashcards in this deck.
Unlock Deck
k this deck
47
Roxanne views movie tickets and DVD rentals to be substitute forms of entertainment.An increase in the price of a DVD rental will probably result in an increase in the:
A)supply of movie tickets.
B)quantity of movie tickets demanded.
C)quantity of DVD rentals demanded.
D)demand for movie tickets.
A)supply of movie tickets.
B)quantity of movie tickets demanded.
C)quantity of DVD rentals demanded.
D)demand for movie tickets.
Unlock Deck
Unlock for access to all 252 flashcards in this deck.
Unlock Deck
k this deck
48
A downward-sloping demand curve shows:
A)the direct relationship between price and quantity supplied; as price increases, the quantity supplied increases.
B)the inverse relationship between price and quantity supplied; as price increases, the quantity supplied decreases.
C)the direct relationship between price and quantity demanded; as price increases, the quantity demanded increases.
D)the inverse relationship between price and quantity demanded; as price increases, the quantity demanded decreases.
E)how supply varies with demand.
Unlock Deck
Unlock for access to all 252 flashcards in this deck.
Unlock Deck
k this deck
49
If consumers are less willing and able to pay for each level of output than they were previously, then apparently:
A)demand has increased.
B)supply has increased.
C)demand has decreased.
D)there has been a movement down along the demand curve.
E)there has been a movement up along the demand curve.
A)demand has increased.
B)supply has increased.
C)demand has decreased.
D)there has been a movement down along the demand curve.
E)there has been a movement up along the demand curve.
Unlock Deck
Unlock for access to all 252 flashcards in this deck.
Unlock Deck
k this deck
50
If the price of ice cream increases and the quantity demanded decreases, economists would describe this as:
A)a change in demand.
B)a change in quantity demanded.
C)a change in consumer income.
D)a change in one of the variables that shift demand.
E)an inferior good.
A)a change in demand.
B)a change in quantity demanded.
C)a change in consumer income.
D)a change in one of the variables that shift demand.
E)an inferior good.
Unlock Deck
Unlock for access to all 252 flashcards in this deck.
Unlock Deck
k this deck
51
The quantity of hamburger that households are willing to purchase is predicted to rise if there is:
A)a fall in the price of hot dogs
B)a fall in the price of hamburger buns
C)a rise in the price of onion rings
D)a rise in the price of catsup
A)a fall in the price of hot dogs
B)a fall in the price of hamburger buns
C)a rise in the price of onion rings
D)a rise in the price of catsup
Unlock Deck
Unlock for access to all 252 flashcards in this deck.
Unlock Deck
k this deck
52
The price of automobiles has increased sharply lately.As a result, automobile dealers have noticed that:
A)demand has increased.
B)demand has decreased.
C)quantity demanded has increased.
D)quantity demanded has decreased.
A)demand has increased.
B)demand has decreased.
C)quantity demanded has increased.
D)quantity demanded has decreased.
Unlock Deck
Unlock for access to all 252 flashcards in this deck.
Unlock Deck
k this deck
53
Skateboards International of Long Beach, California, was able to sell 20,000 skateboards at a price of $60 in 2008.In 2009, it is able to sell only 12,000 of the same skateboards at a price of $60.Evidently, Skateboard International has experienced a(n):
A)increase in quantity supplied.
B)increase in demand.
C)increase in supply.
D)decrease in demand.
E)increase in quantity demanded.
A)increase in quantity supplied.
B)increase in demand.
C)increase in supply.
D)decrease in demand.
E)increase in quantity demanded.
Unlock Deck
Unlock for access to all 252 flashcards in this deck.
Unlock Deck
k this deck
54
Based on widespread reaction to the threat of the H1N1 virus, the likely effect on the demand curve for hand sanitizers would be
A)a shift of the demand curve to the right.
B)a movement downward along the demand curve to the right.
C)a shift of the demand curve to the left.
D)a movement upward along the demand curve to the left.
A)a shift of the demand curve to the right.
B)a movement downward along the demand curve to the right.
C)a shift of the demand curve to the left.
D)a movement upward along the demand curve to the left.
Unlock Deck
Unlock for access to all 252 flashcards in this deck.
Unlock Deck
k this deck
55
CNN announces that bad weather in Central America has greatly reduced the number of cocoa bean plants, and, as a result, it is expected that the price of chocolate will rise in the near future.As a result:
A)the current market demand for chocolate will decrease.
B)the current market demand for chocolate will increase.
C)the current quantity demanded for chocolate will decrease.
D)there is no change in the current market for chocolate, but there will be after the current crop of cocoa bean plants is processed into chocolate.
Unlock Deck
Unlock for access to all 252 flashcards in this deck.
Unlock Deck
k this deck
56
Buyers who were originally willing to buy 800 units of a good at $4 per unit are now willing to buy 1200 units at $4 per unit.That change would be described as:
A)an increase in demand.
B)a decrease in demand.
C)an increase in quantity demanded.
D)a decrease in quantity demanded.
A)an increase in demand.
B)a decrease in demand.
C)an increase in quantity demanded.
D)a decrease in quantity demanded.
Unlock Deck
Unlock for access to all 252 flashcards in this deck.
Unlock Deck
k this deck
57
Which of the following is true?
A)The market demand curve for a product is the vertical summation of the demand curves of the individuals in the market.
B)A fall in a good's price leads to a decrease in quantity demanded, illustrated by moving along a demand curve.
C)According to the law of demand, other things equal, when the price of a good or service falls, demand increases.
D)A change in demand for chocolate bars is caused by a change in the price of chocolate bars.
E)None of the above is true.
Unlock Deck
Unlock for access to all 252 flashcards in this deck.
Unlock Deck
k this deck
58
Which of the following is not held constant when moving along a product's demand curve?
A)The price of the product itself.
B)The expected price of the product in the near future.
C)Income.
D)Prices of complementary goods.
E)Prices of substitutes.
A)The price of the product itself.
B)The expected price of the product in the near future.
C)Income.
D)Prices of complementary goods.
E)Prices of substitutes.
Unlock Deck
Unlock for access to all 252 flashcards in this deck.
Unlock Deck
k this deck
59
Which of the following groups are likely to determine the demand side of the market?
A)Firms that buy inputs
B)Firms that produce and sell goods
C)Resource owners who sell their inputs
D)Workers in a firm
A)Firms that buy inputs
B)Firms that produce and sell goods
C)Resource owners who sell their inputs
D)Workers in a firm
Unlock Deck
Unlock for access to all 252 flashcards in this deck.
Unlock Deck
k this deck
60
Assume the demand schedule for cookies is downward sloping.If the price of cookies falls from $2.50 to $2.25 per dozen:
A)the demand for cookies will fall.
B)the demand for cookies will rise.
C)a larger quantity of cookies will be demanded.
D)a smaller quantity of cookies will be demanded.
A)the demand for cookies will fall.
B)the demand for cookies will rise.
C)a larger quantity of cookies will be demanded.
D)a smaller quantity of cookies will be demanded.
Unlock Deck
Unlock for access to all 252 flashcards in this deck.
Unlock Deck
k this deck
61
Andy views beer and pizza as complements to one another.If the price of pizza decreases, economists would expect:
A)Andy's demand for pizza to increase.
B)Andy's demand for pizza to decrease.
C)Andy's quantity of pizza demanded to decrease.
D)Andy's demand for beer to increase.
E)Andy's demand for beer to decrease.
A)Andy's demand for pizza to increase.
B)Andy's demand for pizza to decrease.
C)Andy's quantity of pizza demanded to decrease.
D)Andy's demand for beer to increase.
E)Andy's demand for beer to decrease.
Unlock Deck
Unlock for access to all 252 flashcards in this deck.
Unlock Deck
k this deck
62
A demand curve shows the relationship between price and quantity demanded, "other things remaining constant." The other things that remain constant include all of the following except the:
A)price of the product.
B)price of complementary products.
C)price of substitute products.
D)number of consumers in the demographic group purchasing the product.
E)preferences of consumers.
A)price of the product.
B)price of complementary products.
C)price of substitute products.
D)number of consumers in the demographic group purchasing the product.
E)preferences of consumers.
Unlock Deck
Unlock for access to all 252 flashcards in this deck.
Unlock Deck
k this deck
63
Which of the following explains why the quantity of a good demanded decreases when its price increases?
A)Consumer preferences change when the price of a good changes.
B)The nominal income of consumers falls when the price of a good increases.
C)Substitutes become relatively cheaper when the price of a good increases.
D)Complements become relatively cheaper when the price of a good increases.
E)None of the above provides a reasonable explanation.
Unlock Deck
Unlock for access to all 252 flashcards in this deck.
Unlock Deck
k this deck
64
Which of the following would be most likely to cause an outward shift of the demand curve for electricity?
A)a decrease in the price of electricity
B)an increase in the price of air conditioners
C)an increase in the price of heating oil
D)a decrease in the price of natural gas
A)a decrease in the price of electricity
B)an increase in the price of air conditioners
C)an increase in the price of heating oil
D)a decrease in the price of natural gas
Unlock Deck
Unlock for access to all 252 flashcards in this deck.
Unlock Deck
k this deck
65
If an increase in the price of Good X causes a decrease in the demand for Good Y, we can conclude that:
A)Goods X and Y are complements.
B)Goods X and Y are substitutes.
C)Goods X and Y are normal goods.
D)the price of Good Y will increase.
E)the quantity supplied of Good Y will increase.
A)Goods X and Y are complements.
B)Goods X and Y are substitutes.
C)Goods X and Y are normal goods.
D)the price of Good Y will increase.
E)the quantity supplied of Good Y will increase.
Unlock Deck
Unlock for access to all 252 flashcards in this deck.
Unlock Deck
k this deck
66
The price of peanut butter falls and as a result the demand for jelly increases.We can conclude that:
A)peanut butter and jelly are substitutes.
B)peanut butter and jelly are complements.
C)peanut butter and jelly are inferior goods.
D)the marginal value of jelly is greater than the marginal value of peanut butter.
E)peanut butter and jelly are normal goods.
A)peanut butter and jelly are substitutes.
B)peanut butter and jelly are complements.
C)peanut butter and jelly are inferior goods.
D)the marginal value of jelly is greater than the marginal value of peanut butter.
E)peanut butter and jelly are normal goods.
Unlock Deck
Unlock for access to all 252 flashcards in this deck.
Unlock Deck
k this deck
67
When the price of automobile insurance increases sharply, the likely impact on the market for automobiles is:
A)an increase in demand.
B)an increase in quantity demanded.
C)a decrease in demand.
D)a decrease in quantity demanded.
E)no change in automobile sales.
A)an increase in demand.
B)an increase in quantity demanded.
C)a decrease in demand.
D)a decrease in quantity demanded.
E)no change in automobile sales.
Unlock Deck
Unlock for access to all 252 flashcards in this deck.
Unlock Deck
k this deck
68
Which of the following is true?
A)A decrease in the price of ice cream would cause a decrease in the demand for frozen yogurt, a substitute.
B)Just as demanders will demand more now if the price of a good is expected to rise in the near future, sellers will supply more now if the price of a good is expected to rise in the near future.
C)An increase in supply leads to a movement up along the supply curve.
D)Both technological progress and cost-increasing regulations will increase supply.
E)None of the above is true.
Unlock Deck
Unlock for access to all 252 flashcards in this deck.
Unlock Deck
k this deck
69
The demand curve for a typical good has a(n):
A)negative slope because some consumers switch to other goods as the price rises.
B)negative slope because consumer incomes fall as the price of the good rises.
C)negative slope because the good has less "snob appeal" as its price falls.
D)inverse slope because as the price goes up, the good has more profitability.
E)positive slope because price is a clear indicator of need.
Unlock Deck
Unlock for access to all 252 flashcards in this deck.
Unlock Deck
k this deck
70
Assuming that Chinese food and Thai food are substitutes, if P.F.Chang's Chinese Restaurant reduces its prices:
A)the sales of the nearby Bahn Thai restaurant will increase.
B)demand for meals at P. F. Chang's will increase.
C)the demand for meals at the Bahn Thai restaurant will decrease.
D)the quantity of food demanded from P. F. Chang's will decrease.
A)the sales of the nearby Bahn Thai restaurant will increase.
B)demand for meals at P. F. Chang's will increase.
C)the demand for meals at the Bahn Thai restaurant will decrease.
D)the quantity of food demanded from P. F. Chang's will decrease.
Unlock Deck
Unlock for access to all 252 flashcards in this deck.
Unlock Deck
k this deck
71
If bad weather destroyed half of the current coffee crop, ceteris paribus, it would:
A)increase the demand for coffee.
B)decrease the demand for coffee.
C)increase the demand for tea.
D)decrease the demand for tea.
E)increase the supply of tea.
A)increase the demand for coffee.
B)decrease the demand for coffee.
C)increase the demand for tea.
D)decrease the demand for tea.
E)increase the supply of tea.
Unlock Deck
Unlock for access to all 252 flashcards in this deck.
Unlock Deck
k this deck
72
All of the following are likely to shift the demand for grapefruit to the left except:
A)a decrease in the price of oranges
B)a decrease in average household incomes
C)a rise in the price of grapefruit
D)the introduction and promotion of a processed breakfast drink.
A)a decrease in the price of oranges
B)a decrease in average household incomes
C)a rise in the price of grapefruit
D)the introduction and promotion of a processed breakfast drink.
Unlock Deck
Unlock for access to all 252 flashcards in this deck.
Unlock Deck
k this deck
73
The quantity of a good demanded tends to increase as its price falls because:
A)a decrease in price shifts the demand curve to the right.
B)a decrease in price shifts the demand curve to the left.
C)a decrease in price shifts the supply curve to the right.
D)at lower prices, suppliers are willing to supply a greater quantity to the market.
E)a decrease in price leads consumers to substitute toward this now relatively cheaper product.
Unlock Deck
Unlock for access to all 252 flashcards in this deck.
Unlock Deck
k this deck
74
Which of the following is true?
A)Because personal tastes differ, what are substitutes for one person may not be substitutes for another person.
B)Two goods are substitutes if an increase in the price of one good causes an increase in the demand for the other good.
C)Those goods for which rising income leads to decreased demand are called inferior goods.
D)Either an increase in the number of buyers or an increase in tastes or preferences for a good or service will increase the market demand for a good or service.
E)All of the above are true.
Unlock Deck
Unlock for access to all 252 flashcards in this deck.
Unlock Deck
k this deck
75
Which of the following would not cause a change in the demand for cheese?
A)an increase in the price of crackers, which are consumed with cheese
B)an increase in the income of cheese consumers
C)an increase in the population of cheese lovers
D)an increase in the price of cheese
E)a decrease in the price of crackers, which are consumed with cheese
A)an increase in the price of crackers, which are consumed with cheese
B)an increase in the income of cheese consumers
C)an increase in the population of cheese lovers
D)an increase in the price of cheese
E)a decrease in the price of crackers, which are consumed with cheese
Unlock Deck
Unlock for access to all 252 flashcards in this deck.
Unlock Deck
k this deck
76
Which of the following will not increase the demand for iced tea?
A)an increase in advertising that makes drinking iced tea more appealing
B)an increase in the price of iced coffee, a substitute product
C)an increase in the income of consumers (assume that iced tea is a normal good)
D)a decrease in the price of iced tea
E)a decrease in the price of lemons, a complement to iced tea
Unlock Deck
Unlock for access to all 252 flashcards in this deck.
Unlock Deck
k this deck
77
Whenever the price of Good A increases, the demand for Good B increases as well.Good A and B appear to be:
A)complements.
B)substitutes.
C)inferior goods.
D)normal goods.
E)inverse goods.
A)complements.
B)substitutes.
C)inferior goods.
D)normal goods.
E)inverse goods.
Unlock Deck
Unlock for access to all 252 flashcards in this deck.
Unlock Deck
k this deck
78
If an increase in the price of Product X causes an increase in the demand for Product Y, we can conclude that:
A)Products X and Y are complements.
B)Products X and Y are substitutes.
C)Products X and Y are normal goods.
D)The price of Product Y will decrease.
E)Products X and Y are inferior goods.
A)Products X and Y are complements.
B)Products X and Y are substitutes.
C)Products X and Y are normal goods.
D)The price of Product Y will decrease.
E)Products X and Y are inferior goods.
Unlock Deck
Unlock for access to all 252 flashcards in this deck.
Unlock Deck
k this deck
79
Whenever the price of Good A decreases, the demand for Good B increases.Good A and B appear to be:
A)complements.
B)substitutes.
C)inferior goods.
D)normal goods.
E)inverse goods.
A)complements.
B)substitutes.
C)inferior goods.
D)normal goods.
E)inverse goods.
Unlock Deck
Unlock for access to all 252 flashcards in this deck.
Unlock Deck
k this deck
80
Assuming that coffee and tea are substitutes, a decrease in the price of coffee will result in
A)A leftward shift in the demand for tea.
B)A downward movement along the demand curve for tea.
C)A rightward shift in the demand for tea.
D)An upward movement along the demand curve for tea.
A)A leftward shift in the demand for tea.
B)A downward movement along the demand curve for tea.
C)A rightward shift in the demand for tea.
D)An upward movement along the demand curve for tea.
Unlock Deck
Unlock for access to all 252 flashcards in this deck.
Unlock Deck
k this deck
Unlock Deck
Unlock for access to all 252 flashcards in this deck.


