Deck 23: Financial Statement Analysis
Full screen (f)
Question
Question
Question
Question
Question
Question
Question
Question
Question
Question
Question
Question
Question
Question
Question
Question
Question
Question
Question
Question
Question
Question
Question
Question
Question
Question
Question
Question
Question
Question
Question
Question
Question
Question
Question
Question
Question
Question
Question
Question
Question
Question
Question
Question
Question
Question
Question
Question
Question
Question
Question
Question
Question
Question
Question
Question
Question
Question
Question
Question
Question
Using the information shown, prepare a horizontal analysis. Carry all calculations to two decimal places and then round to one decimal place.
Question
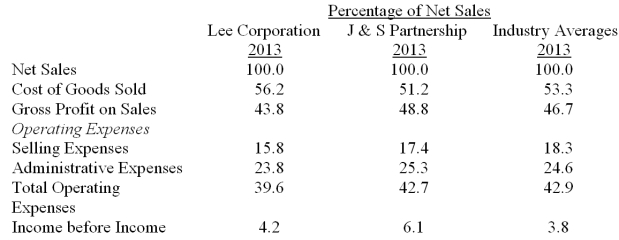
Using the information given, discuss Lee Corporation's outcomes compared to J & S Partnership.
Question
Question
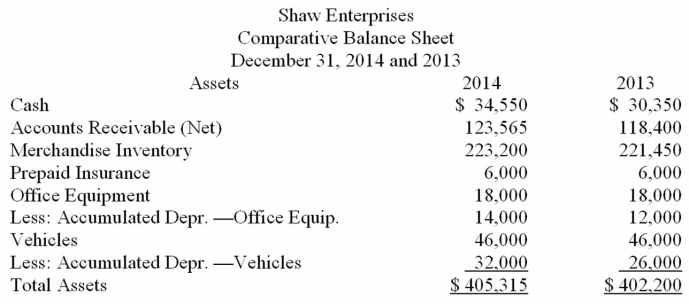
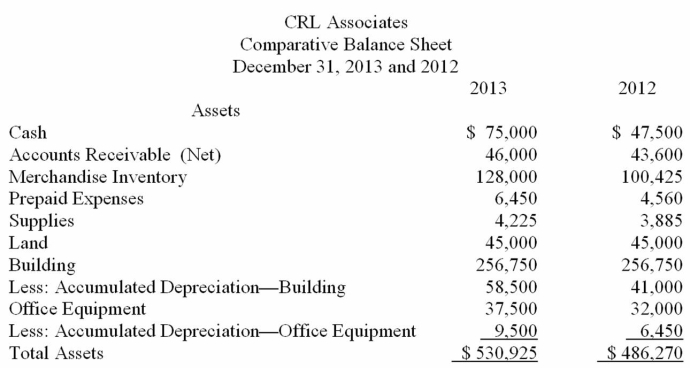
Using the comparative balance sheet assets given below, prepare a horizontal analysis of all asset items. Carry all calculations to two decimal places and then round to one decimal place.
Question
Using the information shown, prepare a vertical analysis. Carry all calculations to two decimal places and then round to one decimal place.
Question
Using the information given, discuss Lee Corporation's standing when compared to the industry averages.
Question
Question
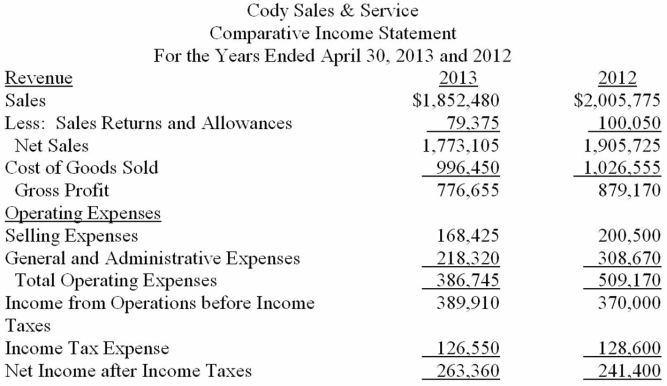
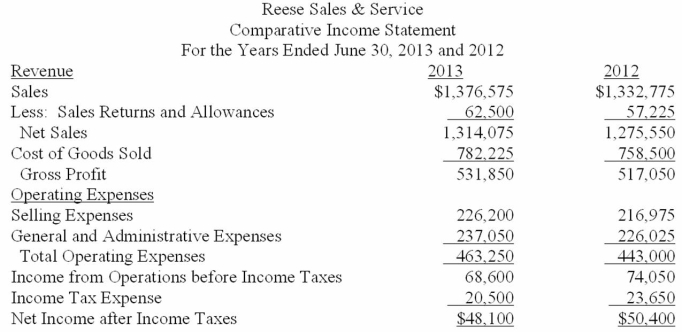
Using the comparative income statement given below, prepare a horizontal analysis of all items. Carry all calculations to two decimal places and then round to one decimal place. 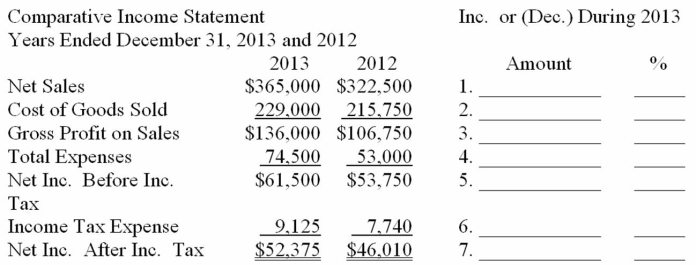
Question
Using the comparative balance sheet assets given below, prepare a horizontal analysis of all asset items. Carry all calculations to two decimal places and then round to one decimal place.
Question
Using the information shown, prepare a vertical analysis of all asset items. Carry all calculations to two decimal places and then round to one decimal place. (Leave all percentages unadjusted.)
Question
Using the information given, discuss J & S Partnership's outcomes compared to the industry averages.
Question
Using the comparative balance sheet given below, prepare a vertical analysis of all asset items. Carry all calculations to two decimal places and then round to one decimal place. (Leave all vertical analysis percentages unadjusted.) 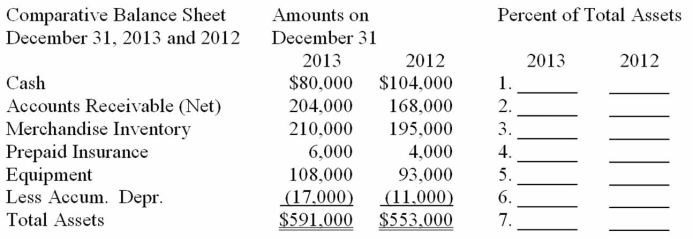
Question
Using the information shown, prepare a vertical analysis of all asset items. Carry all calculations to two decimal places and then round to one decimal place. (Leave all percentages unadjusted.)
Question
Using the information shown, prepare a vertical analysis. Carry all calculations to two decimal places and then round to one decimal place. (Leave all percentages unadjusted.)
Question
Using the information shown, prepare a horizontal analysis. Carry all calculations to two decimal places and then round to one decimal place.
Question
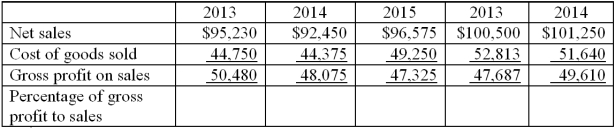
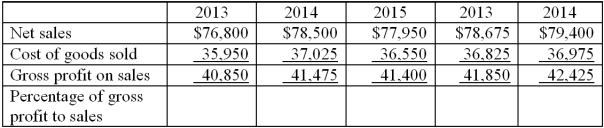
Using the information given below, calculate the gross profit percentage based on net sales. What conclusions can be made about this company based on this trend analysis?
Question
Question
Using the information given below, calculate the gross profit percentage based on net sales. What conclusions can be made about this company based on this trend analysis?
Question
Using the comparative income statement given below, prepare a vertical analysis of all items. Carry all calculations to two decimal places and then round to one decimal place. (Leave all vertical analysis percentages unadjusted in this problem.) 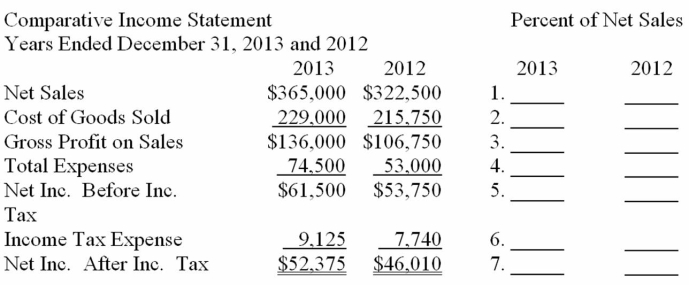
Question
Using the comparative balance sheet given below, prepare a horizontal analysis of all asset items. Carry all calculations to two decimal places and then round to one decimal place. 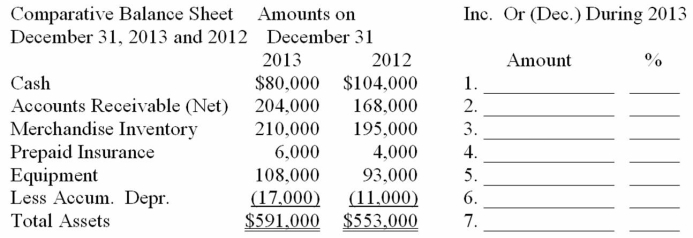

Unlock Deck
Sign up to unlock the cards in this deck!
Unlock Deck
Unlock Deck
1/100
Play
Full screen (f)
Deck 23: Financial Statement Analysis
1
Most trade associations provide common-size statements based on data gathered from member companies.
True
2
A decrease in cost of goods sold from 46.5% to 45.0% from 2012 to 2013 indicates a favorable long-term trend.
False
3
On a comparative balance sheet that shows horizontal analysis, the percentage of change in total assets must equal the percentage of change in total liabilities and stockholders' equity.
True
4
The price-earnings ratio compares the present market value of a corporation's common stock with the earnings per share of that stock.
Unlock Deck
Unlock for access to all 100 flashcards in this deck.
Unlock Deck
k this deck
5
The rate of return on total assets measures how effectively management has used the assets of the company.
Unlock Deck
Unlock for access to all 100 flashcards in this deck.
Unlock Deck
k this deck
6
Comparison of amounts and percentages for only two years is adequate to indicate long-term trends.
Unlock Deck
Unlock for access to all 100 flashcards in this deck.
Unlock Deck
k this deck
7
A company reported net income of $80,000 for 2012, and net income of $100,000 for 2013. Net income increased by ____________________ percent.
Unlock Deck
Unlock for access to all 100 flashcards in this deck.
Unlock Deck
k this deck
8
Quick assets include cash, receivables, and inventories.
Unlock Deck
Unlock for access to all 100 flashcards in this deck.
Unlock Deck
k this deck
9
The current ratio is a measure of profitability.
Unlock Deck
Unlock for access to all 100 flashcards in this deck.
Unlock Deck
k this deck
10
When horizontal analysis is performed, no percentage change is computed for a given item if there is no balance for that item in the base year.
Unlock Deck
Unlock for access to all 100 flashcards in this deck.
Unlock Deck
k this deck
11
In vertical analysis, it is customary to express each item on the balance sheet as a percentage of total liabilities.
Unlock Deck
Unlock for access to all 100 flashcards in this deck.
Unlock Deck
k this deck
12
Since each firm is a unique entity, comparison of data for the firm with industry averages is of no use in financial analysis.
Unlock Deck
Unlock for access to all 100 flashcards in this deck.
Unlock Deck
k this deck
13
A company reported an expense of $30,000 for the current year that was $6,000 higher than the previous year. The increase from last year to this year was ____________________ percent.
Unlock Deck
Unlock for access to all 100 flashcards in this deck.
Unlock Deck
k this deck
14
A comparison of data for the current period with the same data of the company for previous periods is called ____________________ analysis.
Unlock Deck
Unlock for access to all 100 flashcards in this deck.
Unlock Deck
k this deck
15
The fair market value of a share of common stock is determined by dividing the stockholders' equity by the number of shares of common stock outstanding.
Unlock Deck
Unlock for access to all 100 flashcards in this deck.
Unlock Deck
k this deck
16
The ability of a company to pay its debts when due is known as liquidity.
Unlock Deck
Unlock for access to all 100 flashcards in this deck.
Unlock Deck
k this deck
17
In horizontal analysis, the earlier period is called the ____________________ period.
Unlock Deck
Unlock for access to all 100 flashcards in this deck.
Unlock Deck
k this deck
18
A high ratio of stockholders' equity to total liabilities indicates a greater risk for creditors.
Unlock Deck
Unlock for access to all 100 flashcards in this deck.
Unlock Deck
k this deck
19
A firm had current liabilities of $60,000 on December 31, 2012, and $51,000 on December 31, 2013. Current liabilities decreased by ____________________ percent.
Unlock Deck
Unlock for access to all 100 flashcards in this deck.
Unlock Deck
k this deck
20
In horizontal analysis, the base year is the most recent year.
Unlock Deck
Unlock for access to all 100 flashcards in this deck.
Unlock Deck
k this deck
21
A company reported net income of $120,000. It paid a cash dividend of $20,000 to preferred stockholders and a cash dividend to common shareholders of $40,000. If the company has 20,000 shares of common stock outstanding, earnings per share would be ______________.
Unlock Deck
Unlock for access to all 100 flashcards in this deck.
Unlock Deck
k this deck
22
Financial statements presented side-by-side for two or more periods are called ____________________ statements.
Unlock Deck
Unlock for access to all 100 flashcards in this deck.
Unlock Deck
k this deck
23
If the gross profit on sales is 20 percent of net sales, then cost of goods sold must be ____________________ percent of net sales.
Unlock Deck
Unlock for access to all 100 flashcards in this deck.
Unlock Deck
k this deck
24
A company reported net income of $80,000. It paid a cash dividend of $20,000 to preferred stockholders. If the company has 20,000 shares of common stock outstanding, earnings per share would be ______________.
Unlock Deck
Unlock for access to all 100 flashcards in this deck.
Unlock Deck
k this deck
25
The ____________________ is calculated by dividing current assets by current liabilities.
Unlock Deck
Unlock for access to all 100 flashcards in this deck.
Unlock Deck
k this deck
26
A vertical analysis of the income statement usually involves a comparison of each income statement item with ____________________ as reported on that income statement.
Unlock Deck
Unlock for access to all 100 flashcards in this deck.
Unlock Deck
k this deck
27
The rate of ____________________ on total assets measures the earnings on the assets used by a company.
Unlock Deck
Unlock for access to all 100 flashcards in this deck.
Unlock Deck
k this deck
28
The yield on common stock is computed by dividing the dividend per share of common stock by the current ____________________ price of the share.
Unlock Deck
Unlock for access to all 100 flashcards in this deck.
Unlock Deck
k this deck
29
A firm reported total liabilities of $60,000 and total stockholders' equity of $140,000. The amount of total liabilities is ____________________ percent of total assets.
Unlock Deck
Unlock for access to all 100 flashcards in this deck.
Unlock Deck
k this deck
30
Cost of goods sold divided by average inventory equals ___________________.
Unlock Deck
Unlock for access to all 100 flashcards in this deck.
Unlock Deck
k this deck
31
The acid-test ratio is computed by dividing ____________________ assets by current liabilities.
Unlock Deck
Unlock for access to all 100 flashcards in this deck.
Unlock Deck
k this deck
32
Percentages of a base amount rather than dollar amounts are given for the items on ____________________ statements.
Unlock Deck
Unlock for access to all 100 flashcards in this deck.
Unlock Deck
k this deck
33
The price-earnings ratio is computed by dividing the current market value per share by the ____________________ per share.
Unlock Deck
Unlock for access to all 100 flashcards in this deck.
Unlock Deck
k this deck
34
If current liabilities are $90,000, long-term liabilities are $270,000, and total assets are $600,000, what is the percentage of total liabilities to total assets?
A) 15 percent
B) 45 percent
C) 60 percent
D) 100 percent
A) 15 percent
B) 45 percent
C) 60 percent
D) 100 percent
Unlock Deck
Unlock for access to all 100 flashcards in this deck.
Unlock Deck
k this deck
35
The excess of current assets over current liabilities is known as ___________________.
Unlock Deck
Unlock for access to all 100 flashcards in this deck.
Unlock Deck
k this deck
36
The current ratio is a measure of _____________________; that is, the ability of a company to pay its currently maturing debts.
Unlock Deck
Unlock for access to all 100 flashcards in this deck.
Unlock Deck
k this deck
37
The rate of return on net sales is a basic measure of operating efficiency and ___________________.
Unlock Deck
Unlock for access to all 100 flashcards in this deck.
Unlock Deck
k this deck
38
If the cost of goods sold is 65 percent of net sales, then gross profit on sales must be ____________________ percent of net sales.
Unlock Deck
Unlock for access to all 100 flashcards in this deck.
Unlock Deck
k this deck
39
If current assets are $90,000 and total assets are $270,000, what percentage of total assets are current assets?
A) 3.5 percent
B) 30 percent
C) 25 percent
D) 33 percent
A) 3.5 percent
B) 30 percent
C) 25 percent
D) 33 percent
Unlock Deck
Unlock for access to all 100 flashcards in this deck.
Unlock Deck
k this deck
40
The comparison of dollar amounts or percentages over several periods is called ____________________ analysis.
Unlock Deck
Unlock for access to all 100 flashcards in this deck.
Unlock Deck
k this deck
41
If long-term liabilities are $75,000 and total assets are $525,000, what percentage of total assets are long-term liabilities?
A) 7 percent
B) 16.7 percent
C) 12.5 percent
D) 14.3 percent
A) 7 percent
B) 16.7 percent
C) 12.5 percent
D) 14.3 percent
Unlock Deck
Unlock for access to all 100 flashcards in this deck.
Unlock Deck
k this deck
42
If the comparative balance sheet shows the amount and percentage of decrease in merchandise inventory from 2012 to 2013, the firm used
A) vertical analysis.
B) horizontal analysis.
C) common-size analysis.
D) trend analysis.
A) vertical analysis.
B) horizontal analysis.
C) common-size analysis.
D) trend analysis.
Unlock Deck
Unlock for access to all 100 flashcards in this deck.
Unlock Deck
k this deck
43
A firm has current liabilities of $60,000, stockholders' equity of $180,000 and total assets of $300,000. The percentage of total liabilities to total assets is
A) 20 percent.
B) 40 percent.
C) 60 percent.
D) 80 percent.
A) 20 percent.
B) 40 percent.
C) 60 percent.
D) 80 percent.
Unlock Deck
Unlock for access to all 100 flashcards in this deck.
Unlock Deck
k this deck
44
Which of the following is most likely to indicate that a firm is experiencing difficulty in collecting its receivables?
A) Its accounts receivable turnover decreases from 10 to 8.
B) Its accounts receivable turnover increases from 8 to 10.
C) Its average collection period decreases from 36 to 32.
D) Its average collection period increases from 25 to 28.
A) Its accounts receivable turnover decreases from 10 to 8.
B) Its accounts receivable turnover increases from 8 to 10.
C) Its average collection period decreases from 36 to 32.
D) Its average collection period increases from 25 to 28.
Unlock Deck
Unlock for access to all 100 flashcards in this deck.
Unlock Deck
k this deck
45
A firm has liabilities of $60,000 and stockholders' equity of $180,000. The percentage of total liabilities to total assets is
A) 25 percent.
B) 20 percent.
C) 50 percent.
D) 75 percent.
A) 25 percent.
B) 20 percent.
C) 50 percent.
D) 75 percent.
Unlock Deck
Unlock for access to all 100 flashcards in this deck.
Unlock Deck
k this deck
46
Which of the following is true of horizontal analysis?
A) The percentages of change can be added or subtracted from top to bottom.
B) The current year is always the base year.
C) The amounts of increase or decrease can be added or subtracted in the column from top to bottom and will give correct subtotals at each point.
D) The amounts and percentages of increase or decrease can be added and subtracted vertically in a column.
Unlock Deck
Unlock for access to all 100 flashcards in this deck.
Unlock Deck
k this deck
47
A company had income of $180,000 in 2012 and $240,000 in 2013. The increase in retained earnings from 2012 to 2013 is
A) 133 percent.
B) 33 percent.
C) 25 percent.
D) 125 percent.
A) 133 percent.
B) 33 percent.
C) 25 percent.
D) 125 percent.
Unlock Deck
Unlock for access to all 100 flashcards in this deck.
Unlock Deck
k this deck
48
In vertical analysis of the balance sheet, each item is expressed as a percentage of
A) current liabilities.
B) current assets.
C) long-term liabilities.
D) total assets or of total liabilities and stockholders' equity.
A) current liabilities.
B) current assets.
C) long-term liabilities.
D) total assets or of total liabilities and stockholders' equity.
Unlock Deck
Unlock for access to all 100 flashcards in this deck.
Unlock Deck
k this deck
49
If total merchandise available for sale is 72 percent of net sales and cost of goods sold is 64 percent of net sales, gross profit on sales is
A) 8 percent of net sales.
B) 36 percent of net sales.
C) 28 percent of net sales.
D) 20 percent of net sales.
A) 8 percent of net sales.
B) 36 percent of net sales.
C) 28 percent of net sales.
D) 20 percent of net sales.
Unlock Deck
Unlock for access to all 100 flashcards in this deck.
Unlock Deck
k this deck
50
If the ratio of total stockholders' equity to total assets was greater in 2013 than in 2012, then
A) total assets increased by a greater amount than did total stockholders' equity.
B) the ratio of total liabilities to total assets was smaller in 2013 than in 2012.
C) creditors would consider it riskier to lend to this company in 2013 than in 2012.
D) the ratio of total liabilities to total assets was larger in 2013 than in 2012.
Unlock Deck
Unlock for access to all 100 flashcards in this deck.
Unlock Deck
k this deck
51
A firm had retained earnings of $100,000 in 2012 and $125,000 in 2013. The increase in retained earnings from 2012 to 2013 is
A) 12.5 percent.
B) 20 percent.
C) 25 percent.
D) 125 percent.
A) 12.5 percent.
B) 20 percent.
C) 25 percent.
D) 125 percent.
Unlock Deck
Unlock for access to all 100 flashcards in this deck.
Unlock Deck
k this deck
52
Modern Products, Inc. had accounts receivable of $240,000 in 2012, and $300,000 in 2013. Net sales for 2013 was $3,000,000, and gross profit margin was $1,200,000. The accounts receivable turnover for 2013 was:
A) 12.5 times.
B) 11.1 times.
C) 10 times.
D) 5 times.
A) 12.5 times.
B) 11.1 times.
C) 10 times.
D) 5 times.
Unlock Deck
Unlock for access to all 100 flashcards in this deck.
Unlock Deck
k this deck
53
Trend analysis looks at
A) selected ratios over a period of time.
B) two years of information for comparison.
C) two or more companies for comparison.
D) profitability by industry.
A) selected ratios over a period of time.
B) two years of information for comparison.
C) two or more companies for comparison.
D) profitability by industry.
Unlock Deck
Unlock for access to all 100 flashcards in this deck.
Unlock Deck
k this deck
54
A company has total assets of $120,000, current assets of $80,000, total liabilities of $50,000, and current liabilities of $25,000. What is the current ratio?
A) 4.80 to 1
B) 3.20 to 1
C) 2.40 to 1
D) 1.60 to 1
A) 4.80 to 1
B) 3.20 to 1
C) 2.40 to 1
D) 1.60 to 1
Unlock Deck
Unlock for access to all 100 flashcards in this deck.
Unlock Deck
k this deck
55
A horizontal analysis of balance sheet data involves a comparison of a balance sheet amount on a given date with
A) the total of the assets on the balance sheet for that date.
B) the net sales from the income statement for the period ending on that date.
C) the total stockholders' equity on the balance sheet for that date.
D) the amount for the same balance sheet item on a previous date.
A) the total of the assets on the balance sheet for that date.
B) the net sales from the income statement for the period ending on that date.
C) the total stockholders' equity on the balance sheet for that date.
D) the amount for the same balance sheet item on a previous date.
Unlock Deck
Unlock for access to all 100 flashcards in this deck.
Unlock Deck
k this deck
56
A company's January 1 balance in Merchandise Inventory is $40,000. The December 31 balance is $35,000. Cost of goods sold is $220,000. The company's inventory turnover is
A) 17.05 to 1.
B) 6.29 to 1.
C) 5.87 to 1.
D) 18.18 to 1.
A) 17.05 to 1.
B) 6.29 to 1.
C) 5.87 to 1.
D) 18.18 to 1.
Unlock Deck
Unlock for access to all 100 flashcards in this deck.
Unlock Deck
k this deck
57
Which of the following is not true of vertical analysis?
A) Each item on the balance sheet is expressed as a percentage of total liabilities.
B) The percentages can be added and subtracted from top to bottom.
C) Each item in the income statement is expressed as a percentage of net sales.
D) Each item on the balance sheet is expressed as a percentage of total assets.
Unlock Deck
Unlock for access to all 100 flashcards in this deck.
Unlock Deck
k this deck
58
In a vertical analysis of data, the cost of goods sold most likely would be expressed as a percentage of
A) net sales.
B) net income.
C) gross profit on sales.
D) total expenses.
A) net sales.
B) net income.
C) gross profit on sales.
D) total expenses.
Unlock Deck
Unlock for access to all 100 flashcards in this deck.
Unlock Deck
k this deck
59
Comparing the amount of a balance sheet item in one year to the amount for the same item in a prior year is called
A) common-size analysis.
B) vertical analysis.
C) horizontal analysis.
D) trend analysis.
A) common-size analysis.
B) vertical analysis.
C) horizontal analysis.
D) trend analysis.
Unlock Deck
Unlock for access to all 100 flashcards in this deck.
Unlock Deck
k this deck
60
Vertical analysis of income statement data most often involves a comparison of each income statement item with
A) net sales.
B) gross profit on sales.
C) net income before taxes.
D) net income after taxes.
A) net sales.
B) gross profit on sales.
C) net income before taxes.
D) net income after taxes.
Unlock Deck
Unlock for access to all 100 flashcards in this deck.
Unlock Deck
k this deck
61
Using the information shown, prepare a horizontal analysis. Carry all calculations to two decimal places and then round to one decimal place.
Unlock Deck
Unlock for access to all 100 flashcards in this deck.
Unlock Deck
k this deck
62
Using the information given, discuss Lee Corporation's outcomes compared to J & S Partnership.
Unlock Deck
Unlock for access to all 100 flashcards in this deck.
Unlock Deck
k this deck
63
Differentiate between horizontal analysis and trend analysis. What does each reveal about the company being analyzed?
Unlock Deck
Unlock for access to all 100 flashcards in this deck.
Unlock Deck
k this deck
64
Using the comparative balance sheet assets given below, prepare a horizontal analysis of all asset items. Carry all calculations to two decimal places and then round to one decimal place.
Unlock Deck
Unlock for access to all 100 flashcards in this deck.
Unlock Deck
k this deck
65
Using the information shown, prepare a vertical analysis. Carry all calculations to two decimal places and then round to one decimal place.
Unlock Deck
Unlock for access to all 100 flashcards in this deck.
Unlock Deck
k this deck
66
Using the information given, discuss Lee Corporation's standing when compared to the industry averages.
Unlock Deck
Unlock for access to all 100 flashcards in this deck.
Unlock Deck
k this deck
67
Low inventory turnover compared with the industry average might reflect
A) obsolete goods.
B) poor purchasing procedures.
C) excess merchandise.
D) all of the above.
A) obsolete goods.
B) poor purchasing procedures.
C) excess merchandise.
D) all of the above.
Unlock Deck
Unlock for access to all 100 flashcards in this deck.
Unlock Deck
k this deck
68
Using the comparative income statement given below, prepare a horizontal analysis of all items. Carry all calculations to two decimal places and then round to one decimal place.
Unlock Deck
Unlock for access to all 100 flashcards in this deck.
Unlock Deck
k this deck
69
Using the comparative balance sheet assets given below, prepare a horizontal analysis of all asset items. Carry all calculations to two decimal places and then round to one decimal place.
Unlock Deck
Unlock for access to all 100 flashcards in this deck.
Unlock Deck
k this deck
70
Using the information shown, prepare a vertical analysis of all asset items. Carry all calculations to two decimal places and then round to one decimal place. (Leave all percentages unadjusted.)
Unlock Deck
Unlock for access to all 100 flashcards in this deck.
Unlock Deck
k this deck
71
Using the information given, discuss J & S Partnership's outcomes compared to the industry averages.
Unlock Deck
Unlock for access to all 100 flashcards in this deck.
Unlock Deck
k this deck
72
Using the comparative balance sheet given below, prepare a vertical analysis of all asset items. Carry all calculations to two decimal places and then round to one decimal place. (Leave all vertical analysis percentages unadjusted.)
Unlock Deck
Unlock for access to all 100 flashcards in this deck.
Unlock Deck
k this deck
73
Using the information shown, prepare a vertical analysis of all asset items. Carry all calculations to two decimal places and then round to one decimal place. (Leave all percentages unadjusted.)
Unlock Deck
Unlock for access to all 100 flashcards in this deck.
Unlock Deck
k this deck
74
Using the information shown, prepare a vertical analysis. Carry all calculations to two decimal places and then round to one decimal place. (Leave all percentages unadjusted.)
Unlock Deck
Unlock for access to all 100 flashcards in this deck.
Unlock Deck
k this deck
75
Using the information shown, prepare a horizontal analysis. Carry all calculations to two decimal places and then round to one decimal place.
Unlock Deck
Unlock for access to all 100 flashcards in this deck.
Unlock Deck
k this deck
76
Using the information given below, calculate the gross profit percentage based on net sales. What conclusions can be made about this company based on this trend analysis?
Unlock Deck
Unlock for access to all 100 flashcards in this deck.
Unlock Deck
k this deck
77
What is a ratio that measures financial strength?
A) ratio of stockholders' equity to total liabilities
B) current ratio
C) working capital
D) rate of return on sales
A) ratio of stockholders' equity to total liabilities
B) current ratio
C) working capital
D) rate of return on sales
Unlock Deck
Unlock for access to all 100 flashcards in this deck.
Unlock Deck
k this deck
78
Using the information given below, calculate the gross profit percentage based on net sales. What conclusions can be made about this company based on this trend analysis?
Unlock Deck
Unlock for access to all 100 flashcards in this deck.
Unlock Deck
k this deck
79
Using the comparative income statement given below, prepare a vertical analysis of all items. Carry all calculations to two decimal places and then round to one decimal place. (Leave all vertical analysis percentages unadjusted in this problem.)
Unlock Deck
Unlock for access to all 100 flashcards in this deck.
Unlock Deck
k this deck
80
Using the comparative balance sheet given below, prepare a horizontal analysis of all asset items. Carry all calculations to two decimal places and then round to one decimal place.
Unlock Deck
Unlock for access to all 100 flashcards in this deck.
Unlock Deck
k this deck
Unlock Deck
Unlock for access to all 100 flashcards in this deck.


