Deck 10: The Aggregate Demand-Aggregate Supply Model
Full screen (f)
Question
Question
Question
Question
Question
Question
Question
Question
Question
Question
Question
Question
Question
Question
Question
Question
Question
Question
Question
Question
Question
Question
Question
Suppose the economy is in an inflationary gap,as illustrated by point A in the diagram below:
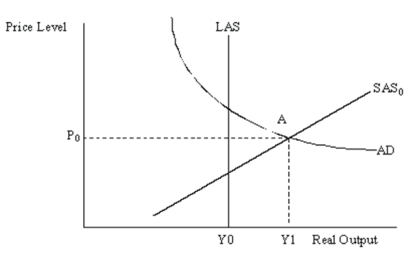 Suppose that everyone knows that inflationary gaps lead to cost pressures that will eventually result in the price level rising.Since people expect the price level to rise soon,suppose they increase their buying now (before prices rise).Demonstrate graphically and explain verbally how this will complicate the economy's adjustment story described in the text.
Suppose that everyone knows that inflationary gaps lead to cost pressures that will eventually result in the price level rising.Since people expect the price level to rise soon,suppose they increase their buying now (before prices rise).Demonstrate graphically and explain verbally how this will complicate the economy's adjustment story described in the text. Question
Question
Question
Question
Question
Question
Question
Question
Question
Question
Question
Question
Question
Question
Question
Question
Consider the following diagram
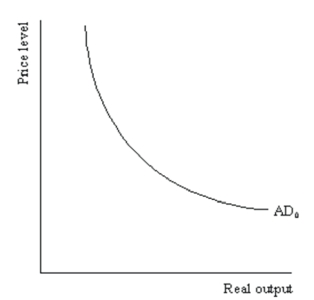 Demonstrate graphically and explain verbally the impact of a decrease of 50 in government spending on the AD curve in the diagram when the multiplier is 3.
Demonstrate graphically and explain verbally the impact of a decrease of 50 in government spending on the AD curve in the diagram when the multiplier is 3. Question

Unlock Deck
Sign up to unlock the cards in this deck!
Unlock Deck
Unlock Deck
1/40
Play
Full screen (f)
Deck 10: The Aggregate Demand-Aggregate Supply Model
1
Imagine you are the chief economist on the President's Council of Economic Advisers.The President has asked you to develop a policy that she can announce during her upcoming State of the Union Address.Your staff knows the President has a fondness for the SAS-AD model.Unfortunately you can't you give her solid policy prescriptions based on that model because you do not know the location of the LAS curve.Explain why that is a serious problem.
Unfortunately on the basis of an AD-SAS diagram you are not able to give any policy advice to the President because your staff has not told you where potential output (LAS)is.If potential output is equal to the AD-SAS equilibrium output,you can tell the President to announce everything is great and we'll have more of the same.If the potential output is greater than the AD-SAS equilibrium,the economy is in a recessionary gap and you would likely suggest to the President that she announce some new spending or tax cut programs to increase AD.If the potential output is less than the AD-SAS equilibrium output,the economy is in an inflationary gap.You can then advise the President to either; wait it out and let the economy correct itself or reduce government spending to decrease AD.Which policy advice to give? You cannot know unless you can come up with an accurate assessment of where potential output is.And that is no easy task.(LO6)Short Answer Questions
2
What are the effects of an increase in aggregate demand (AD)in the short run and the long run? What is the effect of an increase in the short run aggregate supply (SAS)? What is the effect of an increase in Long run Aggregate Supply (LAS)?
The short run effect of an increase in Aggregate Demand (AD),all other things remaining constant,is an increase in output and an increase in the price level.In the long run,the level of output is constant so an increase in aggregate demand will simply increase the price level.The effect of an increase in Short run Aggregate Supply (SAS),all other things remaining constant,is an increase in output and a decrease in the price level.The effect of an increase in Long run Aggregate Supply (LAS),all other things remaining constant,is an increase in output.The effect on the price level is indeterminate.(LO5)
3
Give two examples of expectations that would tend to cause the aggregate demand curve to rise (shift out to the right).
If there are expectations of rising incomes,consumers will be more confident about spending their current incomes rather than saving for the future,increasing consumption expenditures.At the same time,business will want to be prepared to meet the demands of a higher income consumer segment,and will spend more on investment to increase output capacity.Expectations of rising prices can also increase aggregate expenditures.If consumers believe that prices will be higher in the future,it makes sense for them to accelerate some planned purchases and buy them now,when they are cheaper.This was described as the intertemporal price level effect.
4
The Classical economists and the Keynesian economists differed sharply in their reasoning about the causes of the Great Depression and on their proposed solutions for the unemployment problem.Describe the views of each group of economists.
Unlock Deck
Unlock for access to all 40 flashcards in this deck.
Unlock Deck
k this deck
5
Describe two distinct and opposing effects that a fall in interest rates (that are not caused by changes in the price level)could have on the AS/AD model.
Unlock Deck
Unlock for access to all 40 flashcards in this deck.
Unlock Deck
k this deck
6
Explain the difference between the long run and short-run views of saving.
Unlock Deck
Unlock for access to all 40 flashcards in this deck.
Unlock Deck
k this deck
7
Canada is the largest trading partner of the U.S.Suppose the U.S.economy keeps growing.What will happen to the AD curve for Canada?
Unlock Deck
Unlock for access to all 40 flashcards in this deck.
Unlock Deck
k this deck
8
Suppose that in order to win voter support for reelection,an incumbent President pushes a tax cut through Congress.What impact will this have on the AD curve?
Unlock Deck
Unlock for access to all 40 flashcards in this deck.
Unlock Deck
k this deck
9
Why might we expect the AD curve to be vertical?
Unlock Deck
Unlock for access to all 40 flashcards in this deck.
Unlock Deck
k this deck
10
List the factors that cause the AD curve to shift.Explain the impact of changes in each factor on the AD curve.
Unlock Deck
Unlock for access to all 40 flashcards in this deck.
Unlock Deck
k this deck
11
In 2008,the world experienced a global recession.Why would the U.S.be concerned about other parts of the world,particularly Japan,Western Europe,Canada,and Mexico,having recessions?
Unlock Deck
Unlock for access to all 40 flashcards in this deck.
Unlock Deck
k this deck
12
What was the Classical economists' suggestion for ending unemployment during the Great Depression?
Unlock Deck
Unlock for access to all 40 flashcards in this deck.
Unlock Deck
k this deck
13
Explain why the long-run aggregate supply (LAS)curve is vertical.What determines the position of the LAS curve?
Unlock Deck
Unlock for access to all 40 flashcards in this deck.
Unlock Deck
k this deck
14
Keynes did not agree with the way the Classical economists described the workings of the economy.What was the essence of his thinking?
Unlock Deck
Unlock for access to all 40 flashcards in this deck.
Unlock Deck
k this deck
15
The shape of the short-run aggregate supply (SAS)curve reflects two different types of microeconomic markets (auction markets and the posted price markets).How is the price level linked to the level of output in each market? List five factors that might cause an upward shift of the SAS curve.
Unlock Deck
Unlock for access to all 40 flashcards in this deck.
Unlock Deck
k this deck
16
According to Keynes there is a difference between equilibrium income and potential income.Explain this difference.
Unlock Deck
Unlock for access to all 40 flashcards in this deck.
Unlock Deck
k this deck
17
What is the difference,in terms of the time frame of analysis,between Classicals and Keynesians?
Unlock Deck
Unlock for access to all 40 flashcards in this deck.
Unlock Deck
k this deck
18
What does aggregate demand management mean?
Unlock Deck
Unlock for access to all 40 flashcards in this deck.
Unlock Deck
k this deck
19
Explain why the aggregate demand curve is downward sloping.(As the price level falls,the quantity of real output demanded increases.).List five factors that might cause the AD curve to shift outward
Unlock Deck
Unlock for access to all 40 flashcards in this deck.
Unlock Deck
k this deck
20
Describe two ways in which the macro AS/AD model differs from the micro supply and demand model.
Unlock Deck
Unlock for access to all 40 flashcards in this deck.
Unlock Deck
k this deck
21
For each of the following "quotes" from The Wall Street Journal,draw a picture to show how the AD curve will shift.Label your original curve AD0 and your new curve AD1.
(a)"The value of the US dollar rose about 50% against the yen and 20% against the mark."
(b)"The Dow Jones Industrials closed above 15,000 for the first time"
(c)"Federal investment in civilian capital and infrastructure,education,and research and development is falling."
(a)"The value of the US dollar rose about 50% against the yen and 20% against the mark."
(b)"The Dow Jones Industrials closed above 15,000 for the first time"
(c)"Federal investment in civilian capital and infrastructure,education,and research and development is falling."
Unlock Deck
Unlock for access to all 40 flashcards in this deck.
Unlock Deck
k this deck
22
In 2001,the U.S.economy suffered a mild recession.As a result,the Fed implemented expansionary monetary policy several times,and expanded the money supply to stimulate the economy.Explain the intention of such monetary policy.
Unlock Deck
Unlock for access to all 40 flashcards in this deck.
Unlock Deck
k this deck
23
Suppose the economy is in an inflationary gap,as illustrated by point A in the diagram below:
Suppose that everyone knows that inflationary gaps lead to cost pressures that will eventually result in the price level rising.Since people expect the price level to rise soon,suppose they increase their buying now (before prices rise).Demonstrate graphically and explain verbally how this will complicate the economy's adjustment story described in the text.
Suppose that everyone knows that inflationary gaps lead to cost pressures that will eventually result in the price level rising.Since people expect the price level to rise soon,suppose they increase their buying now (before prices rise).Demonstrate graphically and explain verbally how this will complicate the economy's adjustment story described in the text. Unlock Deck
Unlock for access to all 40 flashcards in this deck.
Unlock Deck
k this deck
24
Explain what will happen to the SAS curve if productivity increases.
Unlock Deck
Unlock for access to all 40 flashcards in this deck.
Unlock Deck
k this deck
25
What is deflation? What could deflation do during a recession?
Unlock Deck
Unlock for access to all 40 flashcards in this deck.
Unlock Deck
k this deck
26
What does it mean if the economy becomes dynamically unstable?
Unlock Deck
Unlock for access to all 40 flashcards in this deck.
Unlock Deck
k this deck
27
Explain why the long-run aggregate supply (LAS)curve is vertical.
Unlock Deck
Unlock for access to all 40 flashcards in this deck.
Unlock Deck
k this deck
28
Demonstrate graphically and explain verbally the comparison of the impact of a drop in the price level on the shape of the aggregate demand curve when the multiplier effect is positive to when it is zero.
Unlock Deck
Unlock for access to all 40 flashcards in this deck.
Unlock Deck
k this deck
29
Demonstrate graphically and explain verbally the case of an inflationary gap.Describe the forces in the economy that will result in the gap closing itself.
Unlock Deck
Unlock for access to all 40 flashcards in this deck.
Unlock Deck
k this deck
30
Assuming the economy is in long-run equilibrium,using an AS/AD diagram,demonstrate graphically and explain verbally the long-run impact on the price level and real output of an expectation by business executives of a recession in the near future.
Unlock Deck
Unlock for access to all 40 flashcards in this deck.
Unlock Deck
k this deck
31
How might feedback effects cause a fall in housing prices (like the one that set off the crisis in the U.S.economy in 2008)to cause a worse result than the one predicted by the standard AS/AD model?
Unlock Deck
Unlock for access to all 40 flashcards in this deck.
Unlock Deck
k this deck
32
What are the three ways that falling asset prices can affect aggregate demand?
Unlock Deck
Unlock for access to all 40 flashcards in this deck.
Unlock Deck
k this deck
33
Using an AS/AD diagram,demonstrate graphically and explain verbally the short-run impact on the price level and real output of an increase in the labor productivity schedule.
Unlock Deck
Unlock for access to all 40 flashcards in this deck.
Unlock Deck
k this deck
34
What are feedback effects,and how does the AS/AD model incorporate them?
Unlock Deck
Unlock for access to all 40 flashcards in this deck.
Unlock Deck
k this deck
35
Why is the short-run aggregate supply (SAS)curve upward sloping?
Unlock Deck
Unlock for access to all 40 flashcards in this deck.
Unlock Deck
k this deck
36
What factors shift the short-run aggregate supply (SAS)curve? Explain the impact of changes in each factor on the SAS curve.
Unlock Deck
Unlock for access to all 40 flashcards in this deck.
Unlock Deck
k this deck
37
Demonstrate graphically and explain verbally the role the multiplier effect has in the shape of the aggregate demand curve.
Unlock Deck
Unlock for access to all 40 flashcards in this deck.
Unlock Deck
k this deck
38
Demonstrate graphically and explain verbally a recessionary gap.Describe two solutions for closing the gap.
Unlock Deck
Unlock for access to all 40 flashcards in this deck.
Unlock Deck
k this deck
39
Consider the following diagram
Demonstrate graphically and explain verbally the impact of a decrease of 50 in government spending on the AD curve in the diagram when the multiplier is 3.
Demonstrate graphically and explain verbally the impact of a decrease of 50 in government spending on the AD curve in the diagram when the multiplier is 3. Unlock Deck
Unlock for access to all 40 flashcards in this deck.
Unlock Deck
k this deck
40
Explain verbally and demonstrate graphically how in an AS/AD model with dynamic feedback effects,a decline in the price level can lead to a vicious downward spiral.
Unlock Deck
Unlock for access to all 40 flashcards in this deck.
Unlock Deck
k this deck
Unlock Deck
Unlock for access to all 40 flashcards in this deck.


