Deck 11: The Multiplier Model
Full screen (f)
Question
Question
Question
Question
Question
Question
Question
Question
Question
Question
Question
Question
Question
Question
Question
Question
Question
Question
Question
Question
Question
Question
Question
Question
Consider the following multiplier model diagram:
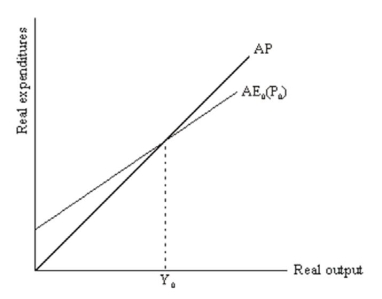 Demonstrate graphically (and explain your graph)what will happen in the picture when autonomous spending increases.Demonstrate the same in the AD/AS model.
Demonstrate graphically (and explain your graph)what will happen in the picture when autonomous spending increases.Demonstrate the same in the AD/AS model. Question
Consider the following multiplier model diagram:
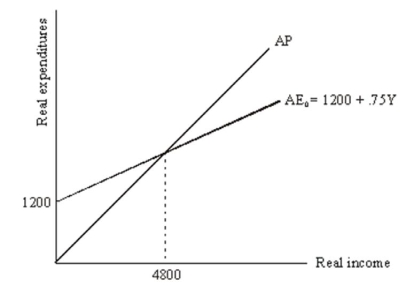
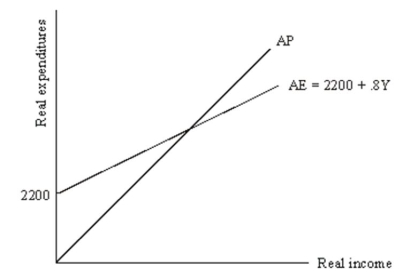 (a)What is the value of equilibrium income?
(b)Demonstrate graphically and explain verbally the impact on equilibrium income of a decrease in exports of 50.
(c)Explain why the change in equilibrium income exceeds the change in exports in your answer for part
(a)What is the value of equilibrium income?(b)Demonstrate graphically and explain verbally the impact on equilibrium income of a decrease in exports of 50.
(c)Explain why the change in equilibrium income exceeds the change in exports in your answer for part
Question
Question
Consider the following multiplier model diagram:
 For each of the following,draw a picture to show what would happen to the equilibrium level of income in the economy.
(a)Consumers,in their delight over the Dow Jones Industrial Average reaching 15,000,decide to go on a spending spree.
(b)Between 2000 and 2009 the euro increased in value by over 30% relative to the U.S.dollar.
(c)The prospect that the Social Security system will not be viable beyond the year 2017 has many,many people saving more of their income than ever before.
For each of the following,draw a picture to show what would happen to the equilibrium level of income in the economy.(a)Consumers,in their delight over the Dow Jones Industrial Average reaching 15,000,decide to go on a spending spree.
(b)Between 2000 and 2009 the euro increased in value by over 30% relative to the U.S.dollar.
(c)The prospect that the Social Security system will not be viable beyond the year 2017 has many,many people saving more of their income than ever before.
Question
Consider the following multiplier model diagram:
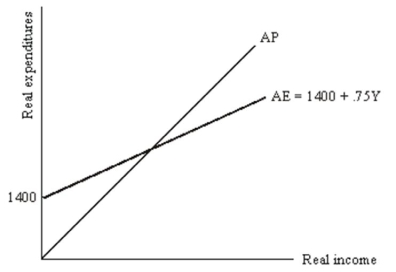 (a)What is the value of equilibrium income?
(b)Demonstrate graphically and explain verbally the impact on equilibrium income of an increase in government spending of 100.
(c)Explain why the change in equilibrium income exceeds the change in government expenditures in your answer for part (b).
(a)What is the value of equilibrium income?(b)Demonstrate graphically and explain verbally the impact on equilibrium income of an increase in government spending of 100.
(c)Explain why the change in equilibrium income exceeds the change in government expenditures in your answer for part (b).
Question
Question
Question
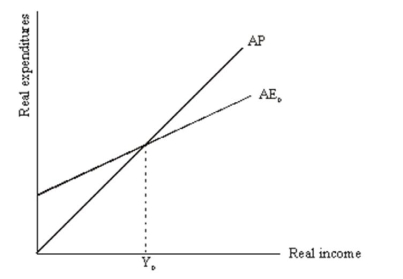
Consider the following multiplier model diagram:
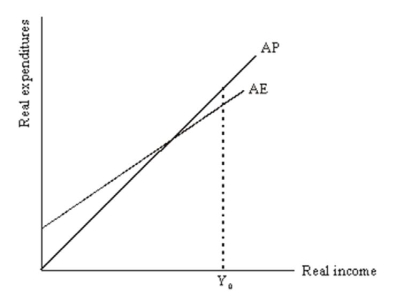 Is the income level of Y0 an equilibrium level of income? If yes,explain why.If not,explain how the economy will get to equilibrium.
Is the income level of Y0 an equilibrium level of income? If yes,explain why.If not,explain how the economy will get to equilibrium. Question
Consider the following multiplier model diagram:
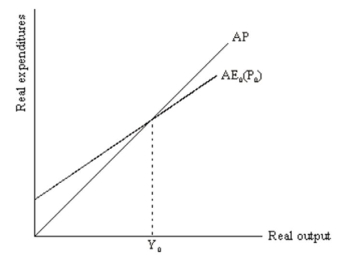 Demonstrate graphically (and explain your graph)what will happen in the picture when the price level increases.Link this diagram to the AD/AS model by showing the effects of an increase in the price level in the AD/AS model.Assume a horizontal SAS curve.
Demonstrate graphically (and explain your graph)what will happen in the picture when the price level increases.Link this diagram to the AD/AS model by showing the effects of an increase in the price level in the AD/AS model.Assume a horizontal SAS curve. Question
Question
Question
Question
Question
For each of the following state the level of autonomous expenditures and induced expenditures.
(a)Given the following table and income equals $200.
 (b)Given the following expenditures function AE = $4,000 + 0.6Y and income equals $1,000.
(a)Given the following table and income equals $200.
(b)Given the following expenditures function AE = $4,000 + 0.6Y and income equals $1,000. Question
Consider the following multiplier model diagram:
 For each of the following,draw a picture to show what would happen to the equilibrium level of income in the economy.
(a)Consumer sentiment about the future improves resulting in an increase in autonomous consumption of 100.
(b)Foreign economic activity rises,which results in an increase in autonomous exports of 100.
(c)Because the average life span increases,many people are saving more of their income than ever before.Consequently the mpe falls from 0.75 to 0.66.
For each of the following,draw a picture to show what would happen to the equilibrium level of income in the economy.(a)Consumer sentiment about the future improves resulting in an increase in autonomous consumption of 100.
(b)Foreign economic activity rises,which results in an increase in autonomous exports of 100.
(c)Because the average life span increases,many people are saving more of their income than ever before.Consequently the mpe falls from 0.75 to 0.66.

Unlock Deck
Sign up to unlock the cards in this deck!
Unlock Deck
Unlock Deck
1/38
Play
Full screen (f)
Deck 11: The Multiplier Model
1
How accurately does the multiplier model incorporate small shocks to the economy? What about large shocks?
The multiplier model tends to overestimate the effects of small shocks to the economy and underestimate the effects of large shocks to the economy.
2
Suppose consumers decide to spend less of every dollar of income earned than previously spent.What would happen to the AE curve? Explain.
The AE curve would get flatter.The amount of every dollar of income spent is the mpe,which is the slope of the AE curve.If the slope goes down,the curve gets flatter.
3
What is meant by the term induced expenditures? Provide an example.
Induced expenditures refer to expenditures that are a function of income.For example,a person may spend,say,$4,000 per year on basic necessities of life,regardless of their income.But people who have higher incomes will eat better (and more expensive)food,live in nicer (and more expensive)homes,and spend more money on entertainment,luxury items,etc.than those who are just struggling to get by.As people's incomes rise,they tend to spend some portion of the additional income (the mpc),and in that sense,these expenditures are induced by rises in income.
4
How does the multiplier-accelerator model work?
Unlock Deck
Unlock for access to all 38 flashcards in this deck.
Unlock Deck
k this deck
5
How is the level of income determined graphically in the multiplier model?
Unlock Deck
Unlock for access to all 38 flashcards in this deck.
Unlock Deck
k this deck
6
List four reasons why analyzing the economy is not as precise as the multiplier model makes it appear.
Unlock Deck
Unlock for access to all 38 flashcards in this deck.
Unlock Deck
k this deck
7
Assume that the marginal propensity to expend is 0.75 and therefore the multiplier is 4.According to the multiplier model,an increase in autonomous exports of 100 would raise the equilibrium level of income by 400.Explain how the multiplier process amplifies the initial shift in autonomous expenditures.
Unlock Deck
Unlock for access to all 38 flashcards in this deck.
Unlock Deck
k this deck
8
In the multiplier model all expenditures are classified as one of two types.Explain and give an example of each type of expenditure.
Unlock Deck
Unlock for access to all 38 flashcards in this deck.
Unlock Deck
k this deck
9
What is the difference between viewing the multiplier model as a mechanistic model versus viewing it as an interpretive model?
Unlock Deck
Unlock for access to all 38 flashcards in this deck.
Unlock Deck
k this deck
10
Explain how you can use planned aggregate expenditures and aggregate production to determine the level of income at which the economy will be in equilibrium.
Unlock Deck
Unlock for access to all 38 flashcards in this deck.
Unlock Deck
k this deck
11
Write the formula for the multiplier.What happens to the multiplier when the mpe gets larger?
Unlock Deck
Unlock for access to all 38 flashcards in this deck.
Unlock Deck
k this deck
12
Describe the basic difference between the AS/AD model and the multiplier model.
Unlock Deck
Unlock for access to all 38 flashcards in this deck.
Unlock Deck
k this deck
13
Suppose the government increases autonomous taxes (taxes that do not depend on income).What would happen to the AE curve? Explain.
Unlock Deck
Unlock for access to all 38 flashcards in this deck.
Unlock Deck
k this deck
14
Assume that the economy is initially at an income level of $1,000 and the potential income level is $1,200.How can government fiscal policy be used to get the economy out of this recession? Why might this policy not work in real life?
Unlock Deck
Unlock for access to all 38 flashcards in this deck.
Unlock Deck
k this deck
15
Analyzing the economy is not as precise as the multiplier model makes it appear,for the following reasons: 1)Fluctuations can sometimes be greater than the model suggests,2)The multiplier model is not a complete model of the economy,3)Shifts are not as great as intuition suggests.4)The price level will often change in response to shifts in demand.5)People's forward-looking expectations make the adjustment process much more complicated.6)Shifts in expenditures might reflect desired shifts in supply and demand,and,7)Expenditures depend on much more than current income.Discuss three of these reasons.
Unlock Deck
Unlock for access to all 38 flashcards in this deck.
Unlock Deck
k this deck
16
What shifts the aggregate expenditures function? What changes its slope?
Unlock Deck
Unlock for access to all 38 flashcards in this deck.
Unlock Deck
k this deck
17
Demonstrate graphically and explain the AP curve in the multiplier model.
Unlock Deck
Unlock for access to all 38 flashcards in this deck.
Unlock Deck
k this deck
18
Use the multiplier equation to determine equilibrium income.Give a numeric example.
Unlock Deck
Unlock for access to all 38 flashcards in this deck.
Unlock Deck
k this deck
19
What is the real business cycle theory of the economy?
Unlock Deck
Unlock for access to all 38 flashcards in this deck.
Unlock Deck
k this deck
20
What is the marginal propensity to expend? How does it relate to the AE curve?
Unlock Deck
Unlock for access to all 38 flashcards in this deck.
Unlock Deck
k this deck
21
Suppose the multiplier model is
C = C0 + cY
I = I0
M = M0
X = X0
Y = C + I + X - M
where C0 is autonomous consumption,c is the marginal propensity to expend,Y is income,C is consumption,I is investment,X is exports of goods from the United States and M is imports of goods into the U.S.
What is the formula for equilibrium national income (Ye)?
Unlock Deck
Unlock for access to all 38 flashcards in this deck.
Unlock Deck
k this deck
22
Answer parts (a)-(e)below based on the AE equation AE = 2,500 + 0.9Y.
(a)What is the level of autonomous expenditures?
(b)If income is 1,000 what is the level of induced expenditures?
(c)What is the mpe?
(d)What is the value of the multiplier?
(e)What is the level of equilibrium income?
(a)What is the level of autonomous expenditures?
(b)If income is 1,000 what is the level of induced expenditures?
(c)What is the mpe?
(d)What is the value of the multiplier?
(e)What is the level of equilibrium income?
Unlock Deck
Unlock for access to all 38 flashcards in this deck.
Unlock Deck
k this deck
23
(a)Demonstrate graphically and explain the implications of the permanent income hypothesis on the multiplier model.
(b)How do changes in autonomous expenditures affect the change in income in this case?
(b)How do changes in autonomous expenditures affect the change in income in this case?
Unlock Deck
Unlock for access to all 38 flashcards in this deck.
Unlock Deck
k this deck
24
Consider the following multiplier model diagram:
Demonstrate graphically (and explain your graph)what will happen in the picture when autonomous spending increases.Demonstrate the same in the AD/AS model.
Demonstrate graphically (and explain your graph)what will happen in the picture when autonomous spending increases.Demonstrate the same in the AD/AS model. Unlock Deck
Unlock for access to all 38 flashcards in this deck.
Unlock Deck
k this deck
25
Consider the following multiplier model diagram:
(a)What is the value of equilibrium income?
(b)Demonstrate graphically and explain verbally the impact on equilibrium income of a decrease in exports of 50.
(c)Explain why the change in equilibrium income exceeds the change in exports in your answer for part
(a)What is the value of equilibrium income?(b)Demonstrate graphically and explain verbally the impact on equilibrium income of a decrease in exports of 50.
(c)Explain why the change in equilibrium income exceeds the change in exports in your answer for part
Unlock Deck
Unlock for access to all 38 flashcards in this deck.
Unlock Deck
k this deck
26
The mpe for the economy is 0.67.Autonomous consumption is $500,investment is $300,government spending is $250,and net exports are -$100.
(a)What is equilibrium income for the economy?
(b)If government policies were able to eliminate the trade deficit (and make net exports zero)without affecting anything else,what impact would that have on the equilibrium level of income?
(c)Suppose that the policies to increase exports in part (b)also had the effect of increasing investment by $50,and allowed the government to cut $30 in subsidies.Calculate the new equilibrium income.
Unlock Deck
Unlock for access to all 38 flashcards in this deck.
Unlock Deck
k this deck
27
Consider the following multiplier model diagram:
For each of the following,draw a picture to show what would happen to the equilibrium level of income in the economy.
(a)Consumers,in their delight over the Dow Jones Industrial Average reaching 15,000,decide to go on a spending spree.
(b)Between 2000 and 2009 the euro increased in value by over 30% relative to the U.S.dollar.
(c)The prospect that the Social Security system will not be viable beyond the year 2017 has many,many people saving more of their income than ever before.
For each of the following,draw a picture to show what would happen to the equilibrium level of income in the economy.(a)Consumers,in their delight over the Dow Jones Industrial Average reaching 15,000,decide to go on a spending spree.
(b)Between 2000 and 2009 the euro increased in value by over 30% relative to the U.S.dollar.
(c)The prospect that the Social Security system will not be viable beyond the year 2017 has many,many people saving more of their income than ever before.
Unlock Deck
Unlock for access to all 38 flashcards in this deck.
Unlock Deck
k this deck
28
Consider the following multiplier model diagram:
(a)What is the value of equilibrium income?
(b)Demonstrate graphically and explain verbally the impact on equilibrium income of an increase in government spending of 100.
(c)Explain why the change in equilibrium income exceeds the change in government expenditures in your answer for part (b).
(a)What is the value of equilibrium income?(b)Demonstrate graphically and explain verbally the impact on equilibrium income of an increase in government spending of 100.
(c)Explain why the change in equilibrium income exceeds the change in government expenditures in your answer for part (b).
Unlock Deck
Unlock for access to all 38 flashcards in this deck.
Unlock Deck
k this deck
29
Consider a multiplier model in which autonomous expenditures are $2,250 billion and the mpe is 0.8.Suppose that the President asks you to explain to him the impact that a $50 billion cut in government spending will have on the economy.Provide a mechanistic and an interpretive explanation.
Unlock Deck
Unlock for access to all 38 flashcards in this deck.
Unlock Deck
k this deck
30
Consider the following multiplier model:
AE = 5,000 + 0.9Y,and potential output equals 45,000.
(1)Calculate equilibrium output.
(2)State what fiscal policy you would recommend to eliminate the inflationary or recessionary gap.
(3)Calculate the change in government spending needed to eliminate the gap.
AE = 5,000 + 0.9Y,and potential output equals 45,000.
(1)Calculate equilibrium output.
(2)State what fiscal policy you would recommend to eliminate the inflationary or recessionary gap.
(3)Calculate the change in government spending needed to eliminate the gap.
Unlock Deck
Unlock for access to all 38 flashcards in this deck.
Unlock Deck
k this deck
31
Consider the following multiplier model diagram:
Is the income level of Y0 an equilibrium level of income? If yes,explain why.If not,explain how the economy will get to equilibrium.
Is the income level of Y0 an equilibrium level of income? If yes,explain why.If not,explain how the economy will get to equilibrium. Unlock Deck
Unlock for access to all 38 flashcards in this deck.
Unlock Deck
k this deck
32
Consider the following multiplier model diagram:
Demonstrate graphically (and explain your graph)what will happen in the picture when the price level increases.Link this diagram to the AD/AS model by showing the effects of an increase in the price level in the AD/AS model.Assume a horizontal SAS curve.
Demonstrate graphically (and explain your graph)what will happen in the picture when the price level increases.Link this diagram to the AD/AS model by showing the effects of an increase in the price level in the AD/AS model.Assume a horizontal SAS curve. Unlock Deck
Unlock for access to all 38 flashcards in this deck.
Unlock Deck
k this deck
33
(a)Draw an aggregate production curve and explain why you have drawn it as you have.What is its slope?
(b)Draw the aggregate expenditures curve that corresponds to the expenditures function:
E = $2,000 + 0.6Y.Explain why you have drawn it as you have.What is its slope?
(c)Label equilibrium income and explain why income levels above and below are points of disequilibrium.
(b)Draw the aggregate expenditures curve that corresponds to the expenditures function:
E = $2,000 + 0.6Y.Explain why you have drawn it as you have.What is its slope?
(c)Label equilibrium income and explain why income levels above and below are points of disequilibrium.
Unlock Deck
Unlock for access to all 38 flashcards in this deck.
Unlock Deck
k this deck
34
Answer parts (a)-(e)below on the basis of the following table.
(a)Fill in columns (2)and (4).
(b)What is the value of autonomous expenditures?
(c)What is the mpe?
(d)What is the AE equation?
(e)Draw a picture of the AE curve.
(a)Fill in columns (2)and (4).
(b)What is the value of autonomous expenditures?
(c)What is the mpe?
(d)What is the AE equation?
(e)Draw a picture of the AE curve.
Unlock Deck
Unlock for access to all 38 flashcards in this deck.
Unlock Deck
k this deck
35
Suppose the multiplier model is
C = C0 + cYD
I = I0
G = G0
YD = Y + TR - tY
TR = TR0
Y = C + I + G
where C0 is autonomous consumption,c is the marginal propensity to expend,Y is income,C is consumption,YD is disposable income,I is investment,G is government expenditures,TR is transfer payments,and t is the income tax rate.Furthermore,C0,I0,G0 and TR0 are positive numbers and 0 < c < 1.In this version of the multiplier model,consumption spending is a function of disposable income (YD).Disposable income is defined as national income (Y)plus transfer payments (TR)and minus tax payments (tY).The tax rate is a constant,t,such that 0 < t < 1.Transfer payments are items like social security,Medicare,and welfare payments,and people who receive these payments can spend them like earned income.
(a)Derive the formula for equilibrium national income.
(b)Derive the multiplier for an increase in transfer payments from TR0 to TR1.
Unlock Deck
Unlock for access to all 38 flashcards in this deck.
Unlock Deck
k this deck
36
Consider the following multiplier model:
AE = 8,000 + 0.75Y,and potential output equals 35,000.
(1)Calculate equilibrium output.
(2)State what fiscal policy you would recommend to eliminate the inflationary or recessionary gap.
(3)Calculate the change in government spending required to eliminate the gap.
AE = 8,000 + 0.75Y,and potential output equals 35,000.
(1)Calculate equilibrium output.
(2)State what fiscal policy you would recommend to eliminate the inflationary or recessionary gap.
(3)Calculate the change in government spending required to eliminate the gap.
Unlock Deck
Unlock for access to all 38 flashcards in this deck.
Unlock Deck
k this deck
37
For each of the following state the level of autonomous expenditures and induced expenditures.
(a)Given the following table and income equals $200.
(b)Given the following expenditures function AE = $4,000 + 0.6Y and income equals $1,000.
(a)Given the following table and income equals $200.
(b)Given the following expenditures function AE = $4,000 + 0.6Y and income equals $1,000. Unlock Deck
Unlock for access to all 38 flashcards in this deck.
Unlock Deck
k this deck
38
Consider the following multiplier model diagram:
For each of the following,draw a picture to show what would happen to the equilibrium level of income in the economy.
(a)Consumer sentiment about the future improves resulting in an increase in autonomous consumption of 100.
(b)Foreign economic activity rises,which results in an increase in autonomous exports of 100.
(c)Because the average life span increases,many people are saving more of their income than ever before.Consequently the mpe falls from 0.75 to 0.66.
For each of the following,draw a picture to show what would happen to the equilibrium level of income in the economy.(a)Consumer sentiment about the future improves resulting in an increase in autonomous consumption of 100.
(b)Foreign economic activity rises,which results in an increase in autonomous exports of 100.
(c)Because the average life span increases,many people are saving more of their income than ever before.Consequently the mpe falls from 0.75 to 0.66.
Unlock Deck
Unlock for access to all 38 flashcards in this deck.
Unlock Deck
k this deck
Unlock Deck
Unlock for access to all 38 flashcards in this deck.


