Deck 20: Nonparametric Tests
Full screen (f)
Question
Question
Question
Question
Question
Question
Question
Question
Question
The test statistic for the sign test is  ,where:
A) is the sample proportion of plus signs
B) is the sample proportion of minus signs
C) is the sample mean of plus signs
D)
,where:A)
is the sample proportion of plus signsB)
is the sample proportion of minus signsC)
is the sample mean of plus signsD)
Question
If n ≥ 10,the Spearman rank correlation coefficient can be assumed to follow a normal distribution with:
A)µ = 0 and .
.
B)µ = 1 and .
.
C)µ = 0 and .
.
D)µ = 0 and
A)µ = 0 and
.B)µ = 1 and
.C)µ = 0 and
.D)µ = 0 and
Question
Question
Question
Question
Question
Question
Question
Question
Question
Question
For the Wilcoxon rank-sum test with the sample sizes being at least 10,the test statistic can be assumed to follow a normal distribution with mean:
A)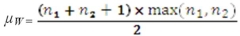
B)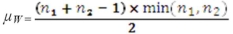
C)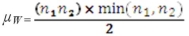
D)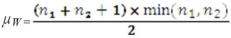
A)
B)
C)
D)
Question
Exhibit 20.1.A pawn shop claims to sell used Kindles for about the same price as Amazon or eBay.Both online retailers sell used Kindles for around $150.Below are recent Kindle sales prices for the pawn shop. 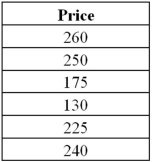 Refer to Exhibit 20.1.Specify the competing hypotheses to determine if the median sale price is greater than $150.
A)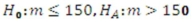
B)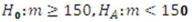
C)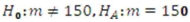
D)
Refer to Exhibit 20.1.Specify the competing hypotheses to determine if the median sale price is greater than $150.A)
B)
C)
D)
Question
Exhibit 20.1.A pawn shop claims to sell used Kindles for about the same price as Amazon or eBay.Both online retailers sell used Kindles for around $150.Below are recent Kindle sales prices for the pawn shop.  Refer to Exhibit 20.1.Using the critical value approach,the appropriate conclusion is:
A)Reject the null hypothesis;conclude the median sale price is greater than $150
B)Do not reject the null hypothesis,cannot conclude the median sale price is greater than $150
C)Reject the null hypothesis,cannot conclude the median sale price is greater than $150
D)Do not reject the null hypothesis,conclude the median sale price is greater than $150
Refer to Exhibit 20.1.Using the critical value approach,the appropriate conclusion is:A)Reject the null hypothesis;conclude the median sale price is greater than $150
B)Do not reject the null hypothesis,cannot conclude the median sale price is greater than $150
C)Reject the null hypothesis,cannot conclude the median sale price is greater than $150
D)Do not reject the null hypothesis,conclude the median sale price is greater than $150
Question
Exhibit 20.2.A trading magazine wants to determine the number of hours stock brokers work each week.In particular,the trading magazine wants to determine if the median numbers worked per week differs from 100 hours.The magazine samples 18 traders.For the Wilcoxon Signed-Rank Test,the value of the test statistic is  . Refer to Exhibit 20.2.Since the sample size is at least 10,T can be assumed normally distributed with mean and standard deviation:
A)85.50,527.25
B)22.96,527.25
C)22.96,85.50
D)85.50,22.96
. Refer to Exhibit 20.2.Since the sample size is at least 10,T can be assumed normally distributed with mean and standard deviation:A)85.50,527.25
B)22.96,527.25
C)22.96,85.50
D)85.50,22.96
Question
Exhibit 20.3.A company which produces financial accounting software wants to offer better training to its customers.The training is intended to decrease the amount of time required to do complicated accounting calculations.For seven individuals,the amount of time (in minutes)to complete a complicated calculation is determined before and after completing the new training.  Refer to Exhibit 20.3.The value of the test statistic is:
A)5
B)23
C)7
D)13
Refer to Exhibit 20.3.The value of the test statistic is:A)5
B)23
C)7
D)13
Question
Exhibit 20.1.A pawn shop claims to sell used Kindles for about the same price as Amazon or eBay.Both online retailers sell used Kindles for around $150.Below are recent Kindle sales prices for the pawn shop.  Refer to Exhibit 20.1.Using the p-value approach and
  ,the appropriate conclusion is:
A)Reject the null hypothesis,cannot conclude the median sale price is greater than $150
B)Do not reject the null hypothesis,cannot conclude the median sale price is greater than $150
C)Do not reject the null hypothesis,conclude the median sale price is greater than $150
D)Reject the null hypothesis,conclude the median sale price is greater than $150
Refer to Exhibit 20.1.Using the p-value approach and ,the appropriate conclusion is:A)Reject the null hypothesis,cannot conclude the median sale price is greater than $150
B)Do not reject the null hypothesis,cannot conclude the median sale price is greater than $150
C)Do not reject the null hypothesis,conclude the median sale price is greater than $150
D)Reject the null hypothesis,conclude the median sale price is greater than $150
Question
Exhibit 20.3.A company which produces financial accounting software wants to offer better training to its customers.The training is intended to decrease the amount of time required to do complicated accounting calculations.For seven individuals,the amount of time (in minutes)to complete a complicated calculation is determined before and after completing the new training.  Refer to Exhibit 20.3.Using the p-value approach and
  ,the appropriate conclusion is:
A)Do not reject the null hypothesis,cannot conclude the median difference of the times is greater than zero
B)Do not reject the null hypothesis,conclude the median difference of the times is greater than zero
C)Reject the null hypothesis,cannot conclude the median difference of the times is greater than zero
D)Reject the null hypothesis,conclude the median difference of the times is greater than zero
Refer to Exhibit 20.3.Using the p-value approach and ,the appropriate conclusion is:A)Do not reject the null hypothesis,cannot conclude the median difference of the times is greater than zero
B)Do not reject the null hypothesis,conclude the median difference of the times is greater than zero
C)Reject the null hypothesis,cannot conclude the median difference of the times is greater than zero
D)Reject the null hypothesis,conclude the median difference of the times is greater than zero
Question
Exhibit 20.3.A company which produces financial accounting software wants to offer better training to its customers.The training is intended to decrease the amount of time required to do complicated accounting calculations.For seven individuals,the amount of time (in minutes)to complete a complicated calculation is determined before and after completing the new training.  Refer to Exhibit 20.3.The p-value for the test is:
A)Less than 0.01
B)Between 0.01 and 0.025
C)Between 0.025 and 0.05
D)Greater than 0.05
Refer to Exhibit 20.3.The p-value for the test is:A)Less than 0.01
B)Between 0.01 and 0.025
C)Between 0.025 and 0.05
D)Greater than 0.05
Question
Exhibit 20.3.A company which produces financial accounting software wants to offer better training to its customers.The training is intended to decrease the amount of time required to do complicated accounting calculations.For seven individuals,the amount of time (in minutes)to complete a complicated calculation is determined before and after completing the new training.  Refer to Exhibit 20.3.At the 5% significance level,the critical value is:
A)25
B)3
C)2
D)26
Refer to Exhibit 20.3.At the 5% significance level,the critical value is:A)25
B)3
C)2
D)26
Question
Exhibit 20.3.A company which produces financial accounting software wants to offer better training to its customers.The training is intended to decrease the amount of time required to do complicated accounting calculations.For seven individuals,the amount of time (in minutes)to complete a complicated calculation is determined before and after completing the new training.  Refer to Exhibit 20.3.Using the critical value approach,appropriate conclusion is:
A)Reject the null hypothesis,cannot conclude the median difference of the times is greater than zero
B)Reject the null hypothesis,conclude the median difference of the times is greater than zero
C)Do not reject the null hypothesis,cannot conclude the median difference of the times is greater than zero
D)Do not reject the null hypothesis,conclude the median difference of the times is greater than zero
Refer to Exhibit 20.3.Using the critical value approach,appropriate conclusion is:A)Reject the null hypothesis,cannot conclude the median difference of the times is greater than zero
B)Reject the null hypothesis,conclude the median difference of the times is greater than zero
C)Do not reject the null hypothesis,cannot conclude the median difference of the times is greater than zero
D)Do not reject the null hypothesis,conclude the median difference of the times is greater than zero
Question
Exhibit 20.2.A trading magazine wants to determine the number of hours stock brokers work each week.In particular,the trading magazine wants to determine if the median numbers worked per week differs from 100 hours.The magazine samples 18 traders.For the Wilcoxon Signed-Rank Test,the value of the test statistic is  . Refer to Exhibit 20.2.At the 1% significance level,the right-tail critical value is:
A)1.645
B)1.96
C)2.33
D)2.575
. Refer to Exhibit 20.2.At the 1% significance level,the right-tail critical value is:A)1.645
B)1.96
C)2.33
D)2.575
Question
Exhibit 20.1.A pawn shop claims to sell used Kindles for about the same price as Amazon or eBay.Both online retailers sell used Kindles for around $150.Below are recent Kindle sales prices for the pawn shop. 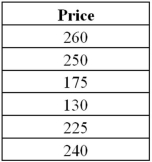 Refer to Exhibit 20.1.What is the value of the test statistic?
A)6
B)14
C)20
D)1
Refer to Exhibit 20.1.What is the value of the test statistic?A)6
B)14
C)20
D)1
Question
Exhibit 20.2.A trading magazine wants to determine the number of hours stock brokers work each week.In particular,the trading magazine wants to determine if the median numbers worked per week differs from 100 hours.The magazine samples 18 traders.For the Wilcoxon Signed-Rank Test,the value of the test statistic is  . Refer to Exhibit 20.2.Using the p-value approach and
  ,the appropriate conclusion is:
A)Reject the null hypothesis,conclude the median number of hours worked per week differs from 100
B)Reject the null hypothesis,cannot conclude the median number of hours worked per week differs from 100
C)Reject the null hypothesis,conclude the median number of hours worked per week is greater than 100
D)Reject the null hypothesis,cannot conclude the median number of hours worked per week is less 100
. Refer to Exhibit 20.2.Using the p-value approach and ,the appropriate conclusion is:A)Reject the null hypothesis,conclude the median number of hours worked per week differs from 100
B)Reject the null hypothesis,cannot conclude the median number of hours worked per week differs from 100
C)Reject the null hypothesis,conclude the median number of hours worked per week is greater than 100
D)Reject the null hypothesis,cannot conclude the median number of hours worked per week is less 100
Question
Exhibit 20.1.A pawn shop claims to sell used Kindles for about the same price as Amazon or eBay.Both online retailers sell used Kindles for around $150.Below are recent Kindle sales prices for the pawn shop.  Refer to Exhibit 20.1.At the 5% significance level,the critical value is:
A)2
B)19
C)0
D)28
Refer to Exhibit 20.1.At the 5% significance level,the critical value is:A)2
B)19
C)0
D)28
Question
Exhibit 20.3.A company which produces financial accounting software wants to offer better training to its customers.The training is intended to decrease the amount of time required to do complicated accounting calculations.For seven individuals,the amount of time (in minutes)to complete a complicated calculation is determined before and after completing the new training. 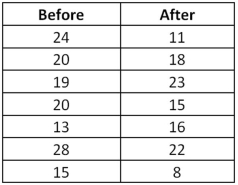 Refer to Exhibit 20.3.For the Wilcoxon signed-rank test,the competing hypotheses are:
A)
B)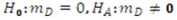
C)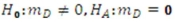
D)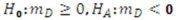
Refer to Exhibit 20.3.For the Wilcoxon signed-rank test,the competing hypotheses are:A)
B)
C)
D)
Question
Exhibit 20.1.A pawn shop claims to sell used Kindles for about the same price as Amazon or eBay.Both online retailers sell used Kindles for around $150.Below are recent Kindle sales prices for the pawn shop.  Refer to Exhibit 20.1.The p-value for the test is:
A)Less than 0.01
B)Between 0.025 and 0.01
C)Between 0.05 and 0.025
D)Greater than 0.05
Refer to Exhibit 20.1.The p-value for the test is:A)Less than 0.01
B)Between 0.025 and 0.01
C)Between 0.05 and 0.025
D)Greater than 0.05
Question
Exhibit 20.4.Investment institutions usually have funds with different risk vs.reward prospectuses.A trading magazine wants to determine if the returns of high risk funds is greater than low risk funds.The magazine records the return of high and low risk funds for a sample of 22 institutions.For the Wilcoxon signed-rank test,where D = high risk return - low risk return,the value of the test statistic is  . Refer to Exhibit 20.4.For the Wilcoxon signed-rank test,the competing hypotheses are:
A)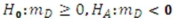
B)
C)
D)
. Refer to Exhibit 20.4.For the Wilcoxon signed-rank test,the competing hypotheses are:A)
B)
C)
D)
Question
Exhibit 20.2.A trading magazine wants to determine the number of hours stock brokers work each week.In particular,the trading magazine wants to determine if the median numbers worked per week differs from 100 hours.The magazine samples 18 traders.For the Wilcoxon Signed-Rank Test,the value of the test statistic is  . Refer to Exhibit 20.2.Specify the competing hypotheses in order to determine if the median number of hours worked per week differs from 100 hours.
A)
B)
C)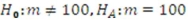
D)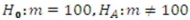
. Refer to Exhibit 20.2.Specify the competing hypotheses in order to determine if the median number of hours worked per week differs from 100 hours.A)
B)
C)
D)
Question
Exhibit 20.2.A trading magazine wants to determine the number of hours stock brokers work each week.In particular,the trading magazine wants to determine if the median numbers worked per week differs from 100 hours.The magazine samples 18 traders.For the Wilcoxon Signed-Rank Test,the value of the test statistic is  . Refer to Exhibit 20.2.Using the critical value approach,the appropriate conclusion is:
A)Reject the null hypothesis,cannot conclude the median number of hours worked per week differs from 100
B)Reject the null hypothesis,conclude the median number of hours worked per week is greater than 100
C)Reject the null hypothesis,cannot conclude the median number of hours worked per week is less 100
D)Reject the null hypothesis,conclude the median number of hours worked per week differs from 100
. Refer to Exhibit 20.2.Using the critical value approach,the appropriate conclusion is:A)Reject the null hypothesis,cannot conclude the median number of hours worked per week differs from 100
B)Reject the null hypothesis,conclude the median number of hours worked per week is greater than 100
C)Reject the null hypothesis,cannot conclude the median number of hours worked per week is less 100
D)Reject the null hypothesis,conclude the median number of hours worked per week differs from 100
Question
Exhibit 20.2.A trading magazine wants to determine the number of hours stock brokers work each week.In particular,the trading magazine wants to determine if the median numbers worked per week differs from 100 hours.The magazine samples 18 traders.For the Wilcoxon Signed-Rank Test,the value of the test statistic is  . Refer to Exhibit 20.2.The p-value for the test is:
A)0.0016
B)0.0032
C)0.9984
D)0
. Refer to Exhibit 20.2.The p-value for the test is:A)0.0016
B)0.0032
C)0.9984
D)0
Question
Exhibit 20.2.A trading magazine wants to determine the number of hours stock brokers work each week.In particular,the trading magazine wants to determine if the median numbers worked per week differs from 100 hours.The magazine samples 18 traders.For the Wilcoxon Signed-Rank Test,the value of the test statistic is  . Refer to Exhibit 20.2.If T is assumed to follow a normal distribution,the value of the test statistic is:
A)153
B)2.94
C)0.128
D)-2.94
. Refer to Exhibit 20.2.If T is assumed to follow a normal distribution,the value of the test statistic is:A)153
B)2.94
C)0.128
D)-2.94
Question
Exhibit 20.4.Investment institutions usually have funds with different risk vs.reward prospectuses.A trading magazine wants to determine if the returns of high risk funds is greater than low risk funds.The magazine records the return of high and low risk funds for a sample of 22 institutions.For the Wilcoxon signed-rank test,where D = high risk return - low risk return,the value of the test statistic is  . Refer to Exhibit 20.4.The p-value for the test is:
A)Greater than 0.10
B)Between 0.10 and 0.05
C)Between 0.05 and 0.01
D)Less than 0.01
. Refer to Exhibit 20.4.The p-value for the test is:A)Greater than 0.10
B)Between 0.10 and 0.05
C)Between 0.05 and 0.01
D)Less than 0.01
Question
Exhibit 20.6.A fund manager wants to know if the annual rate of return is greater for growth stocks (1)than value stocks (2).The fund manager collects data on the returns of growth and value funds.Below are the sample sizes and rank sums for the Wilcoxon rank-sum test.  Refer to Exhibit 20.6.The value of W is:
A)215
B)9870
C)13350
D)23200
Refer to Exhibit 20.6.The value of W is:A)215
B)9870
C)13350
D)23200
Question
Exhibit 20.5.An accountant wants to know if the property taxes paid by clients that live in the city are different from those that live in the county.The property taxes paid by five clients from the city (1)and five clients from the county (2)are shown below (in dollars).  Refer to Exhibit 20.5.To determine if whether the medians of the taxes paid differ using the Wilcoxon rank-sum test,the competing hypotheses are:
A)
B)
C)
D)
Refer to Exhibit 20.5.To determine if whether the medians of the taxes paid differ using the Wilcoxon rank-sum test,the competing hypotheses are:A)
B)
C)
D)
Question
Exhibit 20.4.Investment institutions usually have funds with different risk vs.reward prospectuses.A trading magazine wants to determine if the returns of high risk funds is greater than low risk funds.The magazine records the return of high and low risk funds for a sample of 22 institutions.For the Wilcoxon signed-rank test,where D = high risk return - low risk return,the value of the test statistic is  . Refer to Exhibit 20.4.Using the p-value approach and
  ,the appropriate conclusion is:
A)Reject the null hypothesis,conclude the median difference of the returns is greater than zero
B)Reject the null hypothesis,cannot conclude the median difference of the returns is greater than zero
C)Do no reject the null hypothesis,cannot conclude the median difference of the returns is greater than zero
D)Do not reject the null hypothesis,conclude the median difference of the returns is greater than zero
. Refer to Exhibit 20.4.Using the p-value approach and ,the appropriate conclusion is:A)Reject the null hypothesis,conclude the median difference of the returns is greater than zero
B)Reject the null hypothesis,cannot conclude the median difference of the returns is greater than zero
C)Do no reject the null hypothesis,cannot conclude the median difference of the returns is greater than zero
D)Do not reject the null hypothesis,conclude the median difference of the returns is greater than zero
Question
Exhibit 20.5.An accountant wants to know if the property taxes paid by clients that live in the city are different from those that live in the county.The property taxes paid by five clients from the city (1)and five clients from the county (2)are shown below (in dollars).  Refer to Exhibit 20.5.At the 5% significance level,the critical values are:
A)18 and 37
B)19 and 36
C)18 and 36
D)19 and 37
Refer to Exhibit 20.5.At the 5% significance level,the critical values are:A)18 and 37
B)19 and 36
C)18 and 36
D)19 and 37
Question
Exhibit 20.7.A marketing firm needs to replace its existing network provider,and is considering three different providers.A primary consideration is the amount of system down time.The following table contains the amount of network down-time (in hours)for the last five months for each network provider.  Refer to Exhibit 20.7.The test statistic value is:
A)7.8
B)13.0
C)3.2
D)12.02
Refer to Exhibit 20.7.The test statistic value is:A)7.8
B)13.0
C)3.2
D)12.02
Question
Exhibit 20.4.Investment institutions usually have funds with different risk vs.reward prospectuses.A trading magazine wants to determine if the returns of high risk funds is greater than low risk funds.The magazine records the return of high and low risk funds for a sample of 22 institutions.For the Wilcoxon signed-rank test,where D = high risk return - low risk return,the value of the test statistic is  . Refer to Exhibit 20.4.Assuming that T follows a normal distribution,the value of the test statistic is
A)0.062
B)-1.899
C)185
D)1.899
. Refer to Exhibit 20.4.Assuming that T follows a normal distribution,the value of the test statistic isA)0.062
B)-1.899
C)185
D)1.899
Question
Exhibit 20.5.An accountant wants to know if the property taxes paid by clients that live in the city are different from those that live in the county.The property taxes paid by five clients from the city (1)and five clients from the county (2)are shown below (in dollars). 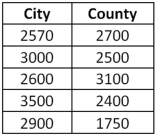 Refer to Exhibit 20.5.The value of the test statistic is:
A)10
B)21
C)34
D)55
Refer to Exhibit 20.5.The value of the test statistic is:A)10
B)21
C)34
D)55
Question
Exhibit 20.6.A fund manager wants to know if the annual rate of return is greater for growth stocks (1)than value stocks (2).The fund manager collects data on the returns of growth and value funds.Below are the sample sizes and rank sums for the Wilcoxon rank-sum test. 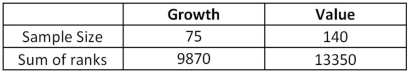 Refer to Exhibit 20.6.Using the critical value approach,the appropriate conclusion is:
A)Reject the null hypothesis,conclude the median return of growth stock is greater than the median return of value stocks
B)Reject the null hypothesis,conclude the median return of value stock is greater than the median return of growth stocks
C)Reject the null hypothesis,conclude the median return of growth stock differs from the median return of value stocks
D)Reject the null hypothesis,cannot conclude the median return of growth stocks is greater than the median return of value stocks
Refer to Exhibit 20.6.Using the critical value approach,the appropriate conclusion is:A)Reject the null hypothesis,conclude the median return of growth stock is greater than the median return of value stocks
B)Reject the null hypothesis,conclude the median return of value stock is greater than the median return of growth stocks
C)Reject the null hypothesis,conclude the median return of growth stock differs from the median return of value stocks
D)Reject the null hypothesis,cannot conclude the median return of growth stocks is greater than the median return of value stocks
Question
Exhibit 20.6.A fund manager wants to know if the annual rate of return is greater for growth stocks (1)than value stocks (2).The fund manager collects data on the returns of growth and value funds.Below are the sample sizes and rank sums for the Wilcoxon rank-sum test.  Refer to Exhibit 20.6.The p-value for the test is:
A)Greater than 0.10
B)Between 0.10 and 0.05
C)Between 0.05 and 0.01
D)Less than 0.01
Refer to Exhibit 20.6.The p-value for the test is:A)Greater than 0.10
B)Between 0.10 and 0.05
C)Between 0.05 and 0.01
D)Less than 0.01
Question
Exhibit 20.6.A fund manager wants to know if the annual rate of return is greater for growth stocks (1)than value stocks (2).The fund manager collects data on the returns of growth and value funds.Below are the sample sizes and rank sums for the Wilcoxon rank-sum test.  Refer to Exhibit 20.6.At the 1% significance level,the critical value is:
A)1.645
B)1.96
C)2.33
D)2.575
Refer to Exhibit 20.6.At the 1% significance level,the critical value is:A)1.645
B)1.96
C)2.33
D)2.575
Question
Exhibit 20.4.Investment institutions usually have funds with different risk vs.reward prospectuses.A trading magazine wants to determine if the returns of high risk funds is greater than low risk funds.The magazine records the return of high and low risk funds for a sample of 22 institutions.For the Wilcoxon signed-rank test,where D = high risk return - low risk return,the value of the test statistic is  . Refer to Exhibit 20.4.Using the critical value approach,appropriate conclusion is:
A)Reject the null hypothesis,cannot conclude the median difference of the returns is greater than zero
B)Do no reject the null hypothesis,cannot conclude the median difference of the returns is greater than zero
C)Reject the null hypothesis,conclude the median difference of the returns is greater than zero
D)Do not reject the null hypothesis,conclude the median difference of the returns is greater than zero
. Refer to Exhibit 20.4.Using the critical value approach,appropriate conclusion is:A)Reject the null hypothesis,cannot conclude the median difference of the returns is greater than zero
B)Do no reject the null hypothesis,cannot conclude the median difference of the returns is greater than zero
C)Reject the null hypothesis,conclude the median difference of the returns is greater than zero
D)Do not reject the null hypothesis,conclude the median difference of the returns is greater than zero
Question
Exhibit 20.4.Investment institutions usually have funds with different risk vs.reward prospectuses.A trading magazine wants to determine if the returns of high risk funds is greater than low risk funds.The magazine records the return of high and low risk funds for a sample of 22 institutions.For the Wilcoxon signed-rank test,where D = high risk return - low risk return,the value of the test statistic is  . Refer to Exhibit 20.4.At the 10% significance level,the critical value is:
A)1.645
B)1.96
C)2.33
D)2.575
. Refer to Exhibit 20.4.At the 10% significance level,the critical value is:A)1.645
B)1.96
C)2.33
D)2.575
Question
Exhibit 20.7.A marketing firm needs to replace its existing network provider,and is considering three different providers.A primary consideration is the amount of system down time.The following table contains the amount of network down-time (in hours)for the last five months for each network provider.  Refer to Exhibit 20.7.For the Kruskal-Wallis test,the competing hypotheses are:
A)
B)
C)
D)
Refer to Exhibit 20.7.For the Kruskal-Wallis test,the competing hypotheses are:A)
B)
C)
D)
Question
Exhibit 20.6.A fund manager wants to know if the annual rate of return is greater for growth stocks (1)than value stocks (2).The fund manager collects data on the returns of growth and value funds.Below are the sample sizes and rank sums for the Wilcoxon rank-sum test.  Refer to Exhibit 20.6.Since both sample sizes are at least 10,W can be assumed to follow a normal distribution with a mean and standard deviation of:
A)434.74 and 8100
B)8100 and 434.74
C)8100 and 189000
D)189000 and 8100
Refer to Exhibit 20.6.Since both sample sizes are at least 10,W can be assumed to follow a normal distribution with a mean and standard deviation of:A)434.74 and 8100
B)8100 and 434.74
C)8100 and 189000
D)189000 and 8100
Question
Exhibit 20.6.A fund manager wants to know if the annual rate of return is greater for growth stocks (1)than value stocks (2).The fund manager collects data on the returns of growth and value funds.Below are the sample sizes and rank sums for the Wilcoxon rank-sum test.  Refer to Exhibit 20.6.Assuming that W follows a normal distribution,the value of the test statistic is
A)4.07
B)-4.07
C)-12.07
D)12.07
Refer to Exhibit 20.6.Assuming that W follows a normal distribution,the value of the test statistic isA)4.07
B)-4.07
C)-12.07
D)12.07
Question
Exhibit 20.6.A fund manager wants to know if the annual rate of return is greater for growth stocks (1)than value stocks (2).The fund manager collects data on the returns of growth and value funds.Below are the sample sizes and rank sums for the Wilcoxon rank-sum test.  Refer to Exhibit 20.6.Using the p-value approach and
  ,the appropriate conclusion is:
A)Reject the null hypothesis,conclude the median return of value stock is greater than the median return of growth stocks
B)Reject the null hypothesis,conclude the median return of growth stock differs from the median return of value stocks
C)Reject the null hypothesis,conclude the median return of growth stock is greater than the median return of value stocks
D)Reject the null hypothesis,cannot conclude the median return of growth stocks is greater than the median return of value stocks
Refer to Exhibit 20.6.Using the p-value approach and ,the appropriate conclusion is:A)Reject the null hypothesis,conclude the median return of value stock is greater than the median return of growth stocks
B)Reject the null hypothesis,conclude the median return of growth stock differs from the median return of value stocks
C)Reject the null hypothesis,conclude the median return of growth stock is greater than the median return of value stocks
D)Reject the null hypothesis,cannot conclude the median return of growth stocks is greater than the median return of value stocks
Question
Exhibit 20.5.An accountant wants to know if the property taxes paid by clients that live in the city are different from those that live in the county.The property taxes paid by five clients from the city (1)and five clients from the county (2)are shown below (in dollars).  Refer to Exhibit 20.5.Using the critical value approach,the appropriate conclusion is:
A)Reject the null hypothesis,cannot conclude the median taxes paid in the city differs from the median taxes paid in the county
B)Do not reject the null hypothesis,conclude the median taxes paid in the city differs from the median taxes paid in the county
C)Reject the null hypothesis,conclude the median taxes paid in the city differs from the median taxes paid in the county
D)Do not reject the null hypothesis,cannot conclude the median taxes paid in the city differs from the median taxes paid in the county
Refer to Exhibit 20.5.Using the critical value approach,the appropriate conclusion is:A)Reject the null hypothesis,cannot conclude the median taxes paid in the city differs from the median taxes paid in the county
B)Do not reject the null hypothesis,conclude the median taxes paid in the city differs from the median taxes paid in the county
C)Reject the null hypothesis,conclude the median taxes paid in the city differs from the median taxes paid in the county
D)Do not reject the null hypothesis,cannot conclude the median taxes paid in the city differs from the median taxes paid in the county
Question
Exhibit 20.6.A fund manager wants to know if the annual rate of return is greater for growth stocks (1)than value stocks (2).The fund manager collects data on the returns of growth and value funds.Below are the sample sizes and rank sums for the Wilcoxon rank-sum test.  Refer to Exhibit 20.6.To determine whether the median return of growth funds is larger than the median return of value funds,the competing hypotheses are:
A)
B)
C)
D)
Refer to Exhibit 20.6.To determine whether the median return of growth funds is larger than the median return of value funds,the competing hypotheses are:A)
B)
C)
D)
Question
Exhibit 20.4.Investment institutions usually have funds with different risk vs.reward prospectuses.A trading magazine wants to determine if the returns of high risk funds is greater than low risk funds.The magazine records the return of high and low risk funds for a sample of 22 institutions.For the Wilcoxon signed-rank test,where D = high risk return - low risk return,the value of the test statistic is  . Refer to Exhibit 20.4 Since the sample size is at least 10,T can be assumed to follow the normal distribution with mean and standard deviation:
A)126.5 and 30.80
B)30.80 and 126.5
C)125.5 and 948.75
D)30.80 and 984.75
. Refer to Exhibit 20.4 Since the sample size is at least 10,T can be assumed to follow the normal distribution with mean and standard deviation:A)126.5 and 30.80
B)30.80 and 126.5
C)125.5 and 948.75
D)30.80 and 984.75
Question
Exhibit 20.9.A shipping company believes there is a linear association between the weight of packages shipped and the cost.The following table shows the weight (in pounds)and cost (in dollars)of the last 7 packages shipped. 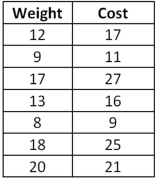 Refer to Exhibit 20.9.Using the critical value approach,the appropriate conclusion is:
A)Do not reject the null hypothesis,conclude weight and cost are correlated
B)Do not reject the null hypothesis,cannot conclude the is different from zero
C)Reject the null hypothesis,cannot conclude the correlation coefficient is different from zero
D)Reject the null hypothesis,conclude weight and cost are correlated
Refer to Exhibit 20.9.Using the critical value approach,the appropriate conclusion is:A)Do not reject the null hypothesis,conclude weight and cost are correlated
B)Do not reject the null hypothesis,cannot conclude the is different from zero
C)Reject the null hypothesis,cannot conclude the correlation coefficient is different from zero
D)Reject the null hypothesis,conclude weight and cost are correlated
Question
Exhibit 20.8.A sports agent wants to understand the differences in the annual earnings of players in different sports.The below table shows the annual earnings (in million dollars)of 52 athletes.For the Kruskal-Wallis test,the rank sums for each group are at the bottom of the table. 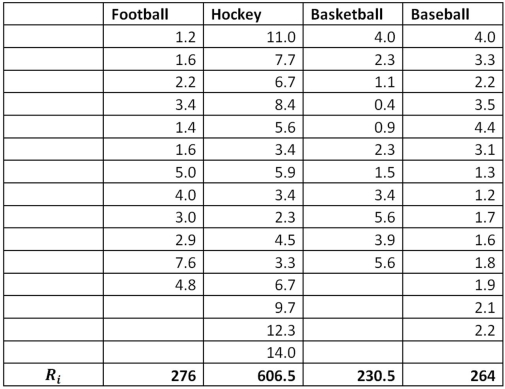 Refer to Exhibit 20.8.The test statistic value is:
A)18.29
B)21.0
C)23.3
D)40.6
Refer to Exhibit 20.8.The test statistic value is:A)18.29
B)21.0
C)23.3
D)40.6
Question
Exhibit 20.10.SHY (NYSEARCA: SHY)is a 1-3 year Treasury bond fund which is considered to be a market neutral position.Using the S&P 500 as a benchmark and five years of monthly log-return data,the rank correlation coefficient of SHY with the S&P 500 is found to be  . Refer to Exhibit 20.10.To determine if the SHY is not a market neutral position,the competing hypothesis are:
A)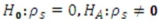
B)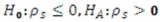
C)
D)
. Refer to Exhibit 20.10.To determine if the SHY is not a market neutral position,the competing hypothesis are:A)
B)
C)
D)
Question
Exhibit 20.9.A shipping company believes there is a linear association between the weight of packages shipped and the cost.The following table shows the weight (in pounds)and cost (in dollars)of the last 7 packages shipped.  Refer to Exhibit 20.9.To determine if the weights and costs are significantly correlated,the competing hypothesis is:
A)
B)
C)
D)
Refer to Exhibit 20.9.To determine if the weights and costs are significantly correlated,the competing hypothesis is:A)
B)
C)
D)
Question
Exhibit 20.8.A sports agent wants to understand the differences in the annual earnings of players in different sports.The below table shows the annual earnings (in million dollars)of 52 athletes.For the Kruskal-Wallis test,the rank sums for each group are at the bottom of the table.  Refer to Exhibit 20.8.The p-value for the test is:
A)Greater than 0.10
B)Between 0.05 and 0.10
C)Between 0.01 and 0.05
D)Less than 0.01
Refer to Exhibit 20.8.The p-value for the test is:A)Greater than 0.10
B)Between 0.05 and 0.10
C)Between 0.01 and 0.05
D)Less than 0.01
Question
Exhibit 20.7.A marketing firm needs to replace its existing network provider,and is considering three different providers.A primary consideration is the amount of system down time.The following table contains the amount of network down-time (in hours)for the last five months for each network provider.  Refer to Exhibit 20.7.At the 5% significance level,the critical value is
A)4.605
B)5.991
C)7.378
D)9.21
Refer to Exhibit 20.7.At the 5% significance level,the critical value isA)4.605
B)5.991
C)7.378
D)9.21
Question
Exhibit 20.11.A wine magazine wants to know if chefs can tell the difference between duck liver pate and wet dog food.Eighteen chefs were asked to rate both the pate and dog food on a scale from 1 to 5,with 1 corresponding to "inedible" and 5 to "very tasty".The results are shown in the following table. 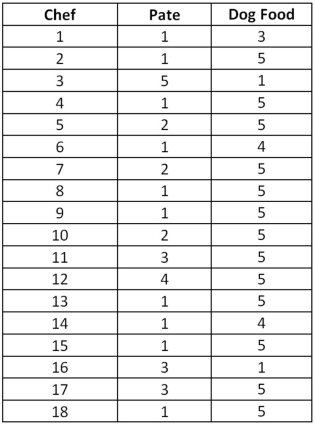 Refer to Exhibit 20.11.The estimate of the population proportion of plus signs is:
A)0.944
B)0.50
C)0.056
D)None of the above
Refer to Exhibit 20.11.The estimate of the population proportion of plus signs is:A)0.944
B)0.50
C)0.056
D)None of the above
Question
Exhibit 20.7.A marketing firm needs to replace its existing network provider,and is considering three different providers.A primary consideration is the amount of system down time.The following table contains the amount of network down-time (in hours)for the last five months for each network provider. 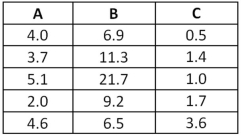 Refer to Exhibit 20.7.The p-value for the test is:
A)Less than 0.01
B)Between 0.01 and 0.05
C)Between 0.05 and 0.10
D)Greater than 0.10
Refer to Exhibit 20.7.The p-value for the test is:A)Less than 0.01
B)Between 0.01 and 0.05
C)Between 0.05 and 0.10
D)Greater than 0.10
Question
Exhibit 20.11.A wine magazine wants to know if chefs can tell the difference between duck liver pate and wet dog food.Eighteen chefs were asked to rate both the pate and dog food on a scale from 1 to 5,with 1 corresponding to "inedible" and 5 to "very tasty".The results are shown in the following table.  Refer to Exhibit 20.11.To determine if there are differences in preferences between pate and dog food using the sign test,the competing hypotheses are:
A)
B)
C)
D)
Refer to Exhibit 20.11.To determine if there are differences in preferences between pate and dog food using the sign test,the competing hypotheses are:A)
B)
C)
D)
Question
Exhibit 20.10.SHY (NYSEARCA: SHY)is a 1-3 year Treasury bond fund which is considered to be a market neutral position.Using the S&P 500 as a benchmark and five years of monthly log-return data,the rank correlation coefficient of SHY with the S&P 500 is found to be  . Refer to Exhibit 20.10.The p-value for the test is:
A)Less than 0.01
B)Between 0.01 and 0.05
C)Between 0.05 and 0.10
D)Greater than 0.10
. Refer to Exhibit 20.10.The p-value for the test is:A)Less than 0.01
B)Between 0.01 and 0.05
C)Between 0.05 and 0.10
D)Greater than 0.10
Question
Exhibit 20.10.SHY (NYSEARCA: SHY)is a 1-3 year Treasury bond fund which is considered to be a market neutral position.Using the S&P 500 as a benchmark and five years of monthly log-return data,the rank correlation coefficient of SHY with the S&P 500 is found to be  . Refer to Exhibit 20.10.Since the sample size is greater than 10 and
  can be assumed to follow a normal distribution,the value of the test statistic is
A)-2.20
B)-2.18
C)2.18
D)2.20
. Refer to Exhibit 20.10.Since the sample size is greater than 10 and can be assumed to follow a normal distribution,the value of the test statistic isA)-2.20
B)-2.18
C)2.18
D)2.20
Question
Exhibit 20.8.A sports agent wants to understand the differences in the annual earnings of players in different sports.The below table shows the annual earnings (in million dollars)of 52 athletes.For the Kruskal-Wallis test,the rank sums for each group are at the bottom of the table.  Refer to Exhibit 20.8.At the 1% significance level,the critical value is
A)11.345
B)9.348
C)7.815
D)6.251
Refer to Exhibit 20.8.At the 1% significance level,the critical value isA)11.345
B)9.348
C)7.815
D)6.251
Question
Exhibit 20.11.A wine magazine wants to know if chefs can tell the difference between duck liver pate and wet dog food.Eighteen chefs were asked to rate both the pate and dog food on a scale from 1 to 5,with 1 corresponding to "inedible" and 5 to "very tasty".The results are shown in the following table.  Refer to Exhibit 20.11.Assuming
  has the standard normal distribution,the value of the test statistic for the sign test is:
A)3.767
B)-3.767
C)0
D)None of the above
Refer to Exhibit 20.11.Assuming has the standard normal distribution,the value of the test statistic for the sign test is:A)3.767
B)-3.767
C)0
D)None of the above
Question
Exhibit 20.8.A sports agent wants to understand the differences in the annual earnings of players in different sports.The below table shows the annual earnings (in million dollars)of 52 athletes.For the Kruskal-Wallis test,the rank sums for each group are at the bottom of the table.  Refer to Exhibit 20.8.For the Kruskal-Wallis test,the competing hypotheses are:
A) ,
, 
B)
C) ,
, 
D)
Refer to Exhibit 20.8.For the Kruskal-Wallis test,the competing hypotheses are:A)
, B)
C)
, D)
Question
Exhibit 20.8.A sports agent wants to understand the differences in the annual earnings of players in different sports.The below table shows the annual earnings (in million dollars)of 52 athletes.For the Kruskal-Wallis test,the rank sums for each group are at the bottom of the table. 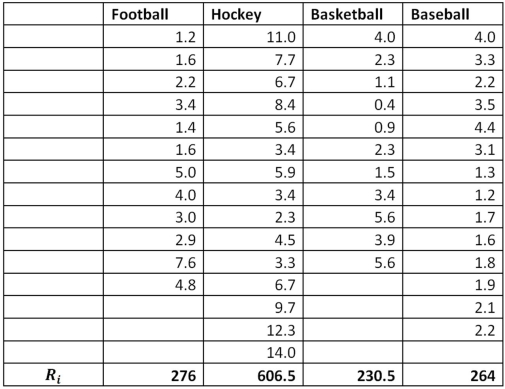 Refer to Exhibit 20.8.Using the p-value approach and
  ,the appropriate conclusion is:
A)Reject the null hypothesis,the annual salaries are not the same
B)Reject the null hypothesis,all median annual salaries are the same
C)Reject the null hypothesis,not all median annual salaries are the same
D)Reject the null hypothesis,cannot conclude all median annual salaries are not the same
Refer to Exhibit 20.8.Using the p-value approach and ,the appropriate conclusion is:A)Reject the null hypothesis,the annual salaries are not the same
B)Reject the null hypothesis,all median annual salaries are the same
C)Reject the null hypothesis,not all median annual salaries are the same
D)Reject the null hypothesis,cannot conclude all median annual salaries are not the same
Question
Exhibit 20.9.A shipping company believes there is a linear association between the weight of packages shipped and the cost.The following table shows the weight (in pounds)and cost (in dollars)of the last 7 packages shipped.  Refer to Exhibit 20.9.At the 10% significance level,the positive critical value is:
A)0.893
B)0.786
C)0.714
D)0.881
Refer to Exhibit 20.9.At the 10% significance level,the positive critical value is:A)0.893
B)0.786
C)0.714
D)0.881
Question
Exhibit 20.8.A sports agent wants to understand the differences in the annual earnings of players in different sports.The below table shows the annual earnings (in million dollars)of 52 athletes.For the Kruskal-Wallis test,the rank sums for each group are at the bottom of the table.  Refer to Exhibit 20.8.Using the critical value approach,the appropriate conclusion is:
A)Reject the null hypothesis,the annual earnings are not the same
B)Reject the null hypothesis,not all median annual earnings are the same
C)Reject the null hypothesis,all median annual earnings are the same
D)Reject the null hypothesis,cannot conclude all median annual earnings are not the same
Refer to Exhibit 20.8.Using the critical value approach,the appropriate conclusion is:A)Reject the null hypothesis,the annual earnings are not the same
B)Reject the null hypothesis,not all median annual earnings are the same
C)Reject the null hypothesis,all median annual earnings are the same
D)Reject the null hypothesis,cannot conclude all median annual earnings are not the same
Question
Exhibit 20.9.A shipping company believes there is a linear association between the weight of packages shipped and the cost.The following table shows the weight (in pounds)and cost (in dollars)of the last 7 packages shipped.  Refer to Exhibit 20.9.The Spearman rank correlation coefficient between weight and cost is:
A)0.960
B)0.811
C)0.820
D)0.897
Refer to Exhibit 20.9.The Spearman rank correlation coefficient between weight and cost is:A)0.960
B)0.811
C)0.820
D)0.897
Question
Exhibit 20.10.SHY (NYSEARCA: SHY)is a 1-3 year Treasury bond fund which is considered to be a market neutral position.Using the S&P 500 as a benchmark and five years of monthly log-return data,the rank correlation coefficient of SHY with the S&P 500 is found to be  . Refer to Exhibit 20.10.Using the p-value approach and
  ,the appropriate conclusion is:
A)Reject the null hypothesis,cannot conclude the correlation coefficient is not zero
B)Do not reject the null hypothesis,conclude the correlation coefficient is not zero
C)Reject the null hypothesis,conclude the correlation coefficient is not zero
D)Do not reject the null hypothesis,cannot conclude the correlation coefficient is not zero
. Refer to Exhibit 20.10.Using the p-value approach and ,the appropriate conclusion is:A)Reject the null hypothesis,cannot conclude the correlation coefficient is not zero
B)Do not reject the null hypothesis,conclude the correlation coefficient is not zero
C)Reject the null hypothesis,conclude the correlation coefficient is not zero
D)Do not reject the null hypothesis,cannot conclude the correlation coefficient is not zero
Question
Exhibit 20.10.SHY (NYSEARCA: SHY)is a 1-3 year Treasury bond fund which is considered to be a market neutral position.Using the S&P 500 as a benchmark and five years of monthly log-return data,the rank correlation coefficient of SHY with the S&P 500 is found to be  . Refer to Exhibit 20.10.Since the sample size is greater than 10,
  can be assumed to follow a normal distribution with standard deviation:
A)0
B)0.129
C)0.130
D)1
. Refer to Exhibit 20.10.Since the sample size is greater than 10, can be assumed to follow a normal distribution with standard deviation:A)0
B)0.129
C)0.130
D)1

Unlock Deck
Sign up to unlock the cards in this deck!
Unlock Deck
Unlock Deck
1/99
Play
Full screen (f)
Deck 20: Nonparametric Tests
1
For ni ≥ 5,the test statistic,H,for the Kruskal-Wallis test is assumed to follow:
A)the standard normal distribution
B)the F distribution with k - 1 degrees of freedom in the numerator and denominator
C)the chi-square distribution with k - 1 degrees of freedom
D)the t distribution with k - 1 degrees of freedom
A)the standard normal distribution
B)the F distribution with k - 1 degrees of freedom in the numerator and denominator
C)the chi-square distribution with k - 1 degrees of freedom
D)the t distribution with k - 1 degrees of freedom
the chi-square distribution with k - 1 degrees of freedom
2
Parametric tests typically assume the underlying population to be normally distributed.
True
3
The nonparametric test for two population medians under independent sampling is known as:
A)Wilcoxon signed-rank test
B)Wilcoxon rank-sum test
C)Kruskal-Wallis test
D)Wald-Wolfowitz runs test
A)Wilcoxon signed-rank test
B)Wilcoxon rank-sum test
C)Kruskal-Wallis test
D)Wald-Wolfowitz runs test
Wilcoxon rank-sum test
4
The sign test on a matched-pairs sample is similar to the Wilcoxon signed-rank test but applied to ordinal data.
Unlock Deck
Unlock for access to all 99 flashcards in this deck.
Unlock Deck
k this deck
5
The nonparametric test for ordinal data under matched-pairs sampling is:
A)Wilcoxon signed-rank test
B)Wald-Wolfowitz runs test
C)The sign test
D)Spearman's rank correlation test
A)Wilcoxon signed-rank test
B)Wald-Wolfowitz runs test
C)The sign test
D)Spearman's rank correlation test
Unlock Deck
Unlock for access to all 99 flashcards in this deck.
Unlock Deck
k this deck
6
Nonparametric tests do not require a level of measurement as strong as is necessary for parametric tests.
Unlock Deck
Unlock for access to all 99 flashcards in this deck.
Unlock Deck
k this deck
7
The Wilcoxon signed-rank test for a population median does not assume anything about the distribution of the population.
Unlock Deck
Unlock for access to all 99 flashcards in this deck.
Unlock Deck
k this deck
8
The nonparametric test to determine if a sequence is random is:
A)Wilcoxon signed-rank test
B)Wald-Wolfowitz runs test
C)The sign test
D)Spearman's rank correlation test
A)Wilcoxon signed-rank test
B)Wald-Wolfowitz runs test
C)The sign test
D)Spearman's rank correlation test
Unlock Deck
Unlock for access to all 99 flashcards in this deck.
Unlock Deck
k this deck
9
The test statistic for the sign test is ,where:
A) is the sample proportion of plus signs
B) is the sample proportion of minus signs
C) is the sample mean of plus signs
D)
,where:A)
is the sample proportion of plus signsB)
is the sample proportion of minus signsC)
is the sample mean of plus signsD)
Unlock Deck
Unlock for access to all 99 flashcards in this deck.
Unlock Deck
k this deck
10
If n ≥ 10,the Spearman rank correlation coefficient can be assumed to follow a normal distribution with:
A)µ = 0 and .
B)µ = 1 and .
C)µ = 0 and .
D)µ = 0 and
A)µ = 0 and
.B)µ = 1 and
.C)µ = 0 and
.D)µ = 0 and
Unlock Deck
Unlock for access to all 99 flashcards in this deck.
Unlock Deck
k this deck
11
The Wilcoxon rank-sum test is used as a nonparametric counterpart to the matched-pairs t test.
Unlock Deck
Unlock for access to all 99 flashcards in this deck.
Unlock Deck
k this deck
12
The nonparametric test for the correlation between two variables is known as the:
A)Wilcoxon signed-rank test
B)Wilcoxon rank-sum test
C)Kruskal-Wallis test
D)Spearman's rank correlation test
A)Wilcoxon signed-rank test
B)Wilcoxon rank-sum test
C)Kruskal-Wallis test
D)Spearman's rank correlation test
Unlock Deck
Unlock for access to all 99 flashcards in this deck.
Unlock Deck
k this deck
13
The null hypothesis of the Wald-Wolfowitz runs test is the elements do not occur randomly.
Unlock Deck
Unlock for access to all 99 flashcards in this deck.
Unlock Deck
k this deck
14
Pearson's correlation coefficient is used as the nonparametric counterpart to the regular correlation coefficient formula.
Unlock Deck
Unlock for access to all 99 flashcards in this deck.
Unlock Deck
k this deck
15
The Kruskal-Wallis test is the nonparametric alternative to one-way ANOVA.
Unlock Deck
Unlock for access to all 99 flashcards in this deck.
Unlock Deck
k this deck
16
If the distributional assumptions of a parametric test are valid yet we choose to use a nonparametric test,the nonparametric test is more powerful.
Unlock Deck
Unlock for access to all 99 flashcards in this deck.
Unlock Deck
k this deck
17
For the Wilcoxon signed-rank test with n ≥ 10,the test statistic is assumed to follow a normal distribution with mean:
A)µT = 2n(2n + 1)/2
B)µT = n(n + 1)/4
C)µT = n(n - 1)/4
D)µT = n(2n + 1)/3
A)µT = 2n(2n + 1)/2
B)µT = n(n + 1)/4
C)µT = n(n - 1)/4
D)µT = n(2n + 1)/3
Unlock Deck
Unlock for access to all 99 flashcards in this deck.
Unlock Deck
k this deck
18
The nonparametric test for a single population median is known as the:
A)Wilcoxon signed-rank test
B)Wilcoxon rank-sum test
C)Kruskal-Wallis test
D)Wald-Wolfowitz runs test
A)Wilcoxon signed-rank test
B)Wilcoxon rank-sum test
C)Kruskal-Wallis test
D)Wald-Wolfowitz runs test
Unlock Deck
Unlock for access to all 99 flashcards in this deck.
Unlock Deck
k this deck
19
Parametric tests are distribution-free tests.
Unlock Deck
Unlock for access to all 99 flashcards in this deck.
Unlock Deck
k this deck
20
For the Wilcoxon rank-sum test with the sample sizes being at least 10,the test statistic can be assumed to follow a normal distribution with mean:
A)
B)
C)
D)
A)
B)
C)
D)
Unlock Deck
Unlock for access to all 99 flashcards in this deck.
Unlock Deck
k this deck
21
Exhibit 20.1.A pawn shop claims to sell used Kindles for about the same price as Amazon or eBay.Both online retailers sell used Kindles for around $150.Below are recent Kindle sales prices for the pawn shop. Refer to Exhibit 20.1.Specify the competing hypotheses to determine if the median sale price is greater than $150.
A)
B)
C)
D)
Refer to Exhibit 20.1.Specify the competing hypotheses to determine if the median sale price is greater than $150.A)
B)
C)
D)
Unlock Deck
Unlock for access to all 99 flashcards in this deck.
Unlock Deck
k this deck
22
Exhibit 20.1.A pawn shop claims to sell used Kindles for about the same price as Amazon or eBay.Both online retailers sell used Kindles for around $150.Below are recent Kindle sales prices for the pawn shop. Refer to Exhibit 20.1.Using the critical value approach,the appropriate conclusion is:
A)Reject the null hypothesis;conclude the median sale price is greater than $150
B)Do not reject the null hypothesis,cannot conclude the median sale price is greater than $150
C)Reject the null hypothesis,cannot conclude the median sale price is greater than $150
D)Do not reject the null hypothesis,conclude the median sale price is greater than $150
Refer to Exhibit 20.1.Using the critical value approach,the appropriate conclusion is:A)Reject the null hypothesis;conclude the median sale price is greater than $150
B)Do not reject the null hypothesis,cannot conclude the median sale price is greater than $150
C)Reject the null hypothesis,cannot conclude the median sale price is greater than $150
D)Do not reject the null hypothesis,conclude the median sale price is greater than $150
Unlock Deck
Unlock for access to all 99 flashcards in this deck.
Unlock Deck
k this deck
23
Exhibit 20.2.A trading magazine wants to determine the number of hours stock brokers work each week.In particular,the trading magazine wants to determine if the median numbers worked per week differs from 100 hours.The magazine samples 18 traders.For the Wilcoxon Signed-Rank Test,the value of the test statistic is . Refer to Exhibit 20.2.Since the sample size is at least 10,T can be assumed normally distributed with mean and standard deviation:
A)85.50,527.25
B)22.96,527.25
C)22.96,85.50
D)85.50,22.96
. Refer to Exhibit 20.2.Since the sample size is at least 10,T can be assumed normally distributed with mean and standard deviation:A)85.50,527.25
B)22.96,527.25
C)22.96,85.50
D)85.50,22.96
Unlock Deck
Unlock for access to all 99 flashcards in this deck.
Unlock Deck
k this deck
24
Exhibit 20.3.A company which produces financial accounting software wants to offer better training to its customers.The training is intended to decrease the amount of time required to do complicated accounting calculations.For seven individuals,the amount of time (in minutes)to complete a complicated calculation is determined before and after completing the new training. Refer to Exhibit 20.3.The value of the test statistic is:
A)5
B)23
C)7
D)13
Refer to Exhibit 20.3.The value of the test statistic is:A)5
B)23
C)7
D)13
Unlock Deck
Unlock for access to all 99 flashcards in this deck.
Unlock Deck
k this deck
25
Exhibit 20.1.A pawn shop claims to sell used Kindles for about the same price as Amazon or eBay.Both online retailers sell used Kindles for around $150.Below are recent Kindle sales prices for the pawn shop. Refer to Exhibit 20.1.Using the p-value approach and ,the appropriate conclusion is:
A)Reject the null hypothesis,cannot conclude the median sale price is greater than $150
B)Do not reject the null hypothesis,cannot conclude the median sale price is greater than $150
C)Do not reject the null hypothesis,conclude the median sale price is greater than $150
D)Reject the null hypothesis,conclude the median sale price is greater than $150
Refer to Exhibit 20.1.Using the p-value approach and ,the appropriate conclusion is:A)Reject the null hypothesis,cannot conclude the median sale price is greater than $150
B)Do not reject the null hypothesis,cannot conclude the median sale price is greater than $150
C)Do not reject the null hypothesis,conclude the median sale price is greater than $150
D)Reject the null hypothesis,conclude the median sale price is greater than $150
Unlock Deck
Unlock for access to all 99 flashcards in this deck.
Unlock Deck
k this deck
26
Exhibit 20.3.A company which produces financial accounting software wants to offer better training to its customers.The training is intended to decrease the amount of time required to do complicated accounting calculations.For seven individuals,the amount of time (in minutes)to complete a complicated calculation is determined before and after completing the new training. Refer to Exhibit 20.3.Using the p-value approach and ,the appropriate conclusion is:
A)Do not reject the null hypothesis,cannot conclude the median difference of the times is greater than zero
B)Do not reject the null hypothesis,conclude the median difference of the times is greater than zero
C)Reject the null hypothesis,cannot conclude the median difference of the times is greater than zero
D)Reject the null hypothesis,conclude the median difference of the times is greater than zero
Refer to Exhibit 20.3.Using the p-value approach and ,the appropriate conclusion is:A)Do not reject the null hypothesis,cannot conclude the median difference of the times is greater than zero
B)Do not reject the null hypothesis,conclude the median difference of the times is greater than zero
C)Reject the null hypothesis,cannot conclude the median difference of the times is greater than zero
D)Reject the null hypothesis,conclude the median difference of the times is greater than zero
Unlock Deck
Unlock for access to all 99 flashcards in this deck.
Unlock Deck
k this deck
27
Exhibit 20.3.A company which produces financial accounting software wants to offer better training to its customers.The training is intended to decrease the amount of time required to do complicated accounting calculations.For seven individuals,the amount of time (in minutes)to complete a complicated calculation is determined before and after completing the new training. Refer to Exhibit 20.3.The p-value for the test is:
A)Less than 0.01
B)Between 0.01 and 0.025
C)Between 0.025 and 0.05
D)Greater than 0.05
Refer to Exhibit 20.3.The p-value for the test is:A)Less than 0.01
B)Between 0.01 and 0.025
C)Between 0.025 and 0.05
D)Greater than 0.05
Unlock Deck
Unlock for access to all 99 flashcards in this deck.
Unlock Deck
k this deck
28
Exhibit 20.3.A company which produces financial accounting software wants to offer better training to its customers.The training is intended to decrease the amount of time required to do complicated accounting calculations.For seven individuals,the amount of time (in minutes)to complete a complicated calculation is determined before and after completing the new training. Refer to Exhibit 20.3.At the 5% significance level,the critical value is:
A)25
B)3
C)2
D)26
Refer to Exhibit 20.3.At the 5% significance level,the critical value is:A)25
B)3
C)2
D)26
Unlock Deck
Unlock for access to all 99 flashcards in this deck.
Unlock Deck
k this deck
29
Exhibit 20.3.A company which produces financial accounting software wants to offer better training to its customers.The training is intended to decrease the amount of time required to do complicated accounting calculations.For seven individuals,the amount of time (in minutes)to complete a complicated calculation is determined before and after completing the new training. Refer to Exhibit 20.3.Using the critical value approach,appropriate conclusion is:
A)Reject the null hypothesis,cannot conclude the median difference of the times is greater than zero
B)Reject the null hypothesis,conclude the median difference of the times is greater than zero
C)Do not reject the null hypothesis,cannot conclude the median difference of the times is greater than zero
D)Do not reject the null hypothesis,conclude the median difference of the times is greater than zero
Refer to Exhibit 20.3.Using the critical value approach,appropriate conclusion is:A)Reject the null hypothesis,cannot conclude the median difference of the times is greater than zero
B)Reject the null hypothesis,conclude the median difference of the times is greater than zero
C)Do not reject the null hypothesis,cannot conclude the median difference of the times is greater than zero
D)Do not reject the null hypothesis,conclude the median difference of the times is greater than zero
Unlock Deck
Unlock for access to all 99 flashcards in this deck.
Unlock Deck
k this deck
30
Exhibit 20.2.A trading magazine wants to determine the number of hours stock brokers work each week.In particular,the trading magazine wants to determine if the median numbers worked per week differs from 100 hours.The magazine samples 18 traders.For the Wilcoxon Signed-Rank Test,the value of the test statistic is . Refer to Exhibit 20.2.At the 1% significance level,the right-tail critical value is:
A)1.645
B)1.96
C)2.33
D)2.575
. Refer to Exhibit 20.2.At the 1% significance level,the right-tail critical value is:A)1.645
B)1.96
C)2.33
D)2.575
Unlock Deck
Unlock for access to all 99 flashcards in this deck.
Unlock Deck
k this deck
31
Exhibit 20.1.A pawn shop claims to sell used Kindles for about the same price as Amazon or eBay.Both online retailers sell used Kindles for around $150.Below are recent Kindle sales prices for the pawn shop. Refer to Exhibit 20.1.What is the value of the test statistic?
A)6
B)14
C)20
D)1
Refer to Exhibit 20.1.What is the value of the test statistic?A)6
B)14
C)20
D)1
Unlock Deck
Unlock for access to all 99 flashcards in this deck.
Unlock Deck
k this deck
32
Exhibit 20.2.A trading magazine wants to determine the number of hours stock brokers work each week.In particular,the trading magazine wants to determine if the median numbers worked per week differs from 100 hours.The magazine samples 18 traders.For the Wilcoxon Signed-Rank Test,the value of the test statistic is . Refer to Exhibit 20.2.Using the p-value approach and ,the appropriate conclusion is:
A)Reject the null hypothesis,conclude the median number of hours worked per week differs from 100
B)Reject the null hypothesis,cannot conclude the median number of hours worked per week differs from 100
C)Reject the null hypothesis,conclude the median number of hours worked per week is greater than 100
D)Reject the null hypothesis,cannot conclude the median number of hours worked per week is less 100
. Refer to Exhibit 20.2.Using the p-value approach and ,the appropriate conclusion is:A)Reject the null hypothesis,conclude the median number of hours worked per week differs from 100
B)Reject the null hypothesis,cannot conclude the median number of hours worked per week differs from 100
C)Reject the null hypothesis,conclude the median number of hours worked per week is greater than 100
D)Reject the null hypothesis,cannot conclude the median number of hours worked per week is less 100
Unlock Deck
Unlock for access to all 99 flashcards in this deck.
Unlock Deck
k this deck
33
Exhibit 20.1.A pawn shop claims to sell used Kindles for about the same price as Amazon or eBay.Both online retailers sell used Kindles for around $150.Below are recent Kindle sales prices for the pawn shop. Refer to Exhibit 20.1.At the 5% significance level,the critical value is:
A)2
B)19
C)0
D)28
Refer to Exhibit 20.1.At the 5% significance level,the critical value is:A)2
B)19
C)0
D)28
Unlock Deck
Unlock for access to all 99 flashcards in this deck.
Unlock Deck
k this deck
34
Exhibit 20.3.A company which produces financial accounting software wants to offer better training to its customers.The training is intended to decrease the amount of time required to do complicated accounting calculations.For seven individuals,the amount of time (in minutes)to complete a complicated calculation is determined before and after completing the new training. Refer to Exhibit 20.3.For the Wilcoxon signed-rank test,the competing hypotheses are:
A)
B)
C)
D)
Refer to Exhibit 20.3.For the Wilcoxon signed-rank test,the competing hypotheses are:A)
B)
C)
D)
Unlock Deck
Unlock for access to all 99 flashcards in this deck.
Unlock Deck
k this deck
35
Exhibit 20.1.A pawn shop claims to sell used Kindles for about the same price as Amazon or eBay.Both online retailers sell used Kindles for around $150.Below are recent Kindle sales prices for the pawn shop. Refer to Exhibit 20.1.The p-value for the test is:
A)Less than 0.01
B)Between 0.025 and 0.01
C)Between 0.05 and 0.025
D)Greater than 0.05
Refer to Exhibit 20.1.The p-value for the test is:A)Less than 0.01
B)Between 0.025 and 0.01
C)Between 0.05 and 0.025
D)Greater than 0.05
Unlock Deck
Unlock for access to all 99 flashcards in this deck.
Unlock Deck
k this deck
36
Exhibit 20.4.Investment institutions usually have funds with different risk vs.reward prospectuses.A trading magazine wants to determine if the returns of high risk funds is greater than low risk funds.The magazine records the return of high and low risk funds for a sample of 22 institutions.For the Wilcoxon signed-rank test,where D = high risk return - low risk return,the value of the test statistic is . Refer to Exhibit 20.4.For the Wilcoxon signed-rank test,the competing hypotheses are:
A)
B)
C)
D)
. Refer to Exhibit 20.4.For the Wilcoxon signed-rank test,the competing hypotheses are:A)
B)
C)
D)
Unlock Deck
Unlock for access to all 99 flashcards in this deck.
Unlock Deck
k this deck
37
Exhibit 20.2.A trading magazine wants to determine the number of hours stock brokers work each week.In particular,the trading magazine wants to determine if the median numbers worked per week differs from 100 hours.The magazine samples 18 traders.For the Wilcoxon Signed-Rank Test,the value of the test statistic is . Refer to Exhibit 20.2.Specify the competing hypotheses in order to determine if the median number of hours worked per week differs from 100 hours.
A)
B)
C)
D)
. Refer to Exhibit 20.2.Specify the competing hypotheses in order to determine if the median number of hours worked per week differs from 100 hours.A)
B)
C)
D)
Unlock Deck
Unlock for access to all 99 flashcards in this deck.
Unlock Deck
k this deck
38
Exhibit 20.2.A trading magazine wants to determine the number of hours stock brokers work each week.In particular,the trading magazine wants to determine if the median numbers worked per week differs from 100 hours.The magazine samples 18 traders.For the Wilcoxon Signed-Rank Test,the value of the test statistic is . Refer to Exhibit 20.2.Using the critical value approach,the appropriate conclusion is:
A)Reject the null hypothesis,cannot conclude the median number of hours worked per week differs from 100
B)Reject the null hypothesis,conclude the median number of hours worked per week is greater than 100
C)Reject the null hypothesis,cannot conclude the median number of hours worked per week is less 100
D)Reject the null hypothesis,conclude the median number of hours worked per week differs from 100
. Refer to Exhibit 20.2.Using the critical value approach,the appropriate conclusion is:A)Reject the null hypothesis,cannot conclude the median number of hours worked per week differs from 100
B)Reject the null hypothesis,conclude the median number of hours worked per week is greater than 100
C)Reject the null hypothesis,cannot conclude the median number of hours worked per week is less 100
D)Reject the null hypothesis,conclude the median number of hours worked per week differs from 100
Unlock Deck
Unlock for access to all 99 flashcards in this deck.
Unlock Deck
k this deck
39
Exhibit 20.2.A trading magazine wants to determine the number of hours stock brokers work each week.In particular,the trading magazine wants to determine if the median numbers worked per week differs from 100 hours.The magazine samples 18 traders.For the Wilcoxon Signed-Rank Test,the value of the test statistic is . Refer to Exhibit 20.2.The p-value for the test is:
A)0.0016
B)0.0032
C)0.9984
D)0
. Refer to Exhibit 20.2.The p-value for the test is:A)0.0016
B)0.0032
C)0.9984
D)0
Unlock Deck
Unlock for access to all 99 flashcards in this deck.
Unlock Deck
k this deck
40
Exhibit 20.2.A trading magazine wants to determine the number of hours stock brokers work each week.In particular,the trading magazine wants to determine if the median numbers worked per week differs from 100 hours.The magazine samples 18 traders.For the Wilcoxon Signed-Rank Test,the value of the test statistic is . Refer to Exhibit 20.2.If T is assumed to follow a normal distribution,the value of the test statistic is:
A)153
B)2.94
C)0.128
D)-2.94
. Refer to Exhibit 20.2.If T is assumed to follow a normal distribution,the value of the test statistic is:A)153
B)2.94
C)0.128
D)-2.94
Unlock Deck
Unlock for access to all 99 flashcards in this deck.
Unlock Deck
k this deck
41
Exhibit 20.4.Investment institutions usually have funds with different risk vs.reward prospectuses.A trading magazine wants to determine if the returns of high risk funds is greater than low risk funds.The magazine records the return of high and low risk funds for a sample of 22 institutions.For the Wilcoxon signed-rank test,where D = high risk return - low risk return,the value of the test statistic is . Refer to Exhibit 20.4.The p-value for the test is:
A)Greater than 0.10
B)Between 0.10 and 0.05
C)Between 0.05 and 0.01
D)Less than 0.01
. Refer to Exhibit 20.4.The p-value for the test is:A)Greater than 0.10
B)Between 0.10 and 0.05
C)Between 0.05 and 0.01
D)Less than 0.01
Unlock Deck
Unlock for access to all 99 flashcards in this deck.
Unlock Deck
k this deck
42
Exhibit 20.6.A fund manager wants to know if the annual rate of return is greater for growth stocks (1)than value stocks (2).The fund manager collects data on the returns of growth and value funds.Below are the sample sizes and rank sums for the Wilcoxon rank-sum test. Refer to Exhibit 20.6.The value of W is:
A)215
B)9870
C)13350
D)23200
Refer to Exhibit 20.6.The value of W is:A)215
B)9870
C)13350
D)23200
Unlock Deck
Unlock for access to all 99 flashcards in this deck.
Unlock Deck
k this deck
43
Exhibit 20.5.An accountant wants to know if the property taxes paid by clients that live in the city are different from those that live in the county.The property taxes paid by five clients from the city (1)and five clients from the county (2)are shown below (in dollars). Refer to Exhibit 20.5.To determine if whether the medians of the taxes paid differ using the Wilcoxon rank-sum test,the competing hypotheses are:
A)
B)
C)
D)
Refer to Exhibit 20.5.To determine if whether the medians of the taxes paid differ using the Wilcoxon rank-sum test,the competing hypotheses are:A)
B)
C)
D)
Unlock Deck
Unlock for access to all 99 flashcards in this deck.
Unlock Deck
k this deck
44
Exhibit 20.4.Investment institutions usually have funds with different risk vs.reward prospectuses.A trading magazine wants to determine if the returns of high risk funds is greater than low risk funds.The magazine records the return of high and low risk funds for a sample of 22 institutions.For the Wilcoxon signed-rank test,where D = high risk return - low risk return,the value of the test statistic is . Refer to Exhibit 20.4.Using the p-value approach and ,the appropriate conclusion is:
A)Reject the null hypothesis,conclude the median difference of the returns is greater than zero
B)Reject the null hypothesis,cannot conclude the median difference of the returns is greater than zero
C)Do no reject the null hypothesis,cannot conclude the median difference of the returns is greater than zero
D)Do not reject the null hypothesis,conclude the median difference of the returns is greater than zero
. Refer to Exhibit 20.4.Using the p-value approach and ,the appropriate conclusion is:A)Reject the null hypothesis,conclude the median difference of the returns is greater than zero
B)Reject the null hypothesis,cannot conclude the median difference of the returns is greater than zero
C)Do no reject the null hypothesis,cannot conclude the median difference of the returns is greater than zero
D)Do not reject the null hypothesis,conclude the median difference of the returns is greater than zero
Unlock Deck
Unlock for access to all 99 flashcards in this deck.
Unlock Deck
k this deck
45
Exhibit 20.5.An accountant wants to know if the property taxes paid by clients that live in the city are different from those that live in the county.The property taxes paid by five clients from the city (1)and five clients from the county (2)are shown below (in dollars). Refer to Exhibit 20.5.At the 5% significance level,the critical values are:
A)18 and 37
B)19 and 36
C)18 and 36
D)19 and 37
Refer to Exhibit 20.5.At the 5% significance level,the critical values are:A)18 and 37
B)19 and 36
C)18 and 36
D)19 and 37
Unlock Deck
Unlock for access to all 99 flashcards in this deck.
Unlock Deck
k this deck
46
Exhibit 20.7.A marketing firm needs to replace its existing network provider,and is considering three different providers.A primary consideration is the amount of system down time.The following table contains the amount of network down-time (in hours)for the last five months for each network provider. Refer to Exhibit 20.7.The test statistic value is:
A)7.8
B)13.0
C)3.2
D)12.02
Refer to Exhibit 20.7.The test statistic value is:A)7.8
B)13.0
C)3.2
D)12.02
Unlock Deck
Unlock for access to all 99 flashcards in this deck.
Unlock Deck
k this deck
47
Exhibit 20.4.Investment institutions usually have funds with different risk vs.reward prospectuses.A trading magazine wants to determine if the returns of high risk funds is greater than low risk funds.The magazine records the return of high and low risk funds for a sample of 22 institutions.For the Wilcoxon signed-rank test,where D = high risk return - low risk return,the value of the test statistic is . Refer to Exhibit 20.4.Assuming that T follows a normal distribution,the value of the test statistic is
A)0.062
B)-1.899
C)185
D)1.899
. Refer to Exhibit 20.4.Assuming that T follows a normal distribution,the value of the test statistic isA)0.062
B)-1.899
C)185
D)1.899
Unlock Deck
Unlock for access to all 99 flashcards in this deck.
Unlock Deck
k this deck
48
Exhibit 20.5.An accountant wants to know if the property taxes paid by clients that live in the city are different from those that live in the county.The property taxes paid by five clients from the city (1)and five clients from the county (2)are shown below (in dollars). Refer to Exhibit 20.5.The value of the test statistic is:
A)10
B)21
C)34
D)55
Refer to Exhibit 20.5.The value of the test statistic is:A)10
B)21
C)34
D)55
Unlock Deck
Unlock for access to all 99 flashcards in this deck.
Unlock Deck
k this deck
49
Exhibit 20.6.A fund manager wants to know if the annual rate of return is greater for growth stocks (1)than value stocks (2).The fund manager collects data on the returns of growth and value funds.Below are the sample sizes and rank sums for the Wilcoxon rank-sum test. Refer to Exhibit 20.6.Using the critical value approach,the appropriate conclusion is:
A)Reject the null hypothesis,conclude the median return of growth stock is greater than the median return of value stocks
B)Reject the null hypothesis,conclude the median return of value stock is greater than the median return of growth stocks
C)Reject the null hypothesis,conclude the median return of growth stock differs from the median return of value stocks
D)Reject the null hypothesis,cannot conclude the median return of growth stocks is greater than the median return of value stocks
Refer to Exhibit 20.6.Using the critical value approach,the appropriate conclusion is:A)Reject the null hypothesis,conclude the median return of growth stock is greater than the median return of value stocks
B)Reject the null hypothesis,conclude the median return of value stock is greater than the median return of growth stocks
C)Reject the null hypothesis,conclude the median return of growth stock differs from the median return of value stocks
D)Reject the null hypothesis,cannot conclude the median return of growth stocks is greater than the median return of value stocks
Unlock Deck
Unlock for access to all 99 flashcards in this deck.
Unlock Deck
k this deck
50
Exhibit 20.6.A fund manager wants to know if the annual rate of return is greater for growth stocks (1)than value stocks (2).The fund manager collects data on the returns of growth and value funds.Below are the sample sizes and rank sums for the Wilcoxon rank-sum test. Refer to Exhibit 20.6.The p-value for the test is:
A)Greater than 0.10
B)Between 0.10 and 0.05
C)Between 0.05 and 0.01
D)Less than 0.01
Refer to Exhibit 20.6.The p-value for the test is:A)Greater than 0.10
B)Between 0.10 and 0.05
C)Between 0.05 and 0.01
D)Less than 0.01
Unlock Deck
Unlock for access to all 99 flashcards in this deck.
Unlock Deck
k this deck
51
Exhibit 20.6.A fund manager wants to know if the annual rate of return is greater for growth stocks (1)than value stocks (2).The fund manager collects data on the returns of growth and value funds.Below are the sample sizes and rank sums for the Wilcoxon rank-sum test. Refer to Exhibit 20.6.At the 1% significance level,the critical value is:
A)1.645
B)1.96
C)2.33
D)2.575
Refer to Exhibit 20.6.At the 1% significance level,the critical value is:A)1.645
B)1.96
C)2.33
D)2.575
Unlock Deck
Unlock for access to all 99 flashcards in this deck.
Unlock Deck
k this deck
52
Exhibit 20.4.Investment institutions usually have funds with different risk vs.reward prospectuses.A trading magazine wants to determine if the returns of high risk funds is greater than low risk funds.The magazine records the return of high and low risk funds for a sample of 22 institutions.For the Wilcoxon signed-rank test,where D = high risk return - low risk return,the value of the test statistic is . Refer to Exhibit 20.4.Using the critical value approach,appropriate conclusion is:
A)Reject the null hypothesis,cannot conclude the median difference of the returns is greater than zero
B)Do no reject the null hypothesis,cannot conclude the median difference of the returns is greater than zero
C)Reject the null hypothesis,conclude the median difference of the returns is greater than zero
D)Do not reject the null hypothesis,conclude the median difference of the returns is greater than zero
. Refer to Exhibit 20.4.Using the critical value approach,appropriate conclusion is:A)Reject the null hypothesis,cannot conclude the median difference of the returns is greater than zero
B)Do no reject the null hypothesis,cannot conclude the median difference of the returns is greater than zero
C)Reject the null hypothesis,conclude the median difference of the returns is greater than zero
D)Do not reject the null hypothesis,conclude the median difference of the returns is greater than zero
Unlock Deck
Unlock for access to all 99 flashcards in this deck.
Unlock Deck
k this deck
53
Exhibit 20.4.Investment institutions usually have funds with different risk vs.reward prospectuses.A trading magazine wants to determine if the returns of high risk funds is greater than low risk funds.The magazine records the return of high and low risk funds for a sample of 22 institutions.For the Wilcoxon signed-rank test,where D = high risk return - low risk return,the value of the test statistic is . Refer to Exhibit 20.4.At the 10% significance level,the critical value is:
A)1.645
B)1.96
C)2.33
D)2.575
. Refer to Exhibit 20.4.At the 10% significance level,the critical value is:A)1.645
B)1.96
C)2.33
D)2.575
Unlock Deck
Unlock for access to all 99 flashcards in this deck.
Unlock Deck
k this deck
54
Exhibit 20.7.A marketing firm needs to replace its existing network provider,and is considering three different providers.A primary consideration is the amount of system down time.The following table contains the amount of network down-time (in hours)for the last five months for each network provider. Refer to Exhibit 20.7.For the Kruskal-Wallis test,the competing hypotheses are:
A)
B)
C)
D)
Refer to Exhibit 20.7.For the Kruskal-Wallis test,the competing hypotheses are:A)
B)
C)
D)
Unlock Deck
Unlock for access to all 99 flashcards in this deck.
Unlock Deck
k this deck
55
Exhibit 20.6.A fund manager wants to know if the annual rate of return is greater for growth stocks (1)than value stocks (2).The fund manager collects data on the returns of growth and value funds.Below are the sample sizes and rank sums for the Wilcoxon rank-sum test. Refer to Exhibit 20.6.Since both sample sizes are at least 10,W can be assumed to follow a normal distribution with a mean and standard deviation of:
A)434.74 and 8100
B)8100 and 434.74
C)8100 and 189000
D)189000 and 8100
Refer to Exhibit 20.6.Since both sample sizes are at least 10,W can be assumed to follow a normal distribution with a mean and standard deviation of:A)434.74 and 8100
B)8100 and 434.74
C)8100 and 189000
D)189000 and 8100
Unlock Deck
Unlock for access to all 99 flashcards in this deck.
Unlock Deck
k this deck
56
Exhibit 20.6.A fund manager wants to know if the annual rate of return is greater for growth stocks (1)than value stocks (2).The fund manager collects data on the returns of growth and value funds.Below are the sample sizes and rank sums for the Wilcoxon rank-sum test. Refer to Exhibit 20.6.Assuming that W follows a normal distribution,the value of the test statistic is
A)4.07
B)-4.07
C)-12.07
D)12.07
Refer to Exhibit 20.6.Assuming that W follows a normal distribution,the value of the test statistic isA)4.07
B)-4.07
C)-12.07
D)12.07
Unlock Deck
Unlock for access to all 99 flashcards in this deck.
Unlock Deck
k this deck
57
Exhibit 20.6.A fund manager wants to know if the annual rate of return is greater for growth stocks (1)than value stocks (2).The fund manager collects data on the returns of growth and value funds.Below are the sample sizes and rank sums for the Wilcoxon rank-sum test. Refer to Exhibit 20.6.Using the p-value approach and ,the appropriate conclusion is:
A)Reject the null hypothesis,conclude the median return of value stock is greater than the median return of growth stocks
B)Reject the null hypothesis,conclude the median return of growth stock differs from the median return of value stocks
C)Reject the null hypothesis,conclude the median return of growth stock is greater than the median return of value stocks
D)Reject the null hypothesis,cannot conclude the median return of growth stocks is greater than the median return of value stocks
Refer to Exhibit 20.6.Using the p-value approach and ,the appropriate conclusion is:A)Reject the null hypothesis,conclude the median return of value stock is greater than the median return of growth stocks
B)Reject the null hypothesis,conclude the median return of growth stock differs from the median return of value stocks
C)Reject the null hypothesis,conclude the median return of growth stock is greater than the median return of value stocks
D)Reject the null hypothesis,cannot conclude the median return of growth stocks is greater than the median return of value stocks
Unlock Deck
Unlock for access to all 99 flashcards in this deck.
Unlock Deck
k this deck
58
Exhibit 20.5.An accountant wants to know if the property taxes paid by clients that live in the city are different from those that live in the county.The property taxes paid by five clients from the city (1)and five clients from the county (2)are shown below (in dollars). Refer to Exhibit 20.5.Using the critical value approach,the appropriate conclusion is:
A)Reject the null hypothesis,cannot conclude the median taxes paid in the city differs from the median taxes paid in the county
B)Do not reject the null hypothesis,conclude the median taxes paid in the city differs from the median taxes paid in the county
C)Reject the null hypothesis,conclude the median taxes paid in the city differs from the median taxes paid in the county
D)Do not reject the null hypothesis,cannot conclude the median taxes paid in the city differs from the median taxes paid in the county
Refer to Exhibit 20.5.Using the critical value approach,the appropriate conclusion is:A)Reject the null hypothesis,cannot conclude the median taxes paid in the city differs from the median taxes paid in the county
B)Do not reject the null hypothesis,conclude the median taxes paid in the city differs from the median taxes paid in the county
C)Reject the null hypothesis,conclude the median taxes paid in the city differs from the median taxes paid in the county
D)Do not reject the null hypothesis,cannot conclude the median taxes paid in the city differs from the median taxes paid in the county
Unlock Deck
Unlock for access to all 99 flashcards in this deck.
Unlock Deck
k this deck
59
Exhibit 20.6.A fund manager wants to know if the annual rate of return is greater for growth stocks (1)than value stocks (2).The fund manager collects data on the returns of growth and value funds.Below are the sample sizes and rank sums for the Wilcoxon rank-sum test. Refer to Exhibit 20.6.To determine whether the median return of growth funds is larger than the median return of value funds,the competing hypotheses are:
A)
B)
C)
D)
Refer to Exhibit 20.6.To determine whether the median return of growth funds is larger than the median return of value funds,the competing hypotheses are:A)
B)
C)
D)
Unlock Deck
Unlock for access to all 99 flashcards in this deck.
Unlock Deck
k this deck
60
Exhibit 20.4.Investment institutions usually have funds with different risk vs.reward prospectuses.A trading magazine wants to determine if the returns of high risk funds is greater than low risk funds.The magazine records the return of high and low risk funds for a sample of 22 institutions.For the Wilcoxon signed-rank test,where D = high risk return - low risk return,the value of the test statistic is . Refer to Exhibit 20.4 Since the sample size is at least 10,T can be assumed to follow the normal distribution with mean and standard deviation:
A)126.5 and 30.80
B)30.80 and 126.5
C)125.5 and 948.75
D)30.80 and 984.75
. Refer to Exhibit 20.4 Since the sample size is at least 10,T can be assumed to follow the normal distribution with mean and standard deviation:A)126.5 and 30.80
B)30.80 and 126.5
C)125.5 and 948.75
D)30.80 and 984.75
Unlock Deck
Unlock for access to all 99 flashcards in this deck.
Unlock Deck
k this deck
61
Exhibit 20.9.A shipping company believes there is a linear association between the weight of packages shipped and the cost.The following table shows the weight (in pounds)and cost (in dollars)of the last 7 packages shipped. Refer to Exhibit 20.9.Using the critical value approach,the appropriate conclusion is:
A)Do not reject the null hypothesis,conclude weight and cost are correlated
B)Do not reject the null hypothesis,cannot conclude the is different from zero
C)Reject the null hypothesis,cannot conclude the correlation coefficient is different from zero
D)Reject the null hypothesis,conclude weight and cost are correlated
Refer to Exhibit 20.9.Using the critical value approach,the appropriate conclusion is:A)Do not reject the null hypothesis,conclude weight and cost are correlated
B)Do not reject the null hypothesis,cannot conclude the is different from zero
C)Reject the null hypothesis,cannot conclude the correlation coefficient is different from zero
D)Reject the null hypothesis,conclude weight and cost are correlated
Unlock Deck
Unlock for access to all 99 flashcards in this deck.
Unlock Deck
k this deck
62
Exhibit 20.8.A sports agent wants to understand the differences in the annual earnings of players in different sports.The below table shows the annual earnings (in million dollars)of 52 athletes.For the Kruskal-Wallis test,the rank sums for each group are at the bottom of the table. Refer to Exhibit 20.8.The test statistic value is:
A)18.29
B)21.0
C)23.3
D)40.6
Refer to Exhibit 20.8.The test statistic value is:A)18.29
B)21.0
C)23.3
D)40.6
Unlock Deck
Unlock for access to all 99 flashcards in this deck.
Unlock Deck
k this deck
63
Exhibit 20.10.SHY (NYSEARCA: SHY)is a 1-3 year Treasury bond fund which is considered to be a market neutral position.Using the S&P 500 as a benchmark and five years of monthly log-return data,the rank correlation coefficient of SHY with the S&P 500 is found to be . Refer to Exhibit 20.10.To determine if the SHY is not a market neutral position,the competing hypothesis are:
A)
B)
C)
D)
. Refer to Exhibit 20.10.To determine if the SHY is not a market neutral position,the competing hypothesis are:A)
B)
C)
D)
Unlock Deck
Unlock for access to all 99 flashcards in this deck.
Unlock Deck
k this deck
64
Exhibit 20.9.A shipping company believes there is a linear association between the weight of packages shipped and the cost.The following table shows the weight (in pounds)and cost (in dollars)of the last 7 packages shipped. Refer to Exhibit 20.9.To determine if the weights and costs are significantly correlated,the competing hypothesis is:
A)
B)
C)
D)
Refer to Exhibit 20.9.To determine if the weights and costs are significantly correlated,the competing hypothesis is:A)
B)
C)
D)
Unlock Deck
Unlock for access to all 99 flashcards in this deck.
Unlock Deck
k this deck
65
Exhibit 20.8.A sports agent wants to understand the differences in the annual earnings of players in different sports.The below table shows the annual earnings (in million dollars)of 52 athletes.For the Kruskal-Wallis test,the rank sums for each group are at the bottom of the table. Refer to Exhibit 20.8.The p-value for the test is:
A)Greater than 0.10
B)Between 0.05 and 0.10
C)Between 0.01 and 0.05
D)Less than 0.01
Refer to Exhibit 20.8.The p-value for the test is:A)Greater than 0.10
B)Between 0.05 and 0.10
C)Between 0.01 and 0.05
D)Less than 0.01
Unlock Deck
Unlock for access to all 99 flashcards in this deck.
Unlock Deck
k this deck
66
Exhibit 20.7.A marketing firm needs to replace its existing network provider,and is considering three different providers.A primary consideration is the amount of system down time.The following table contains the amount of network down-time (in hours)for the last five months for each network provider. Refer to Exhibit 20.7.At the 5% significance level,the critical value is
A)4.605
B)5.991
C)7.378
D)9.21
Refer to Exhibit 20.7.At the 5% significance level,the critical value isA)4.605
B)5.991
C)7.378
D)9.21
Unlock Deck
Unlock for access to all 99 flashcards in this deck.
Unlock Deck
k this deck
67
Exhibit 20.11.A wine magazine wants to know if chefs can tell the difference between duck liver pate and wet dog food.Eighteen chefs were asked to rate both the pate and dog food on a scale from 1 to 5,with 1 corresponding to "inedible" and 5 to "very tasty".The results are shown in the following table. Refer to Exhibit 20.11.The estimate of the population proportion of plus signs is:
A)0.944
B)0.50
C)0.056
D)None of the above
Refer to Exhibit 20.11.The estimate of the population proportion of plus signs is:A)0.944
B)0.50
C)0.056
D)None of the above
Unlock Deck
Unlock for access to all 99 flashcards in this deck.
Unlock Deck
k this deck
68
Exhibit 20.7.A marketing firm needs to replace its existing network provider,and is considering three different providers.A primary consideration is the amount of system down time.The following table contains the amount of network down-time (in hours)for the last five months for each network provider. Refer to Exhibit 20.7.The p-value for the test is:
A)Less than 0.01
B)Between 0.01 and 0.05
C)Between 0.05 and 0.10
D)Greater than 0.10
Refer to Exhibit 20.7.The p-value for the test is:A)Less than 0.01
B)Between 0.01 and 0.05
C)Between 0.05 and 0.10
D)Greater than 0.10
Unlock Deck
Unlock for access to all 99 flashcards in this deck.
Unlock Deck
k this deck
69
Exhibit 20.11.A wine magazine wants to know if chefs can tell the difference between duck liver pate and wet dog food.Eighteen chefs were asked to rate both the pate and dog food on a scale from 1 to 5,with 1 corresponding to "inedible" and 5 to "very tasty".The results are shown in the following table. Refer to Exhibit 20.11.To determine if there are differences in preferences between pate and dog food using the sign test,the competing hypotheses are:
A)
B)
C)
D)
Refer to Exhibit 20.11.To determine if there are differences in preferences between pate and dog food using the sign test,the competing hypotheses are:A)
B)
C)
D)
Unlock Deck
Unlock for access to all 99 flashcards in this deck.
Unlock Deck
k this deck
70
Exhibit 20.10.SHY (NYSEARCA: SHY)is a 1-3 year Treasury bond fund which is considered to be a market neutral position.Using the S&P 500 as a benchmark and five years of monthly log-return data,the rank correlation coefficient of SHY with the S&P 500 is found to be . Refer to Exhibit 20.10.The p-value for the test is:
A)Less than 0.01
B)Between 0.01 and 0.05
C)Between 0.05 and 0.10
D)Greater than 0.10
. Refer to Exhibit 20.10.The p-value for the test is:A)Less than 0.01
B)Between 0.01 and 0.05
C)Between 0.05 and 0.10
D)Greater than 0.10
Unlock Deck
Unlock for access to all 99 flashcards in this deck.
Unlock Deck
k this deck
71
Exhibit 20.10.SHY (NYSEARCA: SHY)is a 1-3 year Treasury bond fund which is considered to be a market neutral position.Using the S&P 500 as a benchmark and five years of monthly log-return data,the rank correlation coefficient of SHY with the S&P 500 is found to be . Refer to Exhibit 20.10.Since the sample size is greater than 10 and can be assumed to follow a normal distribution,the value of the test statistic is
A)-2.20
B)-2.18
C)2.18
D)2.20
. Refer to Exhibit 20.10.Since the sample size is greater than 10 and can be assumed to follow a normal distribution,the value of the test statistic isA)-2.20
B)-2.18
C)2.18
D)2.20
Unlock Deck
Unlock for access to all 99 flashcards in this deck.
Unlock Deck
k this deck
72
Exhibit 20.8.A sports agent wants to understand the differences in the annual earnings of players in different sports.The below table shows the annual earnings (in million dollars)of 52 athletes.For the Kruskal-Wallis test,the rank sums for each group are at the bottom of the table. Refer to Exhibit 20.8.At the 1% significance level,the critical value is
A)11.345
B)9.348
C)7.815
D)6.251
Refer to Exhibit 20.8.At the 1% significance level,the critical value isA)11.345
B)9.348
C)7.815
D)6.251
Unlock Deck
Unlock for access to all 99 flashcards in this deck.
Unlock Deck
k this deck
73
Exhibit 20.11.A wine magazine wants to know if chefs can tell the difference between duck liver pate and wet dog food.Eighteen chefs were asked to rate both the pate and dog food on a scale from 1 to 5,with 1 corresponding to "inedible" and 5 to "very tasty".The results are shown in the following table. Refer to Exhibit 20.11.Assuming has the standard normal distribution,the value of the test statistic for the sign test is:
A)3.767
B)-3.767
C)0
D)None of the above
Refer to Exhibit 20.11.Assuming has the standard normal distribution,the value of the test statistic for the sign test is:A)3.767
B)-3.767
C)0
D)None of the above
Unlock Deck
Unlock for access to all 99 flashcards in this deck.
Unlock Deck
k this deck
74
Exhibit 20.8.A sports agent wants to understand the differences in the annual earnings of players in different sports.The below table shows the annual earnings (in million dollars)of 52 athletes.For the Kruskal-Wallis test,the rank sums for each group are at the bottom of the table. Refer to Exhibit 20.8.For the Kruskal-Wallis test,the competing hypotheses are:
A) ,
B)
C) ,
D)
Refer to Exhibit 20.8.For the Kruskal-Wallis test,the competing hypotheses are:A)
, B)
C)
, D)
Unlock Deck
Unlock for access to all 99 flashcards in this deck.
Unlock Deck
k this deck
75
Exhibit 20.8.A sports agent wants to understand the differences in the annual earnings of players in different sports.The below table shows the annual earnings (in million dollars)of 52 athletes.For the Kruskal-Wallis test,the rank sums for each group are at the bottom of the table. Refer to Exhibit 20.8.Using the p-value approach and ,the appropriate conclusion is:
A)Reject the null hypothesis,the annual salaries are not the same
B)Reject the null hypothesis,all median annual salaries are the same
C)Reject the null hypothesis,not all median annual salaries are the same
D)Reject the null hypothesis,cannot conclude all median annual salaries are not the same
Refer to Exhibit 20.8.Using the p-value approach and ,the appropriate conclusion is:A)Reject the null hypothesis,the annual salaries are not the same
B)Reject the null hypothesis,all median annual salaries are the same
C)Reject the null hypothesis,not all median annual salaries are the same
D)Reject the null hypothesis,cannot conclude all median annual salaries are not the same
Unlock Deck
Unlock for access to all 99 flashcards in this deck.
Unlock Deck
k this deck
76
Exhibit 20.9.A shipping company believes there is a linear association between the weight of packages shipped and the cost.The following table shows the weight (in pounds)and cost (in dollars)of the last 7 packages shipped. Refer to Exhibit 20.9.At the 10% significance level,the positive critical value is:
A)0.893
B)0.786
C)0.714
D)0.881
Refer to Exhibit 20.9.At the 10% significance level,the positive critical value is:A)0.893
B)0.786
C)0.714
D)0.881
Unlock Deck
Unlock for access to all 99 flashcards in this deck.
Unlock Deck
k this deck
77
Exhibit 20.8.A sports agent wants to understand the differences in the annual earnings of players in different sports.The below table shows the annual earnings (in million dollars)of 52 athletes.For the Kruskal-Wallis test,the rank sums for each group are at the bottom of the table. Refer to Exhibit 20.8.Using the critical value approach,the appropriate conclusion is:
A)Reject the null hypothesis,the annual earnings are not the same
B)Reject the null hypothesis,not all median annual earnings are the same
C)Reject the null hypothesis,all median annual earnings are the same
D)Reject the null hypothesis,cannot conclude all median annual earnings are not the same
Refer to Exhibit 20.8.Using the critical value approach,the appropriate conclusion is:A)Reject the null hypothesis,the annual earnings are not the same
B)Reject the null hypothesis,not all median annual earnings are the same
C)Reject the null hypothesis,all median annual earnings are the same
D)Reject the null hypothesis,cannot conclude all median annual earnings are not the same
Unlock Deck
Unlock for access to all 99 flashcards in this deck.
Unlock Deck
k this deck
78
Exhibit 20.9.A shipping company believes there is a linear association between the weight of packages shipped and the cost.The following table shows the weight (in pounds)and cost (in dollars)of the last 7 packages shipped. Refer to Exhibit 20.9.The Spearman rank correlation coefficient between weight and cost is:
A)0.960
B)0.811
C)0.820
D)0.897
Refer to Exhibit 20.9.The Spearman rank correlation coefficient between weight and cost is:A)0.960
B)0.811
C)0.820
D)0.897
Unlock Deck
Unlock for access to all 99 flashcards in this deck.
Unlock Deck
k this deck
79
Exhibit 20.10.SHY (NYSEARCA: SHY)is a 1-3 year Treasury bond fund which is considered to be a market neutral position.Using the S&P 500 as a benchmark and five years of monthly log-return data,the rank correlation coefficient of SHY with the S&P 500 is found to be . Refer to Exhibit 20.10.Using the p-value approach and ,the appropriate conclusion is:
A)Reject the null hypothesis,cannot conclude the correlation coefficient is not zero
B)Do not reject the null hypothesis,conclude the correlation coefficient is not zero
C)Reject the null hypothesis,conclude the correlation coefficient is not zero
D)Do not reject the null hypothesis,cannot conclude the correlation coefficient is not zero
. Refer to Exhibit 20.10.Using the p-value approach and ,the appropriate conclusion is:A)Reject the null hypothesis,cannot conclude the correlation coefficient is not zero
B)Do not reject the null hypothesis,conclude the correlation coefficient is not zero
C)Reject the null hypothesis,conclude the correlation coefficient is not zero
D)Do not reject the null hypothesis,cannot conclude the correlation coefficient is not zero
Unlock Deck
Unlock for access to all 99 flashcards in this deck.
Unlock Deck
k this deck
80
Exhibit 20.10.SHY (NYSEARCA: SHY)is a 1-3 year Treasury bond fund which is considered to be a market neutral position.Using the S&P 500 as a benchmark and five years of monthly log-return data,the rank correlation coefficient of SHY with the S&P 500 is found to be . Refer to Exhibit 20.10.Since the sample size is greater than 10, can be assumed to follow a normal distribution with standard deviation:
A)0
B)0.129
C)0.130
D)1
. Refer to Exhibit 20.10.Since the sample size is greater than 10, can be assumed to follow a normal distribution with standard deviation:A)0
B)0.129
C)0.130
D)1
Unlock Deck
Unlock for access to all 99 flashcards in this deck.
Unlock Deck
k this deck
Unlock Deck
Unlock for access to all 99 flashcards in this deck.


