Deck 10: Statistical Inference Concerning Two Populations
Full screen (f)
Question
Question
The difference between the two sample means  is an interval estimator of the difference between two population means
  .
.
is an interval estimator of the difference between two population means . Question
Question
We convert the estimate  into the corresponding value of the z or t test statistic by dividing the difference between
  and the hypothesized difference
  by the standard error of the estimator
  .
.
into the corresponding value of the z or t test statistic by dividing the difference between and the hypothesized difference by the standard error of the estimator . Question
In the case when  and
and  are unknown and can be assumed equal,we can calculate a pooled estimate of the population variance.
and are unknown and can be assumed equal,we can calculate a pooled estimate of the population variance. Question
Question
If the underlying populations cannot be assumed to be normal,then by the central limit theorem,the sampling distribution of  is approximately normal only if both sample sizes are sufficiently large-that is,when ____________.
A)
B)
C)
D)
is approximately normal only if both sample sizes are sufficiently large-that is,when ____________.A)
B)
C)
D)
Question
Question
The margin of error in the confidence interval for the difference  equals the standard error
  multiplied by either
  or
or  ,depending on whether or not the population variances are known.
equals the standard error multiplied by either or ,depending on whether or not the population variances are known. Question
What formula is used to calculate the degrees of freedom for the t test for comparing two population means when the population variances are unknown and unequal?
A)
B)
C)
D)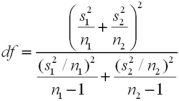
A)
B)
C)
D)
Question
When calculating the standard error of  ,under what assumption do you pool the sample variances
  and
and  ?
?
A)Known population variances
B)Unknown population variances that are assumed equal
C)Unknown population variances that are assumed unequal
D)All of the above
,under what assumption do you pool the sample variances and ?A)Known population variances
B)Unknown population variances that are assumed equal
C)Unknown population variances that are assumed unequal
D)All of the above
Question
The confidence interval for the difference  is based on the same approach used in the case of one sample: Point Estimate ± Standard Error.
is based on the same approach used in the case of one sample: Point Estimate ± Standard Error. Question
Which of the following pairs of hypotheses are used to test if the mean of the first population is smaller than the mean of the second population,using independent random sampling?
A)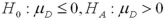
B)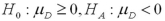
C)
D)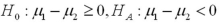
A)
B)
C)
D)
Question
Question
Which of the following is not a restriction for comparing two population means?
A)A normally distributed sampling distribution of
B)The equality of the sample sizes
C)Both A and B
D)Neither A or B
A)A normally distributed sampling distribution of
B)The equality of the sample sizes
C)Both A and B
D)Neither A or B
Question
Question
A demographer wants to measure life expectancy in countries 1 and 2.Let  and
and  denote the mean life expectancy in countries 1 and 2,respectively.Specify the hypothesis to determine if life expectancy in country 1 is more than 10 years lower than in country 2.
A)
B)
C)
D)
and denote the mean life expectancy in countries 1 and 2,respectively.Specify the hypothesis to determine if life expectancy in country 1 is more than 10 years lower than in country 2.A)
B)
C)
D)
Question
For a statistical inference regarding  ,it is imperative that the sampling distribution of
  is normally distributed.
,it is imperative that the sampling distribution of is normally distributed. Question
If the underlying populations cannot be assumed to be normal,then by the central limit theorem,the sampling distribution of  is approximately normal only if the sum of the sample observations is sufficiently large-that is,when
  .
.
is approximately normal only if the sum of the sample observations is sufficiently large-that is,when . Question
Question
Question
Question
Question
Assume the competing hypotheses take the following form: 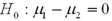 versus
 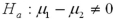 ,where
  is the population mean for population 1 and
  is the population mean for population 2.Also assume that the populations are normally distributed and we use independent sampling.The population variances are not known and cannot be assumed equal.The value of the appropriate test statistic is computed as ____________.
A)
B)
C)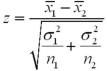
D)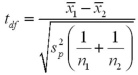
versus ,where is the population mean for population 1 and is the population mean for population 2.Also assume that the populations are normally distributed and we use independent sampling.The population variances are not known and cannot be assumed equal.The value of the appropriate test statistic is computed as ____________.A)
B)
C)
D)
Question
If the sampling distribution of  cannot be assumed normal,we _____________.
A)Are unable to compute a confidence interval
B)Are still able to use the z distribution to compute a confidence interval
C)Must use the t distribution with degrees of freedom to compute a confidence interval
D)Must use the t distribution and calculate the degrees of freedom using
cannot be assumed normal,we _____________.A)Are unable to compute a confidence interval
B)Are still able to use the z distribution to compute a confidence interval
C)Must use the t distribution with
degrees of freedom to compute a confidence intervalD)Must use the t distribution and calculate the degrees of freedom using
Question
A particular bank has two loan modification programs for distressed borrowers: Home Affordable Modification Program (HAMP)modifications,where the federal government pays the bank $1,000 for each successful modification,and non-HAMP modifications,where the bank does not receive a bonus from the federal government.In order to qualify for a HAMP modification,borrowers must meet a set of financial suitability criteria.Define the null and alternative hypotheses to test whether borrowers who receive HAMP modifications default less than borrowers who receive non-HAMP modifications.Let  and
and  represent the proportion of borrowers who received HAMP and non-HAMP modifications that did not re-default,respectively.
A)
B)
C)
D)
and represent the proportion of borrowers who received HAMP and non-HAMP modifications that did not re-default,respectively.A)
B)
C)
D)
Question
Question
A particular personal trainer works primarily with track and field athletes.She believes that her clients run faster after going through her program for six weeks.How might she test that claim?
A)A hypothesis test for .
.
B)A hypothesis test for .
.
C)A matched pairs hypothesis test for μD.
D)We are unable to conduct a hypothesis test since the samples would not be independent.
A)A hypothesis test for
.B)A hypothesis test for
.C)A matched pairs hypothesis test for μD.
D)We are unable to conduct a hypothesis test since the samples would not be independent.
Question
Exhibit 10.1 A farmer uses a lot of fertilizer to grow his crops.The farmer's manager thinks fertilizer products from distributor A contain more of the nitrogen that his plants need than distributor B's fertilizer does.He takes two independent samples of four batches of fertilizer from each distributor and measures the amount of nitrogen in each batch.Fertilizer from distributor A contained 23 pounds per batch and fertilizer from distributor B contained 18 pounds per batch.Suppose the population standard deviation for distributor A and distributor B is four pounds per batch and five pounds per batch,respectively.Assume the distribution of nitrogen in fertilizer is normally distributed.Let  and
and  represent the average amount of nitrogen per batch for fertilizer's A and B,respectively. Refer to Exhibit 10.1.Calculate the appropriate p-value.
A)0.0592
B)0.0847
C)0.0896
D)0.1184
and represent the average amount of nitrogen per batch for fertilizer's A and B,respectively. Refer to Exhibit 10.1.Calculate the appropriate p-value.A)0.0592
B)0.0847
C)0.0896
D)0.1184
Question
A particular bank has two loan modification programs for distressed borrowers: Home Affordable Modification Program (HAMP)modifications,where the federal government pays the bank $1,000 for each successful modification,and non-HAMP modifications,where the bank does not receive a bonus from the federal government.In order to qualify for a HAMP modification,borrowers must meet a set of financial suitability criteria.What type of hypothesis test should we use to test whether borrowers from this particular bank who receive HAMP modifications are more likely to re-default than those who receive non-HAMP modifications?
A)A hypothesis test for .
.
B)A hypothesis test for .
.
C)A matched-pairs hypothesis test.
D)We are unable to conduct a hypothesis test since independent random samples of each group could not be collected.
A)A hypothesis test for
.B)A hypothesis test for
.C)A matched-pairs hypothesis test.
D)We are unable to conduct a hypothesis test since independent random samples of each group could not be collected.
Question
Exhibit 10.2.Calcium is an essential nutrient for strong bones and for controlling blood pressure and heart beat.Since most of the body's calcium is stored in bones and teeth,the body withdraws the calcium it needs from the bones.Over time,if more calcium is taken out of the bones than is put in,the result may be thin,weak bones.This is especially important for women who are often recommended a calcium supplement.A consumer group activist assumes that calcium content in two popular supplements are normally distributed with the same unknown population variance,and uses the following information obtained under independent sampling: ![<strong>Exhibit 10.2.Calcium is an essential nutrient for strong bones and for controlling blood pressure and heart beat.Since most of the body's calcium is stored in bones and teeth,the body withdraws the calcium it needs from the bones.Over time,if more calcium is taken out of the bones than is put in,the result may be thin,weak bones.This is especially important for women who are often recommended a calcium supplement.A consumer group activist assumes that calcium content in two popular supplements are normally distributed with the same unknown population variance,and uses the following information obtained under independent sampling: Let μ<sub>1</sub> and μ<sub>2</sub> denote the corresponding population means. Refer to Exhibit 10.2.Construct a 95% confidence interval for the difference μ<sub>1</sub> - μ<sub>2</sub>.</strong> A)[-30.9386,1.0614] B)[-31.5886,-0.4114] C)[-33.8007,1.8007] D)[-34.8012,2.8012] <div style=padding-top: 35px>](https://storage.examlex.com/TB2339/11eaa4ae_7aba_369b_9180_5d478f43653f_TB2339_00.jpg) Let μ1 and μ2 denote the corresponding population means. Refer to Exhibit 10.2.Construct a 95% confidence interval for the difference μ1 - μ2.
Let μ1 and μ2 denote the corresponding population means. Refer to Exhibit 10.2.Construct a 95% confidence interval for the difference μ1 - μ2.
A)[-30.9386,1.0614]
B)[-31.5886,-0.4114]
C)[-33.8007,1.8007]
D)[-34.8012,2.8012]
Let μ1 and μ2 denote the corresponding population means. Refer to Exhibit 10.2.Construct a 95% confidence interval for the difference μ1 - μ2.A)[-30.9386,1.0614]
B)[-31.5886,-0.4114]
C)[-33.8007,1.8007]
D)[-34.8012,2.8012]
Question
Which of the following set of hypotheses are used to test if the mean of the first population is smaller than the mean of the second population,using matched-paired sampling?
A)
B)
C)
D)
A)
B)
C)
D)
Question
Assume the competing hypotheses take the following form:  versus
  ,where
  is the population mean for population 1 and
  is the population mean for population 2.Also assume that the populations are normally distributed with known variances and we use independent sampling.The value of the appropriate test statistic is computed as ___________.
A)
B)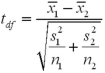
C)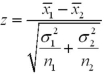
D)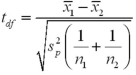
versus ,where is the population mean for population 1 and is the population mean for population 2.Also assume that the populations are normally distributed with known variances and we use independent sampling.The value of the appropriate test statistic is computed as ___________.A)
B)
C)
D)
Question
Question
When the hypothesized difference of the population proportions is equal to 0,we ____________.
A)Use a matched-pairs approach
B)Are able to estimate the standard error of using the pooled

C)Can use the confidence interval to implement the test if the difference of the population proportions is equal to 0
D)Both B and C
A)Use a matched-pairs approach
B)Are able to estimate the standard error of
using the pooledC)Can use the confidence interval to implement the test if the difference of the population proportions is equal to 0
D)Both B and C
Question
Exhibit 10.1 A farmer uses a lot of fertilizer to grow his crops.The farmer's manager thinks fertilizer products from distributor A contain more of the nitrogen that his plants need than distributor B's fertilizer does.He takes two independent samples of four batches of fertilizer from each distributor and measures the amount of nitrogen in each batch.Fertilizer from distributor A contained 23 pounds per batch and fertilizer from distributor B contained 18 pounds per batch.Suppose the population standard deviation for distributor A and distributor B is four pounds per batch and five pounds per batch,respectively.Assume the distribution of nitrogen in fertilizer is normally distributed.Let  and
and  represent the average amount of nitrogen per batch for fertilizer's A and B,respectively. Refer to Exhibit 10.1.Calculate the value of the test statistic.
A)
B)
C)
D)
and represent the average amount of nitrogen per batch for fertilizer's A and B,respectively. Refer to Exhibit 10.1.Calculate the value of the test statistic.A)
B)
C)
D)
Question
You would like to determine if there is a higher incidence of smoking among women than among men in a neighborhood.Let men and women be represented by populations 1 and 2,respectively.The relevant hypotheses are constructed as _____________.
A)
B)
C)
D)
A)
B)
C)
D)
Question
It is appropriate to conduct a hypothesis test for the difference between two population proportions under independent sampling:
A)In every case.
B)Only if and
and
 .
.
C)Only if and
and
 .
.
D)Only if
A)In every case.
B)Only if
and .C)Only if
and .D)Only if
Question
You would like to determine if there is a higher incidence of smoking among women than among men in a neighborhood.Let women and men be represented by populations 1 and 2,respectively.The relevant hypotheses are constructed as ____________.
A)
B)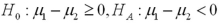
C)
D)
A)
B)
C)
D)
Question
Assume the competing hypotheses take the following form:  versus
  ,where
  is the population mean for population 1 and
  is the population mean for population 2.Also assume that the populations are normally distributed and that the observations in the two samples are independent.The population variances are not known but are assumed equal.The value of the appropriate test statistic is computed as ____________.
A)
B)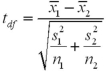
C)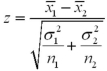
D)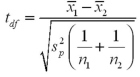
versus ,where is the population mean for population 1 and is the population mean for population 2.Also assume that the populations are normally distributed and that the observations in the two samples are independent.The population variances are not known but are assumed equal.The value of the appropriate test statistic is computed as ____________.A)
B)
C)
D)
Question
Question
Exhibit 10.8.A new sales training program has been instituted at a rent-to-own company.Prior to the training,10 employees were tested on their knowledge of products offered by the company.Once the training was completed,the employees were tested again in an effort to determine whether the training program was effective.Scores are known to be normally distributed.The sample scores on the tests are listed next.Use pre-test score as population 1 and post-test score as population 2,or  as the mean of the differences calculated as pre-test score minus post-test score.
  Refer to Exhibit 10.8.What are the appropriate hypotheses to determine if the training increases scores?
A)
B)
C)
D)
as the mean of the differences calculated as pre-test score minus post-test score. Refer to Exhibit 10.8.What are the appropriate hypotheses to determine if the training increases scores?A)
B)
C)
D)
Question
Question
Exhibit 10.7.A stats professor at a large university hypothesizes that students who take statistics in the morning typically do better than those who take it in the afternoon.He takes independently random samples,each of size 36,consisting of students who took a morning and an afternoon class,and compares the scores of each group on a common final exam.He finds that the morning group scored an average of 74 with a standard deviation of 8,while the evening group scored an average of 68 with a standard deviation of 10.The population standard deviation of scores is unknown,but assumed to be equal for morning and evening classes.Let  and
and  represent the population mean final exam scores of statistics' courses offered in the morning and the afternoon,respectively. Refer to Exhibit 10.7.At the 1% significance level,does the evidence support the professor's claim?
A)No,since the test statistic is less than the critical value.
B)Yes,since the test statistic is less than the critical value.
C)No,since the test statistic is greater than the critical value.
D)Yes,since the test statistic is greater than the critical value.
and represent the population mean final exam scores of statistics' courses offered in the morning and the afternoon,respectively. Refer to Exhibit 10.7.At the 1% significance level,does the evidence support the professor's claim?A)No,since the test statistic is less than the critical value.
B)Yes,since the test statistic is less than the critical value.
C)No,since the test statistic is greater than the critical value.
D)Yes,since the test statistic is greater than the critical value.
Question
Exhibit 10.5.A producer of fine chocolates believes that the sales of two varieties of truffles differ significantly during the holiday season.The first variety is milk chocolate while the second is milk chocolate filled with mint.It is reasonable to assume that truffle sales are normally distributed with unknown but equal population variances.Two independent samples of 18 observations each are collected for the holiday period.A sample mean of 12 million milk chocolate truffles sold with a sample standard deviation of 2.5 million.A sample mean of 13.5 million truffles filled with mint sold with a sample standard deviation of 2.3 million.Use milk chocolate as population 1 and mint chocolate as population 2. Refer to Exhibit 10.5.Assuming the population variances are equal,compute the value of the appropriate test statistic.
A)
B)
C)
D)
A)
B)
C)
D)
Question
Exhibit 10.3.A restaurant chain has two locations in a medium-sized town and,believing that it has oversaturated the market for its food,is considering closing one of the restaurants.The manager of the restaurant with a downtown location claims that his restaurant generates more revenue than the sister restaurant by the freeway.The CEO of this company,wishing to test this claim,randomly selects 36 monthly revenue totals for each restaurant.The revenue data from the downtown restaurant have a mean of $360,000 and a standard deviation of $50,000,while the data from the restaurant by the freeway have a mean of $340,000 and a standard deviation of $40,000.Assume there is no reason to believe the population standard deviations are equal,and let  and
and  denote the mean monthly revenue of the downtown restaurant and the restaurant by the freeway,respectively. Refer to Exhibit 10.3.At the 5% significance level,does the evidence support the manager's claim?
A)No,since the test statistic value is less than the critical value.
B)Yes,since the test statistic value is less than the critical value.
C)No,since the test statistic value is greater than the critical value.
D)Yes,since the test statistic value is greater than the critical value.
and denote the mean monthly revenue of the downtown restaurant and the restaurant by the freeway,respectively. Refer to Exhibit 10.3.At the 5% significance level,does the evidence support the manager's claim?A)No,since the test statistic value is less than the critical value.
B)Yes,since the test statistic value is less than the critical value.
C)No,since the test statistic value is greater than the critical value.
D)Yes,since the test statistic value is greater than the critical value.
Question
Exhibit 10.5.A producer of fine chocolates believes that the sales of two varieties of truffles differ significantly during the holiday season.The first variety is milk chocolate while the second is milk chocolate filled with mint.It is reasonable to assume that truffle sales are normally distributed with unknown but equal population variances.Two independent samples of 18 observations each are collected for the holiday period.A sample mean of 12 million milk chocolate truffles sold with a sample standard deviation of 2.5 million.A sample mean of 13.5 million truffles filled with mint sold with a sample standard deviation of 2.3 million.Use milk chocolate as population 1 and mint chocolate as population 2. Refer to Exhibit 10.5.What are the appropriate hypotheses to determine if the average sales of the two varieties of truffles differ significantly during the holiday season?
A)
B)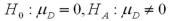
C)
D)
A)
B)
C)
D)
Question
Exhibit 10.2.A restaurant chain has two locations in a medium-sized town and,believing that it has oversaturated the market for its food,is considering closing one of the restaurants.The manager of the restaurant with a downtown location claims that his restaurant generates more revenue than the sister restaurant by the freeway.The CEO of this company,wishing to test this claim,randomly selects 36 monthly revenue totals for each restaurant.The revenue data from the downtown restaurant have a mean of $360,000 and a standard deviation of $50,000,while the data from the restaurant by the freeway have a mean of $340,000 and a standard deviation of $40,000.Assume there is no reason to believe the population standard deviations are equal,and let  and
and  denote the mean monthly revenue of the downtown restaurant and the restaurant by the freeway,respectively. Refer to Exhibit 10.3.Specify the hypotheses to test the manager's claim.
A)
B)
C)
D)
and denote the mean monthly revenue of the downtown restaurant and the restaurant by the freeway,respectively. Refer to Exhibit 10.3.Specify the hypotheses to test the manager's claim.A)
B)
C)
D)
Question
Exhibit 10.7.A stats professor at a large university hypothesizes that students who take statistics in the morning typically do better than those who take it in the afternoon.He takes independently random samples,each of size 36,consisting of students who took a morning and an afternoon class,and compares the scores of each group on a common final exam.He finds that the morning group scored an average of 74 with a standard deviation of 8,while the evening group scored an average of 68 with a standard deviation of 10.The population standard deviation of scores is unknown,but assumed to be equal for morning and evening classes.Let  and
and  represent the population mean final exam scores of statistics' courses offered in the morning and the afternoon,respectively Refer to Exhibit 10.7.Compute the appropriate test statistic to analyze the claim at the 1% significance level.
A)
B)
C)
D)
and represent the population mean final exam scores of statistics' courses offered in the morning and the afternoon,respectively Refer to Exhibit 10.7.Compute the appropriate test statistic to analyze the claim at the 1% significance level.A)
B)
C)
D)
Question
Exhibit 10.2.Calcium is an essential nutrient for strong bones and for controlling blood pressure and heart beat.Since most of the body's calcium is stored in bones and teeth,the body withdraws the calcium it needs from the bones.Over time,if more calcium is taken out of the bones than is put in,the result may be thin,weak bones.This is especially important for women who are often recommended a calcium supplement.A consumer group activist assumes that calcium content in two popular supplements are normally distributed with the same unknown population variance,and uses the following information obtained under independent sampling: 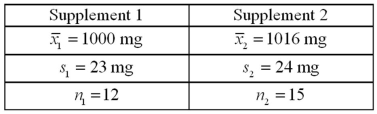 Let μ1 and μ2 denote the corresponding population means. Refer to Exhibit 10.2.Can we conclude that the average calcium content of the two supplements differs at the 95% confidence level?
A)No,since the 95% confidence interval contains the hypothesized value of zero.
B)Yes,since the 95% confidence interval contains the hypothesized value of zero.
C)No,since the 95% confidence interval does not contain the hypothesized value of zero.
D)Yes,since the 95% confidence interval does not contain the hypothesized value of zero.
Let μ1 and μ2 denote the corresponding population means. Refer to Exhibit 10.2.Can we conclude that the average calcium content of the two supplements differs at the 95% confidence level?A)No,since the 95% confidence interval contains the hypothesized value of zero.
B)Yes,since the 95% confidence interval contains the hypothesized value of zero.
C)No,since the 95% confidence interval does not contain the hypothesized value of zero.
D)Yes,since the 95% confidence interval does not contain the hypothesized value of zero.
Question
Exhibit 10.7.A stats professor at a large university hypothesizes that students who take statistics in the morning typically do better than those who take it in the afternoon.He takes independently random samples,each of size 36,consisting of students who took a morning and an afternoon class,and compares the scores of each group on a common final exam.He finds that the morning group scored an average of 74 with a standard deviation of 8,while the evening group scored an average of 68 with a standard deviation of 10.The population standard deviation of scores is unknown,but assumed to be equal for morning and evening classes.Let  and
and  represent the population mean final exam scores of statistics' courses offered in the morning and the afternoon,respectively Refer to Exhibit 10.7.What is the appropriate critical value(s)to test the professor's claim at the 1% significance level?
A)-2.381 and 2.381
B)-2.326 and 2.326
C)2.326
D)2.381
and represent the population mean final exam scores of statistics' courses offered in the morning and the afternoon,respectively Refer to Exhibit 10.7.What is the appropriate critical value(s)to test the professor's claim at the 1% significance level?A)-2.381 and 2.381
B)-2.326 and 2.326
C)2.326
D)2.381
Question
Exhibit 10.8.A new sales training program has been instituted at a rent-to-own company.Prior to the training,10 employees were tested on their knowledge of products offered by the company.Once the training was completed,the employees were tested again in an effort to determine whether the training program was effective.Scores are known to be normally distributed.The sample scores on the tests are listed next.Use pre-test score as population 1 and post-test score as population 2,or  as the mean of the differences calculated as pre-test score minus post-test score.
  Refer to Exhibit 10.8.What is the value of the appropriate test statistic?
A)
B)
C)
D)
as the mean of the differences calculated as pre-test score minus post-test score. Refer to Exhibit 10.8.What is the value of the appropriate test statistic?A)
B)
C)
D)
Question
Question
Question
Exhibit 10.3.A restaurant chain has two locations in a medium-sized town and,believing that it has oversaturated the market for its food,is considering closing one of the restaurants.The manager of the restaurant with a downtown location claims that his restaurant generates more revenue than the sister restaurant by the freeway.The CEO of this company,wishing to test this claim,randomly selects 36 monthly revenue totals for each restaurant.The revenue data from the downtown restaurant have a mean of $360,000 and a standard deviation of $50,000,while the data from the restaurant by the freeway have a mean of $340,000 and a standard deviation of $40,000.Assume there is no reason to believe the population standard deviations are equal,and let  and
and  denote the mean monthly revenue of the downtown restaurant and the restaurant by the freeway,respectively. Refer to Exhibit 10.3.What is the appropriate critical value(s)to test the manager's claim at the 5% significance level?
A)1.645
B)1.668
C)1.960
D)1.997
and denote the mean monthly revenue of the downtown restaurant and the restaurant by the freeway,respectively. Refer to Exhibit 10.3.What is the appropriate critical value(s)to test the manager's claim at the 5% significance level?A)1.645
B)1.668
C)1.960
D)1.997
Question
Exhibit 10.4.A 7000-seat theater is interested in determining whether there is a difference in attendance between shows on Tuesday evening and those on Wednesday evening.Two independent samples of 25 weeks are collected for Tuesday and Wednesday.The mean attendance on Tuesday evening is calculated as 5500,while the mean attendance on Wednesday evening is calculated as 5850.The known population standard deviation for attendance on Tuesday evening is 550 and the known population standard deviation for attendance on Wednesday evening is 445. Refer to Exhibit 10.4.What are the appropriate hypotheses to determine whether there is a difference in attendance for shows on Tuesday evening and Wednesday evening.Use Tuesday attendance as population 1 and Wednesday attendance as population 2 or  as the mean difference in matched-pairs sampling.
A)
B)
C)
D)
as the mean difference in matched-pairs sampling.A)
B)
C)
D)
Question
Exhibit 10.4.A 7000-seat theater is interested in determining whether there is a difference in attendance between shows on Tuesday evening and those on Wednesday evening.Two independent samples of 25 weeks are collected for Tuesday and Wednesday.The mean attendance on Tuesday evening is calculated as 5500,while the mean attendance on Wednesday evening is calculated as 5850.The known population standard deviation for attendance on Tuesday evening is 550 and the known population standard deviation for attendance on Wednesday evening is 445. Refer to Exhibit 10.4.Compute the value of the appropriate test statistic.
A)
B)
C)
D)
A)
B)
C)
D)
Question
Exhibit 10.3.A restaurant chain has two locations in a medium-sized town and,believing that it has oversaturated the market for its food,is considering closing one of the restaurants.The manager of the restaurant with a downtown location claims that his restaurant generates more revenue than the sister restaurant by the freeway.The CEO of this company,wishing to test this claim,randomly selects 36 monthly revenue totals for each restaurant.The revenue data from the downtown restaurant have a mean of $360,000 and a standard deviation of $50,000,while the data from the restaurant by the freeway have a mean of $340,000 and a standard deviation of $40,000.Assume there is no reason to believe the population standard deviations are equal,and let  and
and  denote the mean monthly revenue of the downtown restaurant and the restaurant by the freeway,respectively. Refer to Exhibit 10.3.Compute the value of the appropriate test statistic to analyze the claim.
A)
B)
C)
D)
and denote the mean monthly revenue of the downtown restaurant and the restaurant by the freeway,respectively. Refer to Exhibit 10.3.Compute the value of the appropriate test statistic to analyze the claim.A)
B)
C)
D)
Question
Exhibit 10.7.A stats professor at a large university hypothesizes that students who take statistics in the morning typically do better than those who take it in the afternoon.He takes independently random samples,each of size 36,consisting of students who took a morning and an afternoon class,and compares the scores of each group on a common final exam.He finds that the morning group scored an average of 74 with a standard deviation of 8,while the evening group scored an average of 68 with a standard deviation of 10.The population standard deviation of scores is unknown,but assumed to be equal for morning and evening classes.Let  and
and  represent the population mean final exam scores of statistics' courses offered in the morning and the afternoon,respectively Refer to Exhibit 10.7.Which if the following hypotheses will test the professor's claim?
A)
B)
C)
D)
and represent the population mean final exam scores of statistics' courses offered in the morning and the afternoon,respectively Refer to Exhibit 10.7.Which if the following hypotheses will test the professor's claim?A)
B)
C)
D)
Question
Question
Exhibit 10.9.A tutor promises to improve GMAT scores of students by more than 50 points after three lessons.To see if this is true,the tutor takes a sample of 49 students' test scores after and before they received tutoring.The mean difference was 53 points better after tutoring,with a standard deviation of the difference equal to 12 points.Let  denote the mean of the difference: score after tutoring minus score before tutoring. Refer to Exhibit 10.9.Assuming α = 0.05,which of the following is the appropriate critical value?
A)
B)
C)
D)
denote the mean of the difference: score after tutoring minus score before tutoring. Refer to Exhibit 10.9.Assuming α = 0.05,which of the following is the appropriate critical value?A)
B)
C)
D)
Question
A particular bank has two loan modification programs for distressed borrowers: Home Affordable Modification Program (HAMP)modifications,where the federal government pays the bank $1,000 for each successful modification,and non-HAMP modifications,where the bank does not receive a bonus from the federal government.In order to qualify for a HAMP modification,borrowers must meet a set of financial suitability criteria.Define the null and alternative hypotheses to test whether borrowers who receive HAMP modifications default less than borrowers who receive non-HAMP modifications.Let  and
and  represent the proportion of borrowers who received HAMP modifications that did not re-default,and the proportion of borrowers who received non-HAMP modifications that did not re-default,respectively
A)
B)
C)
D)
and represent the proportion of borrowers who received HAMP modifications that did not re-default,and the proportion of borrowers who received non-HAMP modifications that did not re-default,respectivelyA)
B)
C)
D)
Question
Exhibit 10.9.A tutor promises to improve GMAT scores of students by more than 50 points after three lessons.To see if this is true,the tutor takes a sample of 49 students' test scores after and before they received tutoring.The mean difference was 53 points better after tutoring,with a standard deviation of the difference equal to 12 points.Let  denote the mean of the difference: score after tutoring minus score before tutoring. Refer to Exhibit 10.9.Calculate the value of the test statistic.
A)
B)
C)
D)
denote the mean of the difference: score after tutoring minus score before tutoring. Refer to Exhibit 10.9.Calculate the value of the test statistic.A)
B)
C)
D)
Question
Exhibit 10.11.The student senate at a local university is about to hold elections.A representative from the women's sports program and a representative from the men's sports program must both be elected.Two candidates,an incumbent and a challenger,are vying for each position and early polling results are presented next.A hypothesis test must be performed to determine whether the percentages of supporting votes are different between the two incumbent candidates.In a sample of 100 voters,67 said that they would vote for the women's incumbent candidate.In a separate sample of 100 voters,55 said they would vote for the men's incumbent candidate.Let p1 and p2 be the proportions of supporting votes for the incumbent candidates representing women's and men's sports programs,respectively. Refer to Exhibit 10.11.What is the conclusion for the test at  ?
?
A)Reject H0: p1 = p2 and therefore conclude that the proportions differ.
B)Reject H0: p1 = p2 and therefore do not conclude that the proportions differ.
C)Do not reject H0: p1 = p2 and therefore conclude that the proportions differ.
D)Do not reject H0: p1 = p2 and therefore do not conclude that the proportions differ.
?A)Reject H0: p1 = p2 and therefore conclude that the proportions differ.
B)Reject H0: p1 = p2 and therefore do not conclude that the proportions differ.
C)Do not reject H0: p1 = p2 and therefore conclude that the proportions differ.
D)Do not reject H0: p1 = p2 and therefore do not conclude that the proportions differ.
Question
Question
Question
Question
Exhibit 10.13.A consumer magazine wants to figure out which of two major airlines lost a higher proportion of luggage on international flights.The magazine surveyed Standard Air (population 1)and Down Under airlines (population 2).Standard Air lost 45 out of 600 bags.Down Under airlines lost 30 of 500 bags.Does Standard Air have a higher population proportion of lost bags on international flights? Refer to Exhibit 10.13.Calculate the value of the test statistic.
A)
B)
C)
D)
A)
B)
C)
D)
Question
Exhibit 10.9.A tutor promises to improve GMAT scores of students by more than 50 points after three lessons.To see if this is true,the tutor takes a sample of 49 students' test scores after and before they received tutoring.The mean difference was 53 points better after tutoring,with a standard deviation of the difference equal to 12 points.Let  denote the mean of the difference: score after tutoring minus score before tutoring. Refer to Exhibit 10.9.Which of the following hypotheses will determine if the students improved their test scores by more than 50 points after being tutored?
A)
B)
C)
D)
denote the mean of the difference: score after tutoring minus score before tutoring. Refer to Exhibit 10.9.Which of the following hypotheses will determine if the students improved their test scores by more than 50 points after being tutored?A)
B)
C)
D)
Question
Exhibit 10.10.A bank is trying to determine which model of safe to install.The bank manager believes that each model is equally resistant to safe crackers,but sets up a test to be sure.He hires nine safe experts to break into each of the models,timing each endeavor.The results (in seconds)are given next,paired by expert.Let D be the difference: Time to break Safe 1 minus Time to break Safe 2. 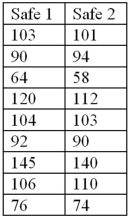 Refer to Exhibit 10.10.Should we conclude that the average time it takes experts to crack the safes does not differ by model at the 5% significance level?
A)Yes,the 95% confidence interval for μD contains 0.
B)No,the 95% confidence interval for μD does not contain 0.
C)No,the 95% confidence interval for μD contains 0,but the absolute value of the upper bound is larger than the absolute value of the lower bound.
D)Not enough information to determine.
Refer to Exhibit 10.10.Should we conclude that the average time it takes experts to crack the safes does not differ by model at the 5% significance level?A)Yes,the 95% confidence interval for μD contains 0.
B)No,the 95% confidence interval for μD does not contain 0.
C)No,the 95% confidence interval for μD contains 0,but the absolute value of the upper bound is larger than the absolute value of the lower bound.
D)Not enough information to determine.
Question
A particular bank has two loan modification programs for distressed borrowers: Home Affordable Modification Program (HAMP)modifications,where the federal government pays the bank $1,000 for each successful modification,and non-HAMP modifications,where the bank does not receive a bonus from the federal government.In order to qualify for a HAMP modification,borrowers must meet a set of financial suitability criteria.What type of hypothesis test should we use to test whether borrowers from this particular bank who receive HAMP modifications are more likely to re-default than those who receive non-HAMP modifications?
A)A hypothesis test for
B)A hypothesis test for
C)A matched-pairs hypothesis test for the population means.
D)A matched-pairs hypothesis test for the population proportions.
A)A hypothesis test for
B)A hypothesis test for
C)A matched-pairs hypothesis test for the population means.
D)A matched-pairs hypothesis test for the population proportions.
Question
Exhibit 10.9.A tutor promises to improve GMAT scores of students by more than 50 points after three lessons.To see if this is true,the tutor takes a sample of 49 students' test scores after and before they received tutoring.The mean difference was 53 points better after tutoring,with a standard deviation of the difference equal to 12 points.Let  denote the mean of the difference: score after tutoring minus score before tutoring. Refer to Exhibit 10.9.What is the appropriate conclusion at the 5% significance level?
A)Reject ,we can conclude that the mean difference in test scores after and before tutoring is greater than 50 points.
B)Reject ,we cannot conclude that the mean difference in test scores after and before tutoring is greater than 50 points.
C)Fail to reject ,we can conclude that the mean difference in test scores after and before tutoring is greater than 50 points.
D)Fail to reject
denote the mean of the difference: score after tutoring minus score before tutoring. Refer to Exhibit 10.9.What is the appropriate conclusion at the 5% significance level?A)Reject
,we can conclude that the mean difference in test scores after and before tutoring is greater than 50 points.B)Reject
,we cannot conclude that the mean difference in test scores after and before tutoring is greater than 50 points.C)Fail to reject
,we can conclude that the mean difference in test scores after and before tutoring is greater than 50 points.D)Fail to reject
Question
Exhibit 10.11.The student senate at a local university is about to hold elections.A representative from the women's sports program and a representative from the men's sports program must both be elected.Two candidates,an incumbent and a challenger,are vying for each position and early polling results are presented next.A hypothesis test must be performed to determine whether the percentages of supporting votes are different between the two incumbent candidates.In a sample of 100 voters,67 said that they would vote for the women's incumbent candidate.In a separate sample of 100 voters,55 said they would vote for the men's incumbent candidate.Let p1 and p2 be the proportions of supporting votes for the incumbent candidates representing women's and men's sports programs,respectively. Refer to Exhibit 10.11.What are the competing hypotheses to determine whether the percentages of supporting votes are different between the two incumbent candidates?
A)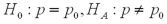
B)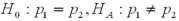
C)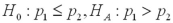
D)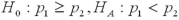
A)
B)
C)
D)
Question
Question
Exhibit 10.10.A bank is trying to determine which model of safe to install.The bank manager believes that each model is equally resistant to safe crackers,but sets up a test to be sure.He hires nine safe experts to break into each of the models,timing each endeavor.The results (in seconds)are given next,paired by expert.Let D be the difference: Time to break Safe 1 minus Time to break Safe 2. ![<strong>Exhibit 10.10.A bank is trying to determine which model of safe to install.The bank manager believes that each model is equally resistant to safe crackers,but sets up a test to be sure.He hires nine safe experts to break into each of the models,timing each endeavor.The results (in seconds)are given next,paired by expert.Let D be the difference: Time to break Safe 1 minus Time to break Safe 2. Refer to Exhibit 10.10.Assuming the difference D is normally distributed,what is the 95% confidence interval for μ<sub>D</sub>?</strong> A)[-1.7537,5.7537] B)[-1.1459,5.1459] C)[-0.6739,4.6739] D)[-0.5368,4.5368] <div style=padding-top: 35px>](https://storage.examlex.com/TB2339/11eaa4ae_7abf_db45_9180_bff3e21de3c4_TB2339_00.jpg) Refer to Exhibit 10.10.Assuming the difference D is normally distributed,what is the 95% confidence interval for μD?
Refer to Exhibit 10.10.Assuming the difference D is normally distributed,what is the 95% confidence interval for μD?
A)[-1.7537,5.7537]
B)[-1.1459,5.1459]
C)[-0.6739,4.6739]
D)[-0.5368,4.5368]
Refer to Exhibit 10.10.Assuming the difference D is normally distributed,what is the 95% confidence interval for μD?A)[-1.7537,5.7537]
B)[-1.1459,5.1459]
C)[-0.6739,4.6739]
D)[-0.5368,4.5368]
Question
In testing the difference between two population proportions under independent sampling,when do you pool the sample proportions and use the formula  ?
?
A)When the population proportions are assumed equal.
B)When the difference in the population proportions is hypothesized to be zero.
C)When the difference in the population proportions is hypothesized to be different than zero.
D)All of the above.
?A)When the population proportions are assumed equal.
B)When the difference in the population proportions is hypothesized to be zero.
C)When the difference in the population proportions is hypothesized to be different than zero.
D)All of the above.
Question
Question
Exhibit 10.8.A new sales training program has been instituted at a rent-to-own company.Prior to the training,10 employees were tested on their knowledge of products offered by the company.Once the training was completed,the employees were tested again in an effort to determine whether the training program was effective.Scores are known to be normally distributed.The sample scores on the tests are listed next.Use pre-test score as population 1 and post-test score as population 2,or  as the mean of the differences calculated as pre-test score minus post-test score.
  Refer to Exhibit 10.8.What is the conclusion for the test at
  ?
?
A)Given the critical value 1.645,we conclude that training increases scores.
B)Given the critical value 2.015,we conclude that training increases scores.
C)Given the critical value -2.015,we conclude that training increases scores.
D)Given the critical value -1.645,we conclude that training increases scores.
as the mean of the differences calculated as pre-test score minus post-test score. Refer to Exhibit 10.8.What is the conclusion for the test at ?A)Given the critical value 1.645,we conclude that training increases scores.
B)Given the critical value 2.015,we conclude that training increases scores.
C)Given the critical value -2.015,we conclude that training increases scores.
D)Given the critical value -1.645,we conclude that training increases scores.
Question
Exhibit 10.13.A consumer magazine wants to figure out which of two major airlines lost a higher proportion of luggage on international flights.The magazine surveyed Standard Air (population 1)and Down Under airlines (population 2).Standard Air lost 45 out of 600 bags.Down Under airlines lost 30 of 500 bags.Does Standard Air have a higher population proportion of lost bags on international flights? Refer to Exhibit 10.13.Specify the competing hypotheses.
A)
B)
C)
D)
A)
B)
C)
D)
Question
Exhibit 10.10.A bank is trying to determine which model of safe to install.The bank manager believes that each model is equally resistant to safe crackers,but sets up a test to be sure.He hires nine safe experts to break into each of the models,timing each endeavor.The results (in seconds)are given next,paired by expert.Let D be the difference: Time to break Safe 1 minus Time to break Safe 2.  Refer to Exhibit 10.10.Which of the following hypotheses will determine if the two safes take,on average,the same amount of time to crack?
A)
B)
C)
D)
Refer to Exhibit 10.10.Which of the following hypotheses will determine if the two safes take,on average,the same amount of time to crack?A)
B)
C)
D)

Unlock Deck
Sign up to unlock the cards in this deck!
Unlock Deck
Unlock Deck
1/104
Play
Full screen (f)
Deck 10: Statistical Inference Concerning Two Populations
1
When comparing two population means,their hypothesized difference ____________.
A)Must be negative
B)Must be positive
C)Must be zero
D)May assume any value
A)Must be negative
B)Must be positive
C)Must be zero
D)May assume any value
May assume any value
2
The difference between the two sample means is an interval estimator of the difference between two population means .
is an interval estimator of the difference between two population means .False
3
We always deal with matched-pairs sampling if two samples have the same number of observations.
False
4
We convert the estimate into the corresponding value of the z or t test statistic by dividing the difference between and the hypothesized difference by the standard error of the estimator .
into the corresponding value of the z or t test statistic by dividing the difference between and the hypothesized difference by the standard error of the estimator . Unlock Deck
Unlock for access to all 104 flashcards in this deck.
Unlock Deck
k this deck
5
In the case when and are unknown and can be assumed equal,we can calculate a pooled estimate of the population variance.
and are unknown and can be assumed equal,we can calculate a pooled estimate of the population variance. Unlock Deck
Unlock for access to all 104 flashcards in this deck.
Unlock Deck
k this deck
6
The necessary condition for a matched-pairs sample is that the same individual gets sampled twice.
Unlock Deck
Unlock for access to all 104 flashcards in this deck.
Unlock Deck
k this deck
7
If the underlying populations cannot be assumed to be normal,then by the central limit theorem,the sampling distribution of is approximately normal only if both sample sizes are sufficiently large-that is,when ____________.
A)
B)
C)
D)
is approximately normal only if both sample sizes are sufficiently large-that is,when ____________.A)
B)
C)
D)
Unlock Deck
Unlock for access to all 104 flashcards in this deck.
Unlock Deck
k this deck
8
The choice of an appropriate test for comparing two population means depends on whether we deal with ____________.
A)Qualitative or quantitative data
B)Independent or matched-pairs sampling
C)The equality or lack of equality of population variances
D)All of the above
A)Qualitative or quantitative data
B)Independent or matched-pairs sampling
C)The equality or lack of equality of population variances
D)All of the above
Unlock Deck
Unlock for access to all 104 flashcards in this deck.
Unlock Deck
k this deck
9
The margin of error in the confidence interval for the difference equals the standard error multiplied by either or ,depending on whether or not the population variances are known.
equals the standard error multiplied by either or ,depending on whether or not the population variances are known. Unlock Deck
Unlock for access to all 104 flashcards in this deck.
Unlock Deck
k this deck
10
What formula is used to calculate the degrees of freedom for the t test for comparing two population means when the population variances are unknown and unequal?
A)
B)
C)
D)
A)
B)
C)
D)
Unlock Deck
Unlock for access to all 104 flashcards in this deck.
Unlock Deck
k this deck
11
When calculating the standard error of ,under what assumption do you pool the sample variances and ?
A)Known population variances
B)Unknown population variances that are assumed equal
C)Unknown population variances that are assumed unequal
D)All of the above
,under what assumption do you pool the sample variances and ?A)Known population variances
B)Unknown population variances that are assumed equal
C)Unknown population variances that are assumed unequal
D)All of the above
Unlock Deck
Unlock for access to all 104 flashcards in this deck.
Unlock Deck
k this deck
12
The confidence interval for the difference is based on the same approach used in the case of one sample: Point Estimate ± Standard Error.
is based on the same approach used in the case of one sample: Point Estimate ± Standard Error. Unlock Deck
Unlock for access to all 104 flashcards in this deck.
Unlock Deck
k this deck
13
Which of the following pairs of hypotheses are used to test if the mean of the first population is smaller than the mean of the second population,using independent random sampling?
A)
B)
C)
D)
A)
B)
C)
D)
Unlock Deck
Unlock for access to all 104 flashcards in this deck.
Unlock Deck
k this deck
14
Two or more random samples are considered independent if ____________.
A)The process that generates one sample is the same as the process that generates the other sample
B)The process that generates one sample partially overlaps the process that generates the other sample
C)The process that generates one sample completely overlaps the process that generates the other sample
D)The process that generates one sample is completely separate from the process that generates the other sample
Unlock Deck
Unlock for access to all 104 flashcards in this deck.
Unlock Deck
k this deck
15
Which of the following is not a restriction for comparing two population means?
A)A normally distributed sampling distribution of
B)The equality of the sample sizes
C)Both A and B
D)Neither A or B
A)A normally distributed sampling distribution of
B)The equality of the sample sizes
C)Both A and B
D)Neither A or B
Unlock Deck
Unlock for access to all 104 flashcards in this deck.
Unlock Deck
k this deck
16
Suppose you want to perform a test to compare the mean GPA of all freshmen with the mean GPA of all sophomores in a college? What type of sampling is required for this test?
A)Independent sampling with qualitative data
B)Independent sampling with quantitative data
C)Matched-pairs sampling with qualitative data
D)Matched-pairs sampling with quantitative data
A)Independent sampling with qualitative data
B)Independent sampling with quantitative data
C)Matched-pairs sampling with qualitative data
D)Matched-pairs sampling with quantitative data
Unlock Deck
Unlock for access to all 104 flashcards in this deck.
Unlock Deck
k this deck
17
A demographer wants to measure life expectancy in countries 1 and 2.Let and denote the mean life expectancy in countries 1 and 2,respectively.Specify the hypothesis to determine if life expectancy in country 1 is more than 10 years lower than in country 2.
A)
B)
C)
D)
and denote the mean life expectancy in countries 1 and 2,respectively.Specify the hypothesis to determine if life expectancy in country 1 is more than 10 years lower than in country 2.A)
B)
C)
D)
Unlock Deck
Unlock for access to all 104 flashcards in this deck.
Unlock Deck
k this deck
18
For a statistical inference regarding ,it is imperative that the sampling distribution of is normally distributed.
,it is imperative that the sampling distribution of is normally distributed. Unlock Deck
Unlock for access to all 104 flashcards in this deck.
Unlock Deck
k this deck
19
If the underlying populations cannot be assumed to be normal,then by the central limit theorem,the sampling distribution of is approximately normal only if the sum of the sample observations is sufficiently large-that is,when .
is approximately normal only if the sum of the sample observations is sufficiently large-that is,when . Unlock Deck
Unlock for access to all 104 flashcards in this deck.
Unlock Deck
k this deck
20
Two random samples are considered independent if the observations in the first sample are different from the observations of the second sample.
Unlock Deck
Unlock for access to all 104 flashcards in this deck.
Unlock Deck
k this deck
21
In the test for comparing two population means when population variances are unknown and unequal,a student calculates the degrees of freedom using the proper formula as 34.7.How many degrees of freedom should the student assume to find the p-value of the test?
A)34
B)34.7
C)35
D)None of the Above
A)34
B)34.7
C)35
D)None of the Above
Unlock Deck
Unlock for access to all 104 flashcards in this deck.
Unlock Deck
k this deck
22
What type of data is required to compare prices of the same textbooks sold by two different vendors?
A)Dependent random samples with qualitative data
B)Dependent random samples with quantitative data
C)Independent random samples with qualitative data
D)Independent random samples with quantitative data
A)Dependent random samples with qualitative data
B)Dependent random samples with quantitative data
C)Independent random samples with qualitative data
D)Independent random samples with quantitative data
Unlock Deck
Unlock for access to all 104 flashcards in this deck.
Unlock Deck
k this deck
23
When testing the difference between two population means under independent sampling,we use the z distribution if ____________.
A)The population variances are known
B)The population variances are unknown,but assumed to be equal
C)The population variances are unknown and cannot be assumed equal
D)Both A and B
A)The population variances are known
B)The population variances are unknown,but assumed to be equal
C)The population variances are unknown and cannot be assumed equal
D)Both A and B
Unlock Deck
Unlock for access to all 104 flashcards in this deck.
Unlock Deck
k this deck
24
Assume the competing hypotheses take the following form: versus ,where is the population mean for population 1 and is the population mean for population 2.Also assume that the populations are normally distributed and we use independent sampling.The population variances are not known and cannot be assumed equal.The value of the appropriate test statistic is computed as ____________.
A)
B)
C)
D)
versus ,where is the population mean for population 1 and is the population mean for population 2.Also assume that the populations are normally distributed and we use independent sampling.The population variances are not known and cannot be assumed equal.The value of the appropriate test statistic is computed as ____________.A)
B)
C)
D)
Unlock Deck
Unlock for access to all 104 flashcards in this deck.
Unlock Deck
k this deck
25
If the sampling distribution of cannot be assumed normal,we _____________.
A)Are unable to compute a confidence interval
B)Are still able to use the z distribution to compute a confidence interval
C)Must use the t distribution with degrees of freedom to compute a confidence interval
D)Must use the t distribution and calculate the degrees of freedom using
cannot be assumed normal,we _____________.A)Are unable to compute a confidence interval
B)Are still able to use the z distribution to compute a confidence interval
C)Must use the t distribution with
degrees of freedom to compute a confidence intervalD)Must use the t distribution and calculate the degrees of freedom using
Unlock Deck
Unlock for access to all 104 flashcards in this deck.
Unlock Deck
k this deck
26
A particular bank has two loan modification programs for distressed borrowers: Home Affordable Modification Program (HAMP)modifications,where the federal government pays the bank $1,000 for each successful modification,and non-HAMP modifications,where the bank does not receive a bonus from the federal government.In order to qualify for a HAMP modification,borrowers must meet a set of financial suitability criteria.Define the null and alternative hypotheses to test whether borrowers who receive HAMP modifications default less than borrowers who receive non-HAMP modifications.Let and represent the proportion of borrowers who received HAMP and non-HAMP modifications that did not re-default,respectively.
A)
B)
C)
D)
and represent the proportion of borrowers who received HAMP and non-HAMP modifications that did not re-default,respectively.A)
B)
C)
D)
Unlock Deck
Unlock for access to all 104 flashcards in this deck.
Unlock Deck
k this deck
27
What type of data should be collected when examining a situation in which two candidates running in different elections are being compared in their likelihood of winning their elections?
A)Matched-pairs sampling with qualitative data
B)Matched-pairs sampling with quantitative data
C)Independent sampling with qualitative data
D)Independent sampling with quantitative data
A)Matched-pairs sampling with qualitative data
B)Matched-pairs sampling with quantitative data
C)Independent sampling with qualitative data
D)Independent sampling with quantitative data
Unlock Deck
Unlock for access to all 104 flashcards in this deck.
Unlock Deck
k this deck
28
A particular personal trainer works primarily with track and field athletes.She believes that her clients run faster after going through her program for six weeks.How might she test that claim?
A)A hypothesis test for .
B)A hypothesis test for .
C)A matched pairs hypothesis test for μD.
D)We are unable to conduct a hypothesis test since the samples would not be independent.
A)A hypothesis test for
.B)A hypothesis test for
.C)A matched pairs hypothesis test for μD.
D)We are unable to conduct a hypothesis test since the samples would not be independent.
Unlock Deck
Unlock for access to all 104 flashcards in this deck.
Unlock Deck
k this deck
29
Exhibit 10.1 A farmer uses a lot of fertilizer to grow his crops.The farmer's manager thinks fertilizer products from distributor A contain more of the nitrogen that his plants need than distributor B's fertilizer does.He takes two independent samples of four batches of fertilizer from each distributor and measures the amount of nitrogen in each batch.Fertilizer from distributor A contained 23 pounds per batch and fertilizer from distributor B contained 18 pounds per batch.Suppose the population standard deviation for distributor A and distributor B is four pounds per batch and five pounds per batch,respectively.Assume the distribution of nitrogen in fertilizer is normally distributed.Let and represent the average amount of nitrogen per batch for fertilizer's A and B,respectively. Refer to Exhibit 10.1.Calculate the appropriate p-value.
A)0.0592
B)0.0847
C)0.0896
D)0.1184
and represent the average amount of nitrogen per batch for fertilizer's A and B,respectively. Refer to Exhibit 10.1.Calculate the appropriate p-value.A)0.0592
B)0.0847
C)0.0896
D)0.1184
Unlock Deck
Unlock for access to all 104 flashcards in this deck.
Unlock Deck
k this deck
30
A particular bank has two loan modification programs for distressed borrowers: Home Affordable Modification Program (HAMP)modifications,where the federal government pays the bank $1,000 for each successful modification,and non-HAMP modifications,where the bank does not receive a bonus from the federal government.In order to qualify for a HAMP modification,borrowers must meet a set of financial suitability criteria.What type of hypothesis test should we use to test whether borrowers from this particular bank who receive HAMP modifications are more likely to re-default than those who receive non-HAMP modifications?
A)A hypothesis test for .
B)A hypothesis test for .
C)A matched-pairs hypothesis test.
D)We are unable to conduct a hypothesis test since independent random samples of each group could not be collected.
A)A hypothesis test for
.B)A hypothesis test for
.C)A matched-pairs hypothesis test.
D)We are unable to conduct a hypothesis test since independent random samples of each group could not be collected.
Unlock Deck
Unlock for access to all 104 flashcards in this deck.
Unlock Deck
k this deck
31
Exhibit 10.2.Calcium is an essential nutrient for strong bones and for controlling blood pressure and heart beat.Since most of the body's calcium is stored in bones and teeth,the body withdraws the calcium it needs from the bones.Over time,if more calcium is taken out of the bones than is put in,the result may be thin,weak bones.This is especially important for women who are often recommended a calcium supplement.A consumer group activist assumes that calcium content in two popular supplements are normally distributed with the same unknown population variance,and uses the following information obtained under independent sampling: Let μ1 and μ2 denote the corresponding population means. Refer to Exhibit 10.2.Construct a 95% confidence interval for the difference μ1 - μ2.
A)[-30.9386,1.0614]
B)[-31.5886,-0.4114]
C)[-33.8007,1.8007]
D)[-34.8012,2.8012]
Let μ1 and μ2 denote the corresponding population means. Refer to Exhibit 10.2.Construct a 95% confidence interval for the difference μ1 - μ2.A)[-30.9386,1.0614]
B)[-31.5886,-0.4114]
C)[-33.8007,1.8007]
D)[-34.8012,2.8012]
Unlock Deck
Unlock for access to all 104 flashcards in this deck.
Unlock Deck
k this deck
32
Which of the following set of hypotheses are used to test if the mean of the first population is smaller than the mean of the second population,using matched-paired sampling?
A)
B)
C)
D)
A)
B)
C)
D)
Unlock Deck
Unlock for access to all 104 flashcards in this deck.
Unlock Deck
k this deck
33
Assume the competing hypotheses take the following form: versus ,where is the population mean for population 1 and is the population mean for population 2.Also assume that the populations are normally distributed with known variances and we use independent sampling.The value of the appropriate test statistic is computed as ___________.
A)
B)
C)
D)
versus ,where is the population mean for population 1 and is the population mean for population 2.Also assume that the populations are normally distributed with known variances and we use independent sampling.The value of the appropriate test statistic is computed as ___________.A)
B)
C)
D)
Unlock Deck
Unlock for access to all 104 flashcards in this deck.
Unlock Deck
k this deck
34
What type of test for population means should be performed when examining a situation in which employees are first tested,then trained,and finally retested?
A)A z test under independent sampling with known population variances
B)A t test under independent sampling with unknown but equal population variances
C)A t test under dependent sampling
D)A t test under independent sampling with unknown and unequal population variances
A)A z test under independent sampling with known population variances
B)A t test under independent sampling with unknown but equal population variances
C)A t test under dependent sampling
D)A t test under independent sampling with unknown and unequal population variances
Unlock Deck
Unlock for access to all 104 flashcards in this deck.
Unlock Deck
k this deck
35
When the hypothesized difference of the population proportions is equal to 0,we ____________.
A)Use a matched-pairs approach
B)Are able to estimate the standard error of using the pooled
C)Can use the confidence interval to implement the test if the difference of the population proportions is equal to 0
D)Both B and C
A)Use a matched-pairs approach
B)Are able to estimate the standard error of
using the pooledC)Can use the confidence interval to implement the test if the difference of the population proportions is equal to 0
D)Both B and C
Unlock Deck
Unlock for access to all 104 flashcards in this deck.
Unlock Deck
k this deck
36
Exhibit 10.1 A farmer uses a lot of fertilizer to grow his crops.The farmer's manager thinks fertilizer products from distributor A contain more of the nitrogen that his plants need than distributor B's fertilizer does.He takes two independent samples of four batches of fertilizer from each distributor and measures the amount of nitrogen in each batch.Fertilizer from distributor A contained 23 pounds per batch and fertilizer from distributor B contained 18 pounds per batch.Suppose the population standard deviation for distributor A and distributor B is four pounds per batch and five pounds per batch,respectively.Assume the distribution of nitrogen in fertilizer is normally distributed.Let and represent the average amount of nitrogen per batch for fertilizer's A and B,respectively. Refer to Exhibit 10.1.Calculate the value of the test statistic.
A)
B)
C)
D)
and represent the average amount of nitrogen per batch for fertilizer's A and B,respectively. Refer to Exhibit 10.1.Calculate the value of the test statistic.A)
B)
C)
D)
Unlock Deck
Unlock for access to all 104 flashcards in this deck.
Unlock Deck
k this deck
37
You would like to determine if there is a higher incidence of smoking among women than among men in a neighborhood.Let men and women be represented by populations 1 and 2,respectively.The relevant hypotheses are constructed as _____________.
A)
B)
C)
D)
A)
B)
C)
D)
Unlock Deck
Unlock for access to all 104 flashcards in this deck.
Unlock Deck
k this deck
38
It is appropriate to conduct a hypothesis test for the difference between two population proportions under independent sampling:
A)In every case.
B)Only if and
.
C)Only if and
.
D)Only if
A)In every case.
B)Only if
and .C)Only if
and .D)Only if
Unlock Deck
Unlock for access to all 104 flashcards in this deck.
Unlock Deck
k this deck
39
You would like to determine if there is a higher incidence of smoking among women than among men in a neighborhood.Let women and men be represented by populations 1 and 2,respectively.The relevant hypotheses are constructed as ____________.
A)
B)
C)
D)
A)
B)
C)
D)
Unlock Deck
Unlock for access to all 104 flashcards in this deck.
Unlock Deck
k this deck
40
Assume the competing hypotheses take the following form: versus ,where is the population mean for population 1 and is the population mean for population 2.Also assume that the populations are normally distributed and that the observations in the two samples are independent.The population variances are not known but are assumed equal.The value of the appropriate test statistic is computed as ____________.
A)
B)
C)
D)
versus ,where is the population mean for population 1 and is the population mean for population 2.Also assume that the populations are normally distributed and that the observations in the two samples are independent.The population variances are not known but are assumed equal.The value of the appropriate test statistic is computed as ____________.A)
B)
C)
D)
Unlock Deck
Unlock for access to all 104 flashcards in this deck.
Unlock Deck
k this deck
41
Exhibit 10.6.A university wants to compare out-of-state applicants' mean SAT math scores (μ1)to instate applicants' mean SAT math scores (μ2).The university looks at 35 instate applicants and 35 out-of-state applicants.The mean SAT math score for instate applicants was 540,with a standard deviation of 20.The mean SAT math score for out-of-state applicants was 555,with a standard deviation of 25.It is reasonable to assume the corresponding population standard deviations are equal. Refer to Exhibit 10.6.At the 5% significance level,can the university conclude that the mean SAT math score for instate students and out-of-state students differ?
A)No,because the confidence interval contains zero.
B)Yes,because the confidence interval contains zero.
C)No,because the confidence interval does not contain zero.
D)Yes,because the confidence interval does not contain zero.
A)No,because the confidence interval contains zero.
B)Yes,because the confidence interval contains zero.
C)No,because the confidence interval does not contain zero.
D)Yes,because the confidence interval does not contain zero.
Unlock Deck
Unlock for access to all 104 flashcards in this deck.
Unlock Deck
k this deck
42
Exhibit 10.8.A new sales training program has been instituted at a rent-to-own company.Prior to the training,10 employees were tested on their knowledge of products offered by the company.Once the training was completed,the employees were tested again in an effort to determine whether the training program was effective.Scores are known to be normally distributed.The sample scores on the tests are listed next.Use pre-test score as population 1 and post-test score as population 2,or as the mean of the differences calculated as pre-test score minus post-test score. Refer to Exhibit 10.8.What are the appropriate hypotheses to determine if the training increases scores?
A)
B)
C)
D)
as the mean of the differences calculated as pre-test score minus post-test score. Refer to Exhibit 10.8.What are the appropriate hypotheses to determine if the training increases scores?A)
B)
C)
D)
Unlock Deck
Unlock for access to all 104 flashcards in this deck.
Unlock Deck
k this deck
43
Exhibit 10.4.A 7000-seat theater is interested in determining whether there is a difference in attendance between shows on Tuesday evening and those on Wednesday evening.Two independent samples of 25 weeks are collected for Tuesday and Wednesday.The mean attendance on Tuesday evening is calculated as 5500,while the mean attendance on Wednesday evening is calculated as 5850.The known population standard deviation for attendance on Tuesday evening is 550 and the known population standard deviation for attendance on Wednesday evening is 445. Refer to Exhibit 10.4.What is the appropriate decision given a 5% level of significance?
A)Conclude that the mean attendance differs since the p-value = 0.0067 < 0.05.
B)Conclude that the mean attendance differs since the p-value = 0.0134 < 0.05.
C)Do not conclude that the mean attendance differs since the p-value = 0.0067 < 0.05.
D)Do not conclude that the mean attendance differs since the p-value = 0.0134 < 0.05.
Unlock Deck
Unlock for access to all 104 flashcards in this deck.
Unlock Deck
k this deck
44
Exhibit 10.7.A stats professor at a large university hypothesizes that students who take statistics in the morning typically do better than those who take it in the afternoon.He takes independently random samples,each of size 36,consisting of students who took a morning and an afternoon class,and compares the scores of each group on a common final exam.He finds that the morning group scored an average of 74 with a standard deviation of 8,while the evening group scored an average of 68 with a standard deviation of 10.The population standard deviation of scores is unknown,but assumed to be equal for morning and evening classes.Let and represent the population mean final exam scores of statistics' courses offered in the morning and the afternoon,respectively. Refer to Exhibit 10.7.At the 1% significance level,does the evidence support the professor's claim?
A)No,since the test statistic is less than the critical value.
B)Yes,since the test statistic is less than the critical value.
C)No,since the test statistic is greater than the critical value.
D)Yes,since the test statistic is greater than the critical value.
and represent the population mean final exam scores of statistics' courses offered in the morning and the afternoon,respectively. Refer to Exhibit 10.7.At the 1% significance level,does the evidence support the professor's claim?A)No,since the test statistic is less than the critical value.
B)Yes,since the test statistic is less than the critical value.
C)No,since the test statistic is greater than the critical value.
D)Yes,since the test statistic is greater than the critical value.
Unlock Deck
Unlock for access to all 104 flashcards in this deck.
Unlock Deck
k this deck
45
Exhibit 10.5.A producer of fine chocolates believes that the sales of two varieties of truffles differ significantly during the holiday season.The first variety is milk chocolate while the second is milk chocolate filled with mint.It is reasonable to assume that truffle sales are normally distributed with unknown but equal population variances.Two independent samples of 18 observations each are collected for the holiday period.A sample mean of 12 million milk chocolate truffles sold with a sample standard deviation of 2.5 million.A sample mean of 13.5 million truffles filled with mint sold with a sample standard deviation of 2.3 million.Use milk chocolate as population 1 and mint chocolate as population 2. Refer to Exhibit 10.5.Assuming the population variances are equal,compute the value of the appropriate test statistic.
A)
B)
C)
D)
A)
B)
C)
D)
Unlock Deck
Unlock for access to all 104 flashcards in this deck.
Unlock Deck
k this deck
46
Exhibit 10.3.A restaurant chain has two locations in a medium-sized town and,believing that it has oversaturated the market for its food,is considering closing one of the restaurants.The manager of the restaurant with a downtown location claims that his restaurant generates more revenue than the sister restaurant by the freeway.The CEO of this company,wishing to test this claim,randomly selects 36 monthly revenue totals for each restaurant.The revenue data from the downtown restaurant have a mean of $360,000 and a standard deviation of $50,000,while the data from the restaurant by the freeway have a mean of $340,000 and a standard deviation of $40,000.Assume there is no reason to believe the population standard deviations are equal,and let and denote the mean monthly revenue of the downtown restaurant and the restaurant by the freeway,respectively. Refer to Exhibit 10.3.At the 5% significance level,does the evidence support the manager's claim?
A)No,since the test statistic value is less than the critical value.
B)Yes,since the test statistic value is less than the critical value.
C)No,since the test statistic value is greater than the critical value.
D)Yes,since the test statistic value is greater than the critical value.
and denote the mean monthly revenue of the downtown restaurant and the restaurant by the freeway,respectively. Refer to Exhibit 10.3.At the 5% significance level,does the evidence support the manager's claim?A)No,since the test statistic value is less than the critical value.
B)Yes,since the test statistic value is less than the critical value.
C)No,since the test statistic value is greater than the critical value.
D)Yes,since the test statistic value is greater than the critical value.
Unlock Deck
Unlock for access to all 104 flashcards in this deck.
Unlock Deck
k this deck
47
Exhibit 10.5.A producer of fine chocolates believes that the sales of two varieties of truffles differ significantly during the holiday season.The first variety is milk chocolate while the second is milk chocolate filled with mint.It is reasonable to assume that truffle sales are normally distributed with unknown but equal population variances.Two independent samples of 18 observations each are collected for the holiday period.A sample mean of 12 million milk chocolate truffles sold with a sample standard deviation of 2.5 million.A sample mean of 13.5 million truffles filled with mint sold with a sample standard deviation of 2.3 million.Use milk chocolate as population 1 and mint chocolate as population 2. Refer to Exhibit 10.5.What are the appropriate hypotheses to determine if the average sales of the two varieties of truffles differ significantly during the holiday season?
A)
B)
C)
D)
A)
B)
C)
D)
Unlock Deck
Unlock for access to all 104 flashcards in this deck.
Unlock Deck
k this deck
48
Exhibit 10.2.A restaurant chain has two locations in a medium-sized town and,believing that it has oversaturated the market for its food,is considering closing one of the restaurants.The manager of the restaurant with a downtown location claims that his restaurant generates more revenue than the sister restaurant by the freeway.The CEO of this company,wishing to test this claim,randomly selects 36 monthly revenue totals for each restaurant.The revenue data from the downtown restaurant have a mean of $360,000 and a standard deviation of $50,000,while the data from the restaurant by the freeway have a mean of $340,000 and a standard deviation of $40,000.Assume there is no reason to believe the population standard deviations are equal,and let and denote the mean monthly revenue of the downtown restaurant and the restaurant by the freeway,respectively. Refer to Exhibit 10.3.Specify the hypotheses to test the manager's claim.
A)
B)
C)
D)
and denote the mean monthly revenue of the downtown restaurant and the restaurant by the freeway,respectively. Refer to Exhibit 10.3.Specify the hypotheses to test the manager's claim.A)
B)
C)
D)
Unlock Deck
Unlock for access to all 104 flashcards in this deck.
Unlock Deck
k this deck
49
Exhibit 10.7.A stats professor at a large university hypothesizes that students who take statistics in the morning typically do better than those who take it in the afternoon.He takes independently random samples,each of size 36,consisting of students who took a morning and an afternoon class,and compares the scores of each group on a common final exam.He finds that the morning group scored an average of 74 with a standard deviation of 8,while the evening group scored an average of 68 with a standard deviation of 10.The population standard deviation of scores is unknown,but assumed to be equal for morning and evening classes.Let and represent the population mean final exam scores of statistics' courses offered in the morning and the afternoon,respectively Refer to Exhibit 10.7.Compute the appropriate test statistic to analyze the claim at the 1% significance level.
A)
B)
C)
D)
and represent the population mean final exam scores of statistics' courses offered in the morning and the afternoon,respectively Refer to Exhibit 10.7.Compute the appropriate test statistic to analyze the claim at the 1% significance level.A)
B)
C)
D)
Unlock Deck
Unlock for access to all 104 flashcards in this deck.
Unlock Deck
k this deck
50
Exhibit 10.2.Calcium is an essential nutrient for strong bones and for controlling blood pressure and heart beat.Since most of the body's calcium is stored in bones and teeth,the body withdraws the calcium it needs from the bones.Over time,if more calcium is taken out of the bones than is put in,the result may be thin,weak bones.This is especially important for women who are often recommended a calcium supplement.A consumer group activist assumes that calcium content in two popular supplements are normally distributed with the same unknown population variance,and uses the following information obtained under independent sampling: Let μ1 and μ2 denote the corresponding population means. Refer to Exhibit 10.2.Can we conclude that the average calcium content of the two supplements differs at the 95% confidence level?
A)No,since the 95% confidence interval contains the hypothesized value of zero.
B)Yes,since the 95% confidence interval contains the hypothesized value of zero.
C)No,since the 95% confidence interval does not contain the hypothesized value of zero.
D)Yes,since the 95% confidence interval does not contain the hypothesized value of zero.
Let μ1 and μ2 denote the corresponding population means. Refer to Exhibit 10.2.Can we conclude that the average calcium content of the two supplements differs at the 95% confidence level?A)No,since the 95% confidence interval contains the hypothesized value of zero.
B)Yes,since the 95% confidence interval contains the hypothesized value of zero.
C)No,since the 95% confidence interval does not contain the hypothesized value of zero.
D)Yes,since the 95% confidence interval does not contain the hypothesized value of zero.
Unlock Deck
Unlock for access to all 104 flashcards in this deck.
Unlock Deck
k this deck
51
Exhibit 10.7.A stats professor at a large university hypothesizes that students who take statistics in the morning typically do better than those who take it in the afternoon.He takes independently random samples,each of size 36,consisting of students who took a morning and an afternoon class,and compares the scores of each group on a common final exam.He finds that the morning group scored an average of 74 with a standard deviation of 8,while the evening group scored an average of 68 with a standard deviation of 10.The population standard deviation of scores is unknown,but assumed to be equal for morning and evening classes.Let and represent the population mean final exam scores of statistics' courses offered in the morning and the afternoon,respectively Refer to Exhibit 10.7.What is the appropriate critical value(s)to test the professor's claim at the 1% significance level?
A)-2.381 and 2.381
B)-2.326 and 2.326
C)2.326
D)2.381
and represent the population mean final exam scores of statistics' courses offered in the morning and the afternoon,respectively Refer to Exhibit 10.7.What is the appropriate critical value(s)to test the professor's claim at the 1% significance level?A)-2.381 and 2.381
B)-2.326 and 2.326
C)2.326
D)2.381
Unlock Deck
Unlock for access to all 104 flashcards in this deck.
Unlock Deck
k this deck
52
Exhibit 10.8.A new sales training program has been instituted at a rent-to-own company.Prior to the training,10 employees were tested on their knowledge of products offered by the company.Once the training was completed,the employees were tested again in an effort to determine whether the training program was effective.Scores are known to be normally distributed.The sample scores on the tests are listed next.Use pre-test score as population 1 and post-test score as population 2,or as the mean of the differences calculated as pre-test score minus post-test score. Refer to Exhibit 10.8.What is the value of the appropriate test statistic?
A)
B)
C)
D)
as the mean of the differences calculated as pre-test score minus post-test score. Refer to Exhibit 10.8.What is the value of the appropriate test statistic?A)
B)
C)
D)
Unlock Deck
Unlock for access to all 104 flashcards in this deck.
Unlock Deck
k this deck
53
Exhibit 10.6.A university wants to compare out-of-state applicants' mean SAT math scores (μ1)to instate applicants' mean SAT math scores (μ2).The university looks at 35 instate applicants and 35 out-of-state applicants.The mean SAT math score for instate applicants was 540,with a standard deviation of 20.The mean SAT math score for out-of-state applicants was 555,with a standard deviation of 25.It is reasonable to assume the corresponding population standard deviations are equal. Refer to Exhibit 10.6.To calculate the confidence interval for the difference μ1 - μ2,what is the number of degrees of freedom of the appropriate probability distribution?
A)64
B)64.87
C)68
D)69
A)64
B)64.87
C)68
D)69
Unlock Deck
Unlock for access to all 104 flashcards in this deck.
Unlock Deck
k this deck
54
Exhibit 10.5.A producer of fine chocolates believes that the sales of two varieties of truffles differ significantly during the holiday season.The first variety is milk chocolate while the second is milk chocolate filled with mint.It is reasonable to assume that truffle sales are normally distributed with unknown but equal population variances.Two independent samples of 18 observations each are collected for the holiday period.A sample mean of 12 million milk chocolate truffles sold with a sample standard deviation of 2.5 million.A sample mean of 13.5 million truffles filled with mint sold with a sample standard deviation of 2.3 million.Use milk chocolate as population 1 and mint chocolate as population 2. Refer to Exhibit 10.5.What is the appropriate decision given a 5% level of significance?
A)Conclude that the average milk chocolate and mint chocolate sales differ since the p-value is greater than 0.05.
B)Conclude that the average milk chocolate and mint chocolate sales do not differ since the p-value is less than 0.05.
C)Do not conclude that the average milk chocolate and mint chocolate sales differ since the p-value is greater than 0.05.
D)Do not conclude that the average milk chocolate and mint chocolate sales do not differ since the p-value is less than 0.05.
Unlock Deck
Unlock for access to all 104 flashcards in this deck.
Unlock Deck
k this deck
55
Exhibit 10.3.A restaurant chain has two locations in a medium-sized town and,believing that it has oversaturated the market for its food,is considering closing one of the restaurants.The manager of the restaurant with a downtown location claims that his restaurant generates more revenue than the sister restaurant by the freeway.The CEO of this company,wishing to test this claim,randomly selects 36 monthly revenue totals for each restaurant.The revenue data from the downtown restaurant have a mean of $360,000 and a standard deviation of $50,000,while the data from the restaurant by the freeway have a mean of $340,000 and a standard deviation of $40,000.Assume there is no reason to believe the population standard deviations are equal,and let and denote the mean monthly revenue of the downtown restaurant and the restaurant by the freeway,respectively. Refer to Exhibit 10.3.What is the appropriate critical value(s)to test the manager's claim at the 5% significance level?
A)1.645
B)1.668
C)1.960
D)1.997
and denote the mean monthly revenue of the downtown restaurant and the restaurant by the freeway,respectively. Refer to Exhibit 10.3.What is the appropriate critical value(s)to test the manager's claim at the 5% significance level?A)1.645
B)1.668
C)1.960
D)1.997
Unlock Deck
Unlock for access to all 104 flashcards in this deck.
Unlock Deck
k this deck
56
Exhibit 10.4.A 7000-seat theater is interested in determining whether there is a difference in attendance between shows on Tuesday evening and those on Wednesday evening.Two independent samples of 25 weeks are collected for Tuesday and Wednesday.The mean attendance on Tuesday evening is calculated as 5500,while the mean attendance on Wednesday evening is calculated as 5850.The known population standard deviation for attendance on Tuesday evening is 550 and the known population standard deviation for attendance on Wednesday evening is 445. Refer to Exhibit 10.4.What are the appropriate hypotheses to determine whether there is a difference in attendance for shows on Tuesday evening and Wednesday evening.Use Tuesday attendance as population 1 and Wednesday attendance as population 2 or as the mean difference in matched-pairs sampling.
A)
B)
C)
D)
as the mean difference in matched-pairs sampling.A)
B)
C)
D)
Unlock Deck
Unlock for access to all 104 flashcards in this deck.
Unlock Deck
k this deck
57
Exhibit 10.4.A 7000-seat theater is interested in determining whether there is a difference in attendance between shows on Tuesday evening and those on Wednesday evening.Two independent samples of 25 weeks are collected for Tuesday and Wednesday.The mean attendance on Tuesday evening is calculated as 5500,while the mean attendance on Wednesday evening is calculated as 5850.The known population standard deviation for attendance on Tuesday evening is 550 and the known population standard deviation for attendance on Wednesday evening is 445. Refer to Exhibit 10.4.Compute the value of the appropriate test statistic.
A)
B)
C)
D)
A)
B)
C)
D)
Unlock Deck
Unlock for access to all 104 flashcards in this deck.
Unlock Deck
k this deck
58
Exhibit 10.3.A restaurant chain has two locations in a medium-sized town and,believing that it has oversaturated the market for its food,is considering closing one of the restaurants.The manager of the restaurant with a downtown location claims that his restaurant generates more revenue than the sister restaurant by the freeway.The CEO of this company,wishing to test this claim,randomly selects 36 monthly revenue totals for each restaurant.The revenue data from the downtown restaurant have a mean of $360,000 and a standard deviation of $50,000,while the data from the restaurant by the freeway have a mean of $340,000 and a standard deviation of $40,000.Assume there is no reason to believe the population standard deviations are equal,and let and denote the mean monthly revenue of the downtown restaurant and the restaurant by the freeway,respectively. Refer to Exhibit 10.3.Compute the value of the appropriate test statistic to analyze the claim.
A)
B)
C)
D)
and denote the mean monthly revenue of the downtown restaurant and the restaurant by the freeway,respectively. Refer to Exhibit 10.3.Compute the value of the appropriate test statistic to analyze the claim.A)
B)
C)
D)
Unlock Deck
Unlock for access to all 104 flashcards in this deck.
Unlock Deck
k this deck
59
Exhibit 10.7.A stats professor at a large university hypothesizes that students who take statistics in the morning typically do better than those who take it in the afternoon.He takes independently random samples,each of size 36,consisting of students who took a morning and an afternoon class,and compares the scores of each group on a common final exam.He finds that the morning group scored an average of 74 with a standard deviation of 8,while the evening group scored an average of 68 with a standard deviation of 10.The population standard deviation of scores is unknown,but assumed to be equal for morning and evening classes.Let and represent the population mean final exam scores of statistics' courses offered in the morning and the afternoon,respectively Refer to Exhibit 10.7.Which if the following hypotheses will test the professor's claim?
A)
B)
C)
D)
and represent the population mean final exam scores of statistics' courses offered in the morning and the afternoon,respectively Refer to Exhibit 10.7.Which if the following hypotheses will test the professor's claim?A)
B)
C)
D)
Unlock Deck
Unlock for access to all 104 flashcards in this deck.
Unlock Deck
k this deck
60
Exhibit 10.6.A university wants to compare out-of-state applicants' mean SAT math scores (μ1)to instate applicants' mean SAT math scores (μ2).The university looks at 35 instate applicants and 35 out-of-state applicants.The mean SAT math score for instate applicants was 540,with a standard deviation of 20.The mean SAT math score for out-of-state applicants was 555,with a standard deviation of 25.It is reasonable to assume the corresponding population standard deviations are equal. Refer to Exhibit 10.6.Calculate a 95% confidence interval for the difference μ1 - μ2.
A)[-25.6067,-4.3933]
B)[-25.7961,-4.2039]
C)[-25.8124,-4.1876]
D)[-33.6105,3.6105]
A)[-25.6067,-4.3933]
B)[-25.7961,-4.2039]
C)[-25.8124,-4.1876]
D)[-33.6105,3.6105]
Unlock Deck
Unlock for access to all 104 flashcards in this deck.
Unlock Deck
k this deck
61
Exhibit 10.9.A tutor promises to improve GMAT scores of students by more than 50 points after three lessons.To see if this is true,the tutor takes a sample of 49 students' test scores after and before they received tutoring.The mean difference was 53 points better after tutoring,with a standard deviation of the difference equal to 12 points.Let denote the mean of the difference: score after tutoring minus score before tutoring. Refer to Exhibit 10.9.Assuming α = 0.05,which of the following is the appropriate critical value?
A)
B)
C)
D)
denote the mean of the difference: score after tutoring minus score before tutoring. Refer to Exhibit 10.9.Assuming α = 0.05,which of the following is the appropriate critical value?A)
B)
C)
D)
Unlock Deck
Unlock for access to all 104 flashcards in this deck.
Unlock Deck
k this deck
62
A particular bank has two loan modification programs for distressed borrowers: Home Affordable Modification Program (HAMP)modifications,where the federal government pays the bank $1,000 for each successful modification,and non-HAMP modifications,where the bank does not receive a bonus from the federal government.In order to qualify for a HAMP modification,borrowers must meet a set of financial suitability criteria.Define the null and alternative hypotheses to test whether borrowers who receive HAMP modifications default less than borrowers who receive non-HAMP modifications.Let and represent the proportion of borrowers who received HAMP modifications that did not re-default,and the proportion of borrowers who received non-HAMP modifications that did not re-default,respectively
A)
B)
C)
D)
and represent the proportion of borrowers who received HAMP modifications that did not re-default,and the proportion of borrowers who received non-HAMP modifications that did not re-default,respectivelyA)
B)
C)
D)
Unlock Deck
Unlock for access to all 104 flashcards in this deck.
Unlock Deck
k this deck
63
Exhibit 10.9.A tutor promises to improve GMAT scores of students by more than 50 points after three lessons.To see if this is true,the tutor takes a sample of 49 students' test scores after and before they received tutoring.The mean difference was 53 points better after tutoring,with a standard deviation of the difference equal to 12 points.Let denote the mean of the difference: score after tutoring minus score before tutoring. Refer to Exhibit 10.9.Calculate the value of the test statistic.
A)
B)
C)
D)
denote the mean of the difference: score after tutoring minus score before tutoring. Refer to Exhibit 10.9.Calculate the value of the test statistic.A)
B)
C)
D)
Unlock Deck
Unlock for access to all 104 flashcards in this deck.
Unlock Deck
k this deck
64
Exhibit 10.11.The student senate at a local university is about to hold elections.A representative from the women's sports program and a representative from the men's sports program must both be elected.Two candidates,an incumbent and a challenger,are vying for each position and early polling results are presented next.A hypothesis test must be performed to determine whether the percentages of supporting votes are different between the two incumbent candidates.In a sample of 100 voters,67 said that they would vote for the women's incumbent candidate.In a separate sample of 100 voters,55 said they would vote for the men's incumbent candidate.Let p1 and p2 be the proportions of supporting votes for the incumbent candidates representing women's and men's sports programs,respectively. Refer to Exhibit 10.11.What is the conclusion for the test at ?
A)Reject H0: p1 = p2 and therefore conclude that the proportions differ.
B)Reject H0: p1 = p2 and therefore do not conclude that the proportions differ.
C)Do not reject H0: p1 = p2 and therefore conclude that the proportions differ.
D)Do not reject H0: p1 = p2 and therefore do not conclude that the proportions differ.
?A)Reject H0: p1 = p2 and therefore conclude that the proportions differ.
B)Reject H0: p1 = p2 and therefore do not conclude that the proportions differ.
C)Do not reject H0: p1 = p2 and therefore conclude that the proportions differ.
D)Do not reject H0: p1 = p2 and therefore do not conclude that the proportions differ.
Unlock Deck
Unlock for access to all 104 flashcards in this deck.
Unlock Deck
k this deck
65
Exhibit 10.12.A veterinarian wants to know if pit bulls or golden retrievers have a higher incidence of tooth decay at the age of three.The vet surveys 120 three-year old pit bulls and finds 30 of them have tooth decay.The vet then surveys 160 three-year old golden retrievers and finds 32 of them have tooth decay.Number the population of pit bulls and golden retrievers by 1 and 2,respectively. Refer to Exhibit 10.12.Calculate a 90% confidence interval for the difference in the population proportion of pit bulls and golden retrievers that have tooth decay.Which of the following is correct?
A)[-0.0492,0.1492]
B)[-0.0332,0.1332]
C)[0.0199.0.0801]
D)[0.0428,0.0572]
A)[-0.0492,0.1492]
B)[-0.0332,0.1332]
C)[0.0199.0.0801]
D)[0.0428,0.0572]
Unlock Deck
Unlock for access to all 104 flashcards in this deck.
Unlock Deck
k this deck
66
Exhibit 10.12.A veterinarian wants to know if pit bulls or golden retrievers have a higher incidence of tooth decay at the age of three.The vet surveys 120 three-year old pit bulls and finds 30 of them have tooth decay.The vet then surveys 160 three-year old golden retrievers and finds 32 of them have tooth decay.Number the population of pit bulls and golden retrievers by 1 and 2,respectively. Refer to Exhibit 10.12.At the 10% significance level,can the vet conclude the proportion of pit bulls that have tooth decay is different than the proportion of golden retrievers that have tooth decay?
A)No,because the confidence interval contains zero.
B)Yes,because the confidence interval contains zero.
C)No,because the confidence interval does not contain zero.
D)Yes,because the confidence interval does not contain zero.
A)No,because the confidence interval contains zero.
B)Yes,because the confidence interval contains zero.
C)No,because the confidence interval does not contain zero.
D)Yes,because the confidence interval does not contain zero.
Unlock Deck
Unlock for access to all 104 flashcards in this deck.
Unlock Deck
k this deck
67
Exhibit 10.11.The student senate at a local university is about to hold elections.A representative from the women's sports program and a representative from the men's sports program must both be elected.Two candidates,an incumbent and a challenger,are vying for each position and early polling results are presented next.A hypothesis test must be performed to determine whether the percentages of supporting votes are different between the two incumbent candidates.In a sample of 100 voters,67 said that they would vote for the women's incumbent candidate.In a separate sample of 100 voters,55 said they would vote for the men's incumbent candidate.Let p1 and p2 be the proportions of supporting votes for the incumbent candidates representing women's and men's sports programs,respectively. Refer to Exhibit 10.11.Use a 5% level of significance to find the critical value (s)of the appropriate test.
A)1.645
B)1.960
C)-1.645 and +1.645
D)-1.960 and 1.960
A)1.645
B)1.960
C)-1.645 and +1.645
D)-1.960 and 1.960
Unlock Deck
Unlock for access to all 104 flashcards in this deck.
Unlock Deck
k this deck
68
Exhibit 10.13.A consumer magazine wants to figure out which of two major airlines lost a higher proportion of luggage on international flights.The magazine surveyed Standard Air (population 1)and Down Under airlines (population 2).Standard Air lost 45 out of 600 bags.Down Under airlines lost 30 of 500 bags.Does Standard Air have a higher population proportion of lost bags on international flights? Refer to Exhibit 10.13.Calculate the value of the test statistic.
A)
B)
C)
D)
A)
B)
C)
D)
Unlock Deck
Unlock for access to all 104 flashcards in this deck.
Unlock Deck
k this deck
69
Exhibit 10.9.A tutor promises to improve GMAT scores of students by more than 50 points after three lessons.To see if this is true,the tutor takes a sample of 49 students' test scores after and before they received tutoring.The mean difference was 53 points better after tutoring,with a standard deviation of the difference equal to 12 points.Let denote the mean of the difference: score after tutoring minus score before tutoring. Refer to Exhibit 10.9.Which of the following hypotheses will determine if the students improved their test scores by more than 50 points after being tutored?
A)
B)
C)
D)
denote the mean of the difference: score after tutoring minus score before tutoring. Refer to Exhibit 10.9.Which of the following hypotheses will determine if the students improved their test scores by more than 50 points after being tutored?A)
B)
C)
D)
Unlock Deck
Unlock for access to all 104 flashcards in this deck.
Unlock Deck
k this deck
70
Exhibit 10.10.A bank is trying to determine which model of safe to install.The bank manager believes that each model is equally resistant to safe crackers,but sets up a test to be sure.He hires nine safe experts to break into each of the models,timing each endeavor.The results (in seconds)are given next,paired by expert.Let D be the difference: Time to break Safe 1 minus Time to break Safe 2. Refer to Exhibit 10.10.Should we conclude that the average time it takes experts to crack the safes does not differ by model at the 5% significance level?
A)Yes,the 95% confidence interval for μD contains 0.
B)No,the 95% confidence interval for μD does not contain 0.
C)No,the 95% confidence interval for μD contains 0,but the absolute value of the upper bound is larger than the absolute value of the lower bound.
D)Not enough information to determine.
Refer to Exhibit 10.10.Should we conclude that the average time it takes experts to crack the safes does not differ by model at the 5% significance level?A)Yes,the 95% confidence interval for μD contains 0.
B)No,the 95% confidence interval for μD does not contain 0.
C)No,the 95% confidence interval for μD contains 0,but the absolute value of the upper bound is larger than the absolute value of the lower bound.
D)Not enough information to determine.
Unlock Deck
Unlock for access to all 104 flashcards in this deck.
Unlock Deck
k this deck
71
A particular bank has two loan modification programs for distressed borrowers: Home Affordable Modification Program (HAMP)modifications,where the federal government pays the bank $1,000 for each successful modification,and non-HAMP modifications,where the bank does not receive a bonus from the federal government.In order to qualify for a HAMP modification,borrowers must meet a set of financial suitability criteria.What type of hypothesis test should we use to test whether borrowers from this particular bank who receive HAMP modifications are more likely to re-default than those who receive non-HAMP modifications?
A)A hypothesis test for
B)A hypothesis test for
C)A matched-pairs hypothesis test for the population means.
D)A matched-pairs hypothesis test for the population proportions.
A)A hypothesis test for
B)A hypothesis test for
C)A matched-pairs hypothesis test for the population means.
D)A matched-pairs hypothesis test for the population proportions.
Unlock Deck
Unlock for access to all 104 flashcards in this deck.
Unlock Deck
k this deck
72
Exhibit 10.9.A tutor promises to improve GMAT scores of students by more than 50 points after three lessons.To see if this is true,the tutor takes a sample of 49 students' test scores after and before they received tutoring.The mean difference was 53 points better after tutoring,with a standard deviation of the difference equal to 12 points.Let denote the mean of the difference: score after tutoring minus score before tutoring. Refer to Exhibit 10.9.What is the appropriate conclusion at the 5% significance level?
A)Reject ,we can conclude that the mean difference in test scores after and before tutoring is greater than 50 points.
B)Reject ,we cannot conclude that the mean difference in test scores after and before tutoring is greater than 50 points.
C)Fail to reject ,we can conclude that the mean difference in test scores after and before tutoring is greater than 50 points.
D)Fail to reject
denote the mean of the difference: score after tutoring minus score before tutoring. Refer to Exhibit 10.9.What is the appropriate conclusion at the 5% significance level?A)Reject
,we can conclude that the mean difference in test scores after and before tutoring is greater than 50 points.B)Reject
,we cannot conclude that the mean difference in test scores after and before tutoring is greater than 50 points.C)Fail to reject
,we can conclude that the mean difference in test scores after and before tutoring is greater than 50 points.D)Fail to reject
Unlock Deck
Unlock for access to all 104 flashcards in this deck.
Unlock Deck
k this deck
73
Exhibit 10.11.The student senate at a local university is about to hold elections.A representative from the women's sports program and a representative from the men's sports program must both be elected.Two candidates,an incumbent and a challenger,are vying for each position and early polling results are presented next.A hypothesis test must be performed to determine whether the percentages of supporting votes are different between the two incumbent candidates.In a sample of 100 voters,67 said that they would vote for the women's incumbent candidate.In a separate sample of 100 voters,55 said they would vote for the men's incumbent candidate.Let p1 and p2 be the proportions of supporting votes for the incumbent candidates representing women's and men's sports programs,respectively. Refer to Exhibit 10.11.What are the competing hypotheses to determine whether the percentages of supporting votes are different between the two incumbent candidates?
A)
B)
C)
D)
A)
B)
C)
D)
Unlock Deck
Unlock for access to all 104 flashcards in this deck.
Unlock Deck
k this deck
74
Exhibit 10.11.The student senate at a local university is about to hold elections.A representative from the women's sports program and a representative from the men's sports program must both be elected.Two candidates,an incumbent and a challenger,are vying for each position and early polling results are presented next.A hypothesis test must be performed to determine whether the percentages of supporting votes are different between the two incumbent candidates.In a sample of 100 voters,67 said that they would vote for the women's incumbent candidate.In a separate sample of 100 voters,55 said they would vote for the men's incumbent candidate.Let p1 and p2 be the proportions of supporting votes for the incumbent candidates representing women's and men's sports programs,respectively. Refer to Exhibit 10.11.What type of a hypothesis test must be performed to determine whether the percentages of supporting votes are different between the two incumbent candidates?
A)A z test of two sample proportions with a zero hypothesized difference
B)A t test of two population proportions with a zero hypothesized difference
C)A z test of two population proportions with a zero hypothesized difference
D)A t test of two population proportions with a non-zero hypothesized difference
Unlock Deck
Unlock for access to all 104 flashcards in this deck.
Unlock Deck
k this deck
75
Exhibit 10.10.A bank is trying to determine which model of safe to install.The bank manager believes that each model is equally resistant to safe crackers,but sets up a test to be sure.He hires nine safe experts to break into each of the models,timing each endeavor.The results (in seconds)are given next,paired by expert.Let D be the difference: Time to break Safe 1 minus Time to break Safe 2. Refer to Exhibit 10.10.Assuming the difference D is normally distributed,what is the 95% confidence interval for μD?
A)[-1.7537,5.7537]
B)[-1.1459,5.1459]
C)[-0.6739,4.6739]
D)[-0.5368,4.5368]
Refer to Exhibit 10.10.Assuming the difference D is normally distributed,what is the 95% confidence interval for μD?A)[-1.7537,5.7537]
B)[-1.1459,5.1459]
C)[-0.6739,4.6739]
D)[-0.5368,4.5368]
Unlock Deck
Unlock for access to all 104 flashcards in this deck.
Unlock Deck
k this deck
76
In testing the difference between two population proportions under independent sampling,when do you pool the sample proportions and use the formula ?
A)When the population proportions are assumed equal.
B)When the difference in the population proportions is hypothesized to be zero.
C)When the difference in the population proportions is hypothesized to be different than zero.
D)All of the above.
?A)When the population proportions are assumed equal.
B)When the difference in the population proportions is hypothesized to be zero.
C)When the difference in the population proportions is hypothesized to be different than zero.
D)All of the above.
Unlock Deck
Unlock for access to all 104 flashcards in this deck.
Unlock Deck
k this deck
77
A coach is examining two basketball players' free-throw percentages over the last few games.Bob made 34 out of 85 shots and Joe made 72 out of 125 shots.The coach wants to know if Bob is a 10% worse free-throw shooter than Joe.Which of the following would be the p-value of the corresponding test?
A)0.1364
B)0.2728
C)0.4322
D)0.4544
A)0.1364
B)0.2728
C)0.4322
D)0.4544
Unlock Deck
Unlock for access to all 104 flashcards in this deck.
Unlock Deck
k this deck
78
Exhibit 10.8.A new sales training program has been instituted at a rent-to-own company.Prior to the training,10 employees were tested on their knowledge of products offered by the company.Once the training was completed,the employees were tested again in an effort to determine whether the training program was effective.Scores are known to be normally distributed.The sample scores on the tests are listed next.Use pre-test score as population 1 and post-test score as population 2,or as the mean of the differences calculated as pre-test score minus post-test score. Refer to Exhibit 10.8.What is the conclusion for the test at ?
A)Given the critical value 1.645,we conclude that training increases scores.
B)Given the critical value 2.015,we conclude that training increases scores.
C)Given the critical value -2.015,we conclude that training increases scores.
D)Given the critical value -1.645,we conclude that training increases scores.
as the mean of the differences calculated as pre-test score minus post-test score. Refer to Exhibit 10.8.What is the conclusion for the test at ?A)Given the critical value 1.645,we conclude that training increases scores.
B)Given the critical value 2.015,we conclude that training increases scores.
C)Given the critical value -2.015,we conclude that training increases scores.
D)Given the critical value -1.645,we conclude that training increases scores.
Unlock Deck
Unlock for access to all 104 flashcards in this deck.
Unlock Deck
k this deck
79
Exhibit 10.13.A consumer magazine wants to figure out which of two major airlines lost a higher proportion of luggage on international flights.The magazine surveyed Standard Air (population 1)and Down Under airlines (population 2).Standard Air lost 45 out of 600 bags.Down Under airlines lost 30 of 500 bags.Does Standard Air have a higher population proportion of lost bags on international flights? Refer to Exhibit 10.13.Specify the competing hypotheses.
A)
B)
C)
D)
A)
B)
C)
D)
Unlock Deck
Unlock for access to all 104 flashcards in this deck.
Unlock Deck
k this deck
80
Exhibit 10.10.A bank is trying to determine which model of safe to install.The bank manager believes that each model is equally resistant to safe crackers,but sets up a test to be sure.He hires nine safe experts to break into each of the models,timing each endeavor.The results (in seconds)are given next,paired by expert.Let D be the difference: Time to break Safe 1 minus Time to break Safe 2. Refer to Exhibit 10.10.Which of the following hypotheses will determine if the two safes take,on average,the same amount of time to crack?
A)
B)
C)
D)
Refer to Exhibit 10.10.Which of the following hypotheses will determine if the two safes take,on average,the same amount of time to crack?A)
B)
C)
D)
Unlock Deck
Unlock for access to all 104 flashcards in this deck.
Unlock Deck
k this deck
Unlock Deck
Unlock for access to all 104 flashcards in this deck.


