Deck 3: Numerical Descriptive Measures
Full screen (f)
Question
Question
Question
Question
Question
Question
Question
Question
Question
Question
Question
Question
Question
Question
Question
Question
Question
Question
Question
Question
Question
Question
Question
Question
As of September 30,2011,the earnings per share,EPS,of five firms in the beverages industry are as follows:  The 25th percentile and the 75th percentile of the EPS are closest to:
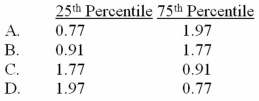
A)Option A
B)Option B
C)Option C
D)Option D
The 25th percentile and the 75th percentile of the EPS are closest to: A)Option A
B)Option B
C)Option C
D)Option D
Question
Question
Question
Question
The table below gives the deviations of a portfolio's annual total returns from its benchmark's annual returns,for a 6-year period ending in 2011. 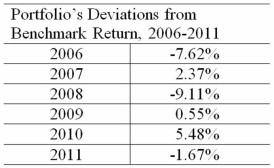 The arithmetic mean return and median return are closest to:
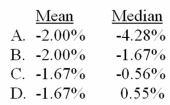
A)Option A
B)Option B
C)Option C
D)Option D
The arithmetic mean return and median return are closest to: A)Option A
B)Option B
C)Option C
D)Option D
Question
Question
Question
Question
The following data represent monthly returns (in percent):  The geometric mean return is closest to:
A)- 0.43%.
B)0.78%.
C)0.94%.
D)4.79%.
The geometric mean return is closest to:A)- 0.43%.
B)0.78%.
C)0.94%.
D)4.79%.
Question
Question
Question
Question
Question
Question
Question
Question
Question
The sample data below shows the number of hours spent by 5 students over the weekend to prepare for Monday's Business Statistics exam.  The sample standard deviation of the number of hours spent by the 5 students is closest to:
A)3.6 hours
B)4.1 hours
C)13.2 hours
D)16.5 hours
The sample standard deviation of the number of hours spent by the 5 students is closest to:A)3.6 hours
B)4.1 hours
C)13.2 hours
D)16.5 hours
Question
Consider a population with data values of  . The population variance is closest to:
A)8.00
B)8.64
C)64.00
D)74.67
. The population variance is closest to:A)8.00
B)8.64
C)64.00
D)74.67
Question
Question
The annual returns (in percent)for a sample of stocks in the technology industry over the past year are as follows:  The median return is closest to:
A)-6.6
B)-5
C)0
D)2.8
The median return is closest to:A)-6.6
B)-5
C)0
D)2.8
Question
A bowler's scores for a sample of six games were  The bowler's average score is:
A)172
B)174
C)178
D)190
The bowler's average score is:A)172
B)174
C)178
D)190
Question
An analyst gathered the following information about the net profit margins of companies in two industries: 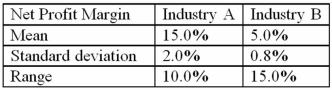 Compared with the other industry,the relative dispersion of net profit margins is smaller for Industry:
A)B,because it has a smaller mean deviation.
B)B,because it has a smaller range of variation.
C)A,because it has a smaller standard deviation.
D)A,because it has a smaller coefficient of variation.
Compared with the other industry,the relative dispersion of net profit margins is smaller for Industry:A)B,because it has a smaller mean deviation.
B)B,because it has a smaller range of variation.
C)A,because it has a smaller standard deviation.
D)A,because it has a smaller coefficient of variation.
Question
A bowler's scores for a sample of six games were  The bowler's modal score is:
A)172
B)174
C)178
D)190
The bowler's modal score is:A)172
B)174
C)178
D)190
Question
The sample data below shows the number of hours spent by 5 students over the weekend to prepare for Monday's Business Statistics exam.  The mean and the median of the numbers of hours spent by the 5 students are
A)2 hours and 5 hours,respectively
B)3 hours and 5 hours,respectively
C)5 hours and 2 hours,respectively
D)5 hours and 3 hours,respectively
The mean and the median of the numbers of hours spent by the 5 students areA)2 hours and 5 hours,respectively
B)3 hours and 5 hours,respectively
C)5 hours and 2 hours,respectively
D)5 hours and 3 hours,respectively
Question
Consider a population with data values of  . The median is:
A)12
B)14
C)18
D)22
. The median is:A)12
B)14
C)18
D)22
Question
The sample data below shows the number of hours spent by 5 students over the weekend to prepare for Monday's Business Statistics exam.  The 75th percentile of the data is closest to:
A)3 hours
B)4.5 hours
C)8.5 hours
D)10 hours
The 75th percentile of the data is closest to:A)3 hours
B)4.5 hours
C)8.5 hours
D)10 hours
Question
The annual returns (in percent)for a sample of stocks in the technology industry over the past year are as follows:  The sample standard deviation is closest to:
A)7.59
B)8.49
C)57.61
D)72.01
The sample standard deviation is closest to:A)7.59
B)8.49
C)57.61
D)72.01
Question
Consider a population with data values of  . The mode is:
A)12
B)14
C)18
D)22
. The mode is:A)12
B)14
C)18
D)22
Question
The sample data below shows the number of hours spent by 5 students over the weekend to prepare for Monday's Business Statistics exam.  The interquartile range of the data is closest to:
A)4 hours
B)6 hours
C)10 hours
D)12 hours
The interquartile range of the data is closest to:A)4 hours
B)6 hours
C)10 hours
D)12 hours
Question
The annual returns (in percent)for a sample of stocks in the technology industry over the past year are as follows:  The average return is closest to:
A)-6.6
B)-5
C)0
D)2.8
The average return is closest to:A)-6.6
B)-5
C)0
D)2.8
Question
A bowler's scores for a sample of six games were  The bowler's median score is:
A)172
B)174
C)178
D)190
The bowler's median score is:A)172
B)174
C)178
D)190
Question
Question
Consider a population with data values of  . The population standard deviation is closest to:
A)8.00
B)8.64
C)64.00
D)74.67
. The population standard deviation is closest to:A)8.00
B)8.64
C)64.00
D)74.67
Question
Question
Consider a population with data values of  . The population mean is:
A)12
B)14
C)18
D)22
. The population mean is:A)12
B)14
C)18
D)22
Question
A bowler's scores for a sample of six games were  The sample standard deviation is closest to:
A)8.00
B)8.64
C)64.00
D)74.67
The sample standard deviation is closest to:A)8.00
B)8.64
C)64.00
D)74.67
Question
A portfolio's annual total returns (in percent)for a 5-year period are:  The median and the standard deviation for this sample are closest to:
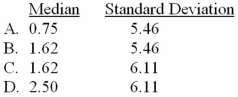
A)Option A
B)Option B
C)Option C
D)Option D
The median and the standard deviation for this sample are closest to: A)Option A
B)Option B
C)Option C
D)Option D
Question
The table below gives statistics relating to a hypothetical 10-year record of two portfolios.Assume other statistics relating to these portfolios are the same and the risk-free rate is 3.5%.Using the coefficient of variation and the Sharpe ratio,the fund that is preferred in terms of relative risk and return per unit of risk is 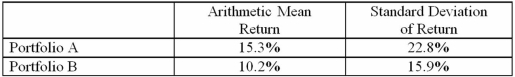
A)Portfolio A since it has a higher coefficient of variation and a lower Sharpe ratio.
B)Portfolio A since it has a lower coefficient of variation and a higher Sharpe ratio.
C)Portfolio B since it has a higher coefficient of variation and a lower Sharpe ratio.
D)Portfolio B since it has a lower coefficient of variation and a higher Sharper ratio.
Question
Question
Question
Question
Question
Question
Question
Question
Question
Question
A college professor collected data on the number of hours spent by his 100 students over the weekend to prepare for Monday's Business Statistics exam.He processed the data by Excel and the following incomplete output is available.  The median is most likely to be
A)About 7 hours.
B)Less than 7 hours.
C)Greater than 7 hours.
D)Cannot tell from the information provided.
The median is most likely to beA)About 7 hours.
B)Less than 7 hours.
C)Greater than 7 hours.
D)Cannot tell from the information provided.
Question
Question
Question
Question
Question
Question
A college professor collected data on the number of hours spent by his 100 students over the weekend to prepare for Monday's Business Statistics exam.He processed the data by Excel and the following incomplete output is available. 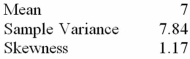 The coefficient of variation in the data is
A)40%.
B)90%.
C)111%.
D)243%.
The coefficient of variation in the data isA)40%.
B)90%.
C)111%.
D)243%.
Question
Which of the following is true when using the empirical rule for a set of sample data?
A)Almost all observations are in the interval .
.
B)Approximately 68% of all observations are in the interval .
.
C)Approximately 95% of all observations are in the interval .
.
D)Approximately 68% of all observations are in the interval
A)Almost all observations are in the interval
.B)Approximately 68% of all observations are in the interval
.C)Approximately 95% of all observations are in the interval
.D)Approximately 68% of all observations are in the interval
Question
As of September 30,2011,the earnings per share,EPS,of five firms in the biotechnology industry are as follows:  The sample mean and the sample standard deviation are closest to:
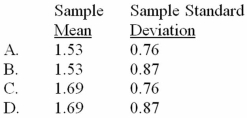
A)Option A
B)Option B
C)Option C
D)Option D
The sample mean and the sample standard deviation are closest to: A)Option A
B)Option B
C)Option C
D)Option D

Unlock Deck
Sign up to unlock the cards in this deck!
Unlock Deck
Unlock Deck
1/123
Play
Full screen (f)
Deck 3: Numerical Descriptive Measures
1
The geometric mean is a multiplicative average of a data set.
True
2
Chebyshev's theorem is only applicable for sample data.
False
3
The variance and standard deviation are the most widely used measures of central location.
False
4
The coefficient of variation is a unit free measure of dispersion.
Unlock Deck
Unlock for access to all 123 flashcards in this deck.
Unlock Deck
k this deck
5
The terms central location or central tendency refer to the way quantitative data tend to cluster around some middle or central value.
Unlock Deck
Unlock for access to all 123 flashcards in this deck.
Unlock Deck
k this deck
6
A box plot is useful when comparing similar information gathered at different places or times.
Unlock Deck
Unlock for access to all 123 flashcards in this deck.
Unlock Deck
k this deck
7
The empirical rule is only applicable for approximately bell-shaped data.
Unlock Deck
Unlock for access to all 123 flashcards in this deck.
Unlock Deck
k this deck
8
The standard deviation is the positive square root of the variance.
Unlock Deck
Unlock for access to all 123 flashcards in this deck.
Unlock Deck
k this deck
9
Approximately 60% of the observations in a data set fall below the 60th percentile.
Unlock Deck
Unlock for access to all 123 flashcards in this deck.
Unlock Deck
k this deck
10
The MAD is a less effective measure of variation when compared with the average deviation from the mean.
Unlock Deck
Unlock for access to all 123 flashcards in this deck.
Unlock Deck
k this deck
11
In a data set,an outlier is a large or small value regarded as an extreme value in the data set.
Unlock Deck
Unlock for access to all 123 flashcards in this deck.
Unlock Deck
k this deck
12
The variance is an average squared deviation from the mean.
Unlock Deck
Unlock for access to all 123 flashcards in this deck.
Unlock Deck
k this deck
13
The median is defined as…
A)The middle point in a data set.
B)The geometric average of a data set.
C)The arithmetic average of a data set.
D)The most common value of a data set.
A)The middle point in a data set.
B)The geometric average of a data set.
C)The arithmetic average of a data set.
D)The most common value of a data set.
Unlock Deck
Unlock for access to all 123 flashcards in this deck.
Unlock Deck
k this deck
14
The Sharpe ratio measures the extra reward per unit of risk.
Unlock Deck
Unlock for access to all 123 flashcards in this deck.
Unlock Deck
k this deck
15
How do we find the median if the number of observations in a data set is odd?
A)By averaging the first and the third quartile
B)By taking the middle value in the sorted data set
C)By averaging the minimum and maximum values
D)By taking the middle value in the sorted data set after eliminating outliers
A)By averaging the first and the third quartile
B)By taking the middle value in the sorted data set
C)By averaging the minimum and maximum values
D)By taking the middle value in the sorted data set after eliminating outliers
Unlock Deck
Unlock for access to all 123 flashcards in this deck.
Unlock Deck
k this deck
16
Mean-variance analysis suggests that investments with lower average returns are also associated with higher risks.
Unlock Deck
Unlock for access to all 123 flashcards in this deck.
Unlock Deck
k this deck
17
The median is not always the 50th percentile.
Unlock Deck
Unlock for access to all 123 flashcards in this deck.
Unlock Deck
k this deck
18
Which of the following is most influenced by outliers?
A)Mode
B)Median
C)75th Percentile
D)Arithmetic mean
A)Mode
B)Median
C)75th Percentile
D)Arithmetic mean
Unlock Deck
Unlock for access to all 123 flashcards in this deck.
Unlock Deck
k this deck
19
The arithmetic mean is the middle value of a data set.
Unlock Deck
Unlock for access to all 123 flashcards in this deck.
Unlock Deck
k this deck
20
The mode is defined as…
A)The middle point in a data set.
B)The geometric average of a data set.
C)The arithmetic average of a data set.
D)The most frequent value in a data set.
A)The middle point in a data set.
B)The geometric average of a data set.
C)The arithmetic average of a data set.
D)The most frequent value in a data set.
Unlock Deck
Unlock for access to all 123 flashcards in this deck.
Unlock Deck
k this deck
21
Total Revenue,in $millions,for Apple Computers was 42,905 in 2009,65,225 in 2010,and 108,249 in 2011.The average growth rate of revenue during these three years is closest to:
A)36.13%
B)39.33%
C)58.84%
D)58.99%
A)36.13%
B)39.33%
C)58.84%
D)58.99%
Unlock Deck
Unlock for access to all 123 flashcards in this deck.
Unlock Deck
k this deck
22
How do you define the range?
A)Q3 - Q1
B)Max - Q1
C)Max - Min
D)Max - Median
A)Q3 - Q1
B)Max - Q1
C)Max - Min
D)Max - Median
Unlock Deck
Unlock for access to all 123 flashcards in this deck.
Unlock Deck
k this deck
23
Consider the following data: 1,2,4,5,10,12,18.The 30th percentile is closest to:
A)2.0
B)2.4
C)2.8
D)5.0
A)2.0
B)2.4
C)2.8
D)5.0
Unlock Deck
Unlock for access to all 123 flashcards in this deck.
Unlock Deck
k this deck
24
As of September 30,2011,the earnings per share,EPS,of five firms in the beverages industry are as follows: The 25th percentile and the 75th percentile of the EPS are closest to:
A)Option A
B)Option B
C)Option C
D)Option D
The 25th percentile and the 75th percentile of the EPS are closest to: A)Option A
B)Option B
C)Option C
D)Option D
Unlock Deck
Unlock for access to all 123 flashcards in this deck.
Unlock Deck
k this deck
25
The owner of a company has recently decided to raise the salary of one employee,who was already making the highest salary,by 20%.Which of the following is (are)expected to be affected by this raise?
A)mean only
B)median only
C)mean and median only
D)mean,median and mode
A)mean only
B)median only
C)mean and median only
D)mean,median and mode
Unlock Deck
Unlock for access to all 123 flashcards in this deck.
Unlock Deck
k this deck
26
Which of the following statements about variance is most accurate? Variance:
A)is the square root of the standard deviation.
B)can be a positive number or a negative number.
C)is denominated in the same units as the original data.
D)is the average of the squared deviations from the mean.
A)is the square root of the standard deviation.
B)can be a positive number or a negative number.
C)is denominated in the same units as the original data.
D)is the average of the squared deviations from the mean.
Unlock Deck
Unlock for access to all 123 flashcards in this deck.
Unlock Deck
k this deck
27
Calculate the interquartile range from the following data: 1,2,4,5,10,12,18.
A)5
B)6
C)10
D)17
A)5
B)6
C)10
D)17
Unlock Deck
Unlock for access to all 123 flashcards in this deck.
Unlock Deck
k this deck
28
The table below gives the deviations of a portfolio's annual total returns from its benchmark's annual returns,for a 6-year period ending in 2011. The arithmetic mean return and median return are closest to:
A)Option A
B)Option B
C)Option C
D)Option D
The arithmetic mean return and median return are closest to: A)Option A
B)Option B
C)Option C
D)Option D
Unlock Deck
Unlock for access to all 123 flashcards in this deck.
Unlock Deck
k this deck
29
Which five values are graphed on a box plot?
A)Min,Quintile 1,Mean,Quintile 3,Max
B)Min,Quartile 1,Mean,Quartile 3,Max
C)Min,Quintile 1,Median,Quintile 3,Max
D)Min,Quartile 1,Median,Quartile 3,Max
A)Min,Quintile 1,Mean,Quintile 3,Max
B)Min,Quartile 1,Mean,Quartile 3,Max
C)Min,Quintile 1,Median,Quintile 3,Max
D)Min,Quartile 1,Median,Quartile 3,Max
Unlock Deck
Unlock for access to all 123 flashcards in this deck.
Unlock Deck
k this deck
30
Is it possible for a data set to have no mode?
A)Yes,if two observations occur twice.
B)No,unless there is an odd number of observations.
C)No,if the data set is nonempty,there is always a mode.
D)Yes,if there are no observations that occur more than once.
A)Yes,if two observations occur twice.
B)No,unless there is an odd number of observations.
C)No,if the data set is nonempty,there is always a mode.
D)Yes,if there are no observations that occur more than once.
Unlock Deck
Unlock for access to all 123 flashcards in this deck.
Unlock Deck
k this deck
31
In what way(s)is the concept of geometric mean useful?
A)In evaluating investment returns
B)In calculating average growth rates
C)In assessing the dispersion of the data
D)Both A and B
A)In evaluating investment returns
B)In calculating average growth rates
C)In assessing the dispersion of the data
D)Both A and B
Unlock Deck
Unlock for access to all 123 flashcards in this deck.
Unlock Deck
k this deck
32
The following data represent monthly returns (in percent): The geometric mean return is closest to:
A)- 0.43%.
B)0.78%.
C)0.94%.
D)4.79%.
The geometric mean return is closest to:A)- 0.43%.
B)0.78%.
C)0.94%.
D)4.79%.
Unlock Deck
Unlock for access to all 123 flashcards in this deck.
Unlock Deck
k this deck
33
Sales for Adidas grew at a rate of 0.5196 in 2006,0.0213 in 2007,0.0485 in 2008,and -0.0387 in 2009.The average growth rate for Adidas during these four years is closest to:
A)3.49%
B)11.83%
C)13.77%
D)14.02%
A)3.49%
B)11.83%
C)13.77%
D)14.02%
Unlock Deck
Unlock for access to all 123 flashcards in this deck.
Unlock Deck
k this deck
34
Is it possible for a data set to have more than one mode?
A)No,there must always be a single mode,or else there is no mode.
B)Yes,if two or more values in a data set occur the same number of times.
C)Yes,if there are at least two different values in a data set,there is always more than one mode.
D)Yes,if two or more values in a data set occur with the most frequency and the frequency is greater than one.
Unlock Deck
Unlock for access to all 123 flashcards in this deck.
Unlock Deck
k this deck
35
What is (are)the most widely used measure(s)of dispersion?
A)Range
B)Interquartile range
C)Variance and standard deviation
D)Covariance and the correlation coefficient
A)Range
B)Interquartile range
C)Variance and standard deviation
D)Covariance and the correlation coefficient
Unlock Deck
Unlock for access to all 123 flashcards in this deck.
Unlock Deck
k this deck
36
Which of the following statements is most accurate when defining percentiles?
A)The pth percentile divides a data set into equal parts.
B)Approximately p% of the observations are greater than the pth percentile.
C)Approximately (100-p)% of the observations are less than the pth percentile.
D)Approximately (100-p)% of the observations are greater than the pth percentile.
A)The pth percentile divides a data set into equal parts.
B)Approximately p% of the observations are greater than the pth percentile.
C)Approximately (100-p)% of the observations are less than the pth percentile.
D)Approximately (100-p)% of the observations are greater than the pth percentile.
Unlock Deck
Unlock for access to all 123 flashcards in this deck.
Unlock Deck
k this deck
37
What is the relationship between the variance and the standard deviation?
A)The standard deviation is the absolute value of the variance.
B)The variance is the absolute value of the standard deviation.
C)The variance is the positive square root of the standard deviation.
D)The standard deviation is the positive square root of the variance.
A)The standard deviation is the absolute value of the variance.
B)The variance is the absolute value of the standard deviation.
C)The variance is the positive square root of the standard deviation.
D)The standard deviation is the positive square root of the variance.
Unlock Deck
Unlock for access to all 123 flashcards in this deck.
Unlock Deck
k this deck
38
What is the interquartile range?
A)Q3 - Q1
B)Max - Min
C)Mean - Median
D)All values between Q1 and Q3
A)Q3 - Q1
B)Max - Min
C)Mean - Median
D)All values between Q1 and Q3
Unlock Deck
Unlock for access to all 123 flashcards in this deck.
Unlock Deck
k this deck
39
The Boom company has recently decided to raise the salaries of all employees by 10 percent.Which of the following is (are)expected to be affected by this raise?
A)mean and mode only
B)mean and median only
C)mode and median only
D)mean,median,and mode
A)mean and mode only
B)mean and median only
C)mode and median only
D)mean,median,and mode
Unlock Deck
Unlock for access to all 123 flashcards in this deck.
Unlock Deck
k this deck
40
A portfolio manager generates a 5% return in 2008,a 12% return in 2009,a negative 6% return in 2010,and a return of 2% (non-annualized)in the first quarter of 2011.The annualized return for the entire period is closest to:
A)3.05%
B)3.25%
C)3.50%
D)3.77%
A)3.05%
B)3.25%
C)3.50%
D)3.77%
Unlock Deck
Unlock for access to all 123 flashcards in this deck.
Unlock Deck
k this deck
41
The sample data below shows the number of hours spent by 5 students over the weekend to prepare for Monday's Business Statistics exam. The sample standard deviation of the number of hours spent by the 5 students is closest to:
A)3.6 hours
B)4.1 hours
C)13.2 hours
D)16.5 hours
The sample standard deviation of the number of hours spent by the 5 students is closest to:A)3.6 hours
B)4.1 hours
C)13.2 hours
D)16.5 hours
Unlock Deck
Unlock for access to all 123 flashcards in this deck.
Unlock Deck
k this deck
42
Consider a population with data values of . The population variance is closest to:
A)8.00
B)8.64
C)64.00
D)74.67
. The population variance is closest to:A)8.00
B)8.64
C)64.00
D)74.67
Unlock Deck
Unlock for access to all 123 flashcards in this deck.
Unlock Deck
k this deck
43
The coefficient of variation is best described as
A)A relative measure of dispersion.
B)An absolute measure of dispersion.
C)A relative measure of central location.
D)An absolute measure of central location.
A)A relative measure of dispersion.
B)An absolute measure of dispersion.
C)A relative measure of central location.
D)An absolute measure of central location.
Unlock Deck
Unlock for access to all 123 flashcards in this deck.
Unlock Deck
k this deck
44
The annual returns (in percent)for a sample of stocks in the technology industry over the past year are as follows: The median return is closest to:
A)-6.6
B)-5
C)0
D)2.8
The median return is closest to:A)-6.6
B)-5
C)0
D)2.8
Unlock Deck
Unlock for access to all 123 flashcards in this deck.
Unlock Deck
k this deck
45
A bowler's scores for a sample of six games were The bowler's average score is:
A)172
B)174
C)178
D)190
The bowler's average score is:A)172
B)174
C)178
D)190
Unlock Deck
Unlock for access to all 123 flashcards in this deck.
Unlock Deck
k this deck
46
An analyst gathered the following information about the net profit margins of companies in two industries: Compared with the other industry,the relative dispersion of net profit margins is smaller for Industry:
A)B,because it has a smaller mean deviation.
B)B,because it has a smaller range of variation.
C)A,because it has a smaller standard deviation.
D)A,because it has a smaller coefficient of variation.
Compared with the other industry,the relative dispersion of net profit margins is smaller for Industry:A)B,because it has a smaller mean deviation.
B)B,because it has a smaller range of variation.
C)A,because it has a smaller standard deviation.
D)A,because it has a smaller coefficient of variation.
Unlock Deck
Unlock for access to all 123 flashcards in this deck.
Unlock Deck
k this deck
47
A bowler's scores for a sample of six games were The bowler's modal score is:
A)172
B)174
C)178
D)190
The bowler's modal score is:A)172
B)174
C)178
D)190
Unlock Deck
Unlock for access to all 123 flashcards in this deck.
Unlock Deck
k this deck
48
The sample data below shows the number of hours spent by 5 students over the weekend to prepare for Monday's Business Statistics exam. The mean and the median of the numbers of hours spent by the 5 students are
A)2 hours and 5 hours,respectively
B)3 hours and 5 hours,respectively
C)5 hours and 2 hours,respectively
D)5 hours and 3 hours,respectively
The mean and the median of the numbers of hours spent by the 5 students areA)2 hours and 5 hours,respectively
B)3 hours and 5 hours,respectively
C)5 hours and 2 hours,respectively
D)5 hours and 3 hours,respectively
Unlock Deck
Unlock for access to all 123 flashcards in this deck.
Unlock Deck
k this deck
49
Consider a population with data values of . The median is:
A)12
B)14
C)18
D)22
. The median is:A)12
B)14
C)18
D)22
Unlock Deck
Unlock for access to all 123 flashcards in this deck.
Unlock Deck
k this deck
50
The sample data below shows the number of hours spent by 5 students over the weekend to prepare for Monday's Business Statistics exam. The 75th percentile of the data is closest to:
A)3 hours
B)4.5 hours
C)8.5 hours
D)10 hours
The 75th percentile of the data is closest to:A)3 hours
B)4.5 hours
C)8.5 hours
D)10 hours
Unlock Deck
Unlock for access to all 123 flashcards in this deck.
Unlock Deck
k this deck
51
The annual returns (in percent)for a sample of stocks in the technology industry over the past year are as follows: The sample standard deviation is closest to:
A)7.59
B)8.49
C)57.61
D)72.01
The sample standard deviation is closest to:A)7.59
B)8.49
C)57.61
D)72.01
Unlock Deck
Unlock for access to all 123 flashcards in this deck.
Unlock Deck
k this deck
52
Consider a population with data values of . The mode is:
A)12
B)14
C)18
D)22
. The mode is:A)12
B)14
C)18
D)22
Unlock Deck
Unlock for access to all 123 flashcards in this deck.
Unlock Deck
k this deck
53
The sample data below shows the number of hours spent by 5 students over the weekend to prepare for Monday's Business Statistics exam. The interquartile range of the data is closest to:
A)4 hours
B)6 hours
C)10 hours
D)12 hours
The interquartile range of the data is closest to:A)4 hours
B)6 hours
C)10 hours
D)12 hours
Unlock Deck
Unlock for access to all 123 flashcards in this deck.
Unlock Deck
k this deck
54
The annual returns (in percent)for a sample of stocks in the technology industry over the past year are as follows: The average return is closest to:
A)-6.6
B)-5
C)0
D)2.8
The average return is closest to:A)-6.6
B)-5
C)0
D)2.8
Unlock Deck
Unlock for access to all 123 flashcards in this deck.
Unlock Deck
k this deck
55
A bowler's scores for a sample of six games were The bowler's median score is:
A)172
B)174
C)178
D)190
The bowler's median score is:A)172
B)174
C)178
D)190
Unlock Deck
Unlock for access to all 123 flashcards in this deck.
Unlock Deck
k this deck
56
Which of the following statements about the mean absolute deviation (MAD)is most accurate? MAD:
A)is the square root of the standard deviation.
B)can be a positive number or a negative number.
C)is denominated in the same units as the original data.
D)is the arithmetic mean of the squared deviations from the mean.
A)is the square root of the standard deviation.
B)can be a positive number or a negative number.
C)is denominated in the same units as the original data.
D)is the arithmetic mean of the squared deviations from the mean.
Unlock Deck
Unlock for access to all 123 flashcards in this deck.
Unlock Deck
k this deck
57
Consider a population with data values of . The population standard deviation is closest to:
A)8.00
B)8.64
C)64.00
D)74.67
. The population standard deviation is closest to:A)8.00
B)8.64
C)64.00
D)74.67
Unlock Deck
Unlock for access to all 123 flashcards in this deck.
Unlock Deck
k this deck
58
Professors at a local university earn an average salary of $80,000 with a standard deviation of $6,000.With the beginning of the next academic year,all professors will get a 2% raise.What will be the average and the standard deviation of their new salaries?
A)$80,000 and $6,120
B)$81,600 and $6,000
C)$81,600 and $6,120
D)$82,000 and $6,200
A)$80,000 and $6,120
B)$81,600 and $6,000
C)$81,600 and $6,120
D)$82,000 and $6,200
Unlock Deck
Unlock for access to all 123 flashcards in this deck.
Unlock Deck
k this deck
59
Consider a population with data values of . The population mean is:
A)12
B)14
C)18
D)22
. The population mean is:A)12
B)14
C)18
D)22
Unlock Deck
Unlock for access to all 123 flashcards in this deck.
Unlock Deck
k this deck
60
A bowler's scores for a sample of six games were The sample standard deviation is closest to:
A)8.00
B)8.64
C)64.00
D)74.67
The sample standard deviation is closest to:A)8.00
B)8.64
C)64.00
D)74.67
Unlock Deck
Unlock for access to all 123 flashcards in this deck.
Unlock Deck
k this deck
61
A portfolio's annual total returns (in percent)for a 5-year period are: The median and the standard deviation for this sample are closest to:
A)Option A
B)Option B
C)Option C
D)Option D
The median and the standard deviation for this sample are closest to: A)Option A
B)Option B
C)Option C
D)Option D
Unlock Deck
Unlock for access to all 123 flashcards in this deck.
Unlock Deck
k this deck
62
The table below gives statistics relating to a hypothetical 10-year record of two portfolios.Assume other statistics relating to these portfolios are the same and the risk-free rate is 3.5%.Using the coefficient of variation and the Sharpe ratio,the fund that is preferred in terms of relative risk and return per unit of risk is
A)Portfolio A since it has a higher coefficient of variation and a lower Sharpe ratio.
B)Portfolio A since it has a lower coefficient of variation and a higher Sharpe ratio.
C)Portfolio B since it has a higher coefficient of variation and a lower Sharpe ratio.
D)Portfolio B since it has a lower coefficient of variation and a higher Sharper ratio.
Unlock Deck
Unlock for access to all 123 flashcards in this deck.
Unlock Deck
k this deck
63
The price to earnings ratio,also called the P/E ratio of a stock is a measure of the price of a share relative to the annual net income per share earned by the firm.Suppose the P/Es for a firm's common stock during the past four quarters be 10,12,15,and 11,respectively.The standard deviation of the P/E ratio over the four quarters is:
A)1.87
B)2.16
C)3.50
D)4.67
A)1.87
B)2.16
C)3.50
D)4.67
Unlock Deck
Unlock for access to all 123 flashcards in this deck.
Unlock Deck
k this deck
64
In its standard form,Chebyshev's theorem provides a lower bound on:
A)The number of observations lying within a certain interval.
B)The number of observations lying outside a certain interval.
C)The proportion (or percentage)of observations lying within a certain interval.
D)The proportion (or percentage)of observations lying outside a certain interval.
A)The number of observations lying within a certain interval.
B)The number of observations lying outside a certain interval.
C)The proportion (or percentage)of observations lying within a certain interval.
D)The proportion (or percentage)of observations lying outside a certain interval.
Unlock Deck
Unlock for access to all 123 flashcards in this deck.
Unlock Deck
k this deck
65
When applicable,the empirical rule provides the approximate percentage of observations that fall within how many standard deviations from the mean?
A)1,2,or 3 standard deviations
B)2,3,or 4 standard deviations
C)k standard deviations for every k > 1
D)1 - 1/k2 standard deviations for every k > 1
A)1,2,or 3 standard deviations
B)2,3,or 4 standard deviations
C)k standard deviations for every k > 1
D)1 - 1/k2 standard deviations for every k > 1
Unlock Deck
Unlock for access to all 123 flashcards in this deck.
Unlock Deck
k this deck
66
The empirical rule can be used to estimate some proportions when data has what shape?
A)Any shape
B)When it is skewed to the left
C)When it is skewed to the right
D)When it is approximately symmetric and bell-shaped
A)Any shape
B)When it is skewed to the left
C)When it is skewed to the right
D)When it is approximately symmetric and bell-shaped
Unlock Deck
Unlock for access to all 123 flashcards in this deck.
Unlock Deck
k this deck
67
Chebyshev's theorem is applicable when the data are
A)Any shape
B)Skewed to the left
C)Skewed to the right
D)Approximately symmetric and bell-shaped
A)Any shape
B)Skewed to the left
C)Skewed to the right
D)Approximately symmetric and bell-shaped
Unlock Deck
Unlock for access to all 123 flashcards in this deck.
Unlock Deck
k this deck
68
What capabilities do Chebyshev's theorem and the empirical rule provide?
A)They make statements regarding the shape of the data.
B)They make statements regarding the central location of the data.
C)They make statements regarding the dispersion of the data around the median.
D)They make statements regarding the percentage of data values that fall within some number of standard deviations from the mean.
Unlock Deck
Unlock for access to all 123 flashcards in this deck.
Unlock Deck
k this deck
69
What is the difference between Chebyshev's theorem and the empirical rule?
A)The empirical rule applies to all data sets,whether their distributions are symmetric and bell-shaped or not.
B)Chebyshev's theorem applies to all data sets except those that have approximately a symmetric and bell-shaped distribution.
C)The empirical rule applies to all data sets,whereas Chebyshev's theorem is appropriate when the data have approximately a symmetric and bell-shaped distribution.
D)Chebyshev's theorem applies to all data sets,whereas the empirical rule is only appropriate when the data have approximately a symmetric and bell-shaped distribution.
Unlock Deck
Unlock for access to all 123 flashcards in this deck.
Unlock Deck
k this deck
70
The advantage of using mean absolute deviation rather than variance as a measure of dispersion is that mean absolute deviation:
A)is less sensitive to extreme deviations.
B)requires fewer observations to be a valid measure.
C)is a relative measure rather than an absolute measure of risk.
D)considers only unfavorable (negative)deviations from the mean.
A)is less sensitive to extreme deviations.
B)requires fewer observations to be a valid measure.
C)is a relative measure rather than an absolute measure of risk.
D)considers only unfavorable (negative)deviations from the mean.
Unlock Deck
Unlock for access to all 123 flashcards in this deck.
Unlock Deck
k this deck
71
For k > 1,Chebyshev's theorem is useful in estimating the proportion of observations that fall within:
A)k standard deviations from the mean.
B)k2 standard deviations from the mean.
C)(1 - 1/k)standard deviations from the mean.
D)(1 - 1/k2)standard deviations from the mean.
A)k standard deviations from the mean.
B)k2 standard deviations from the mean.
C)(1 - 1/k)standard deviations from the mean.
D)(1 - 1/k2)standard deviations from the mean.
Unlock Deck
Unlock for access to all 123 flashcards in this deck.
Unlock Deck
k this deck
72
A college professor collected data on the number of hours spent by his 100 students over the weekend to prepare for Monday's Business Statistics exam.He processed the data by Excel and the following incomplete output is available. The median is most likely to be
A)About 7 hours.
B)Less than 7 hours.
C)Greater than 7 hours.
D)Cannot tell from the information provided.
The median is most likely to beA)About 7 hours.
B)Less than 7 hours.
C)Greater than 7 hours.
D)Cannot tell from the information provided.
Unlock Deck
Unlock for access to all 123 flashcards in this deck.
Unlock Deck
k this deck
73
The mean return on equity (ROE)for a group of firms in an industry is 15 percent with a variance of 9 percent.The coefficient of variation of the industry's ROE is:
A)0.2
B)0.6
C)1.7
D)5.0
A)0.2
B)0.6
C)1.7
D)5.0
Unlock Deck
Unlock for access to all 123 flashcards in this deck.
Unlock Deck
k this deck
74
When using the empirical rule,which assumption is made?
A)The data only comes from a sample.
B)The data only comes from a population.
C)The data is exactly symmetric and bell-shaped.
D)The data is approximately symmetric and bell-shaped.
A)The data only comes from a sample.
B)The data only comes from a population.
C)The data is exactly symmetric and bell-shaped.
D)The data is approximately symmetric and bell-shaped.
Unlock Deck
Unlock for access to all 123 flashcards in this deck.
Unlock Deck
k this deck
75
The Sharpe ratio measures
A)The extra reward per unit of risk
B)The extra risk per unit of reward
C)The increase in mean per unit of risk
D)The extra variance per unit of reward
A)The extra reward per unit of risk
B)The extra risk per unit of reward
C)The increase in mean per unit of risk
D)The extra variance per unit of reward
Unlock Deck
Unlock for access to all 123 flashcards in this deck.
Unlock Deck
k this deck
76
In an accounting class of 200 students,the mean and standard deviation of scores was 70 and 5,respectively.Use the empirical rule to determine the number of students who scored less than 65 or more than 75.
A)about 32
B)about 64
C)about 68
D)about 136
A)about 32
B)about 64
C)about 68
D)about 136
Unlock Deck
Unlock for access to all 123 flashcards in this deck.
Unlock Deck
k this deck
77
In a marketing class of 60 students,the mean and the standard deviation of scores was 70 and 5,respectively.Use Chebyshev's Theorem to determine the number of students who scored less than 60 or more than 80:
A)At least 45
B)At most 15
C)At most 45
D)At least 15
A)At least 45
B)At most 15
C)At most 45
D)At least 15
Unlock Deck
Unlock for access to all 123 flashcards in this deck.
Unlock Deck
k this deck
78
A college professor collected data on the number of hours spent by his 100 students over the weekend to prepare for Monday's Business Statistics exam.He processed the data by Excel and the following incomplete output is available. The coefficient of variation in the data is
A)40%.
B)90%.
C)111%.
D)243%.
The coefficient of variation in the data isA)40%.
B)90%.
C)111%.
D)243%.
Unlock Deck
Unlock for access to all 123 flashcards in this deck.
Unlock Deck
k this deck
79
Which of the following is true when using the empirical rule for a set of sample data?
A)Almost all observations are in the interval .
B)Approximately 68% of all observations are in the interval .
C)Approximately 95% of all observations are in the interval .
D)Approximately 68% of all observations are in the interval
A)Almost all observations are in the interval
.B)Approximately 68% of all observations are in the interval
.C)Approximately 95% of all observations are in the interval
.D)Approximately 68% of all observations are in the interval
Unlock Deck
Unlock for access to all 123 flashcards in this deck.
Unlock Deck
k this deck
80
As of September 30,2011,the earnings per share,EPS,of five firms in the biotechnology industry are as follows: The sample mean and the sample standard deviation are closest to:
A)Option A
B)Option B
C)Option C
D)Option D
The sample mean and the sample standard deviation are closest to: A)Option A
B)Option B
C)Option C
D)Option D
Unlock Deck
Unlock for access to all 123 flashcards in this deck.
Unlock Deck
k this deck
Unlock Deck
Unlock for access to all 123 flashcards in this deck.


