Deck 16: More on Analysis of Variance
Full screen (f)
Question
Instructors gave caffeine to fruit flies to see if it affected their rest. The three treatments were a control, a low caffeine dose of 1 mg/ml of blood, and a higher caffeine dose of 5 mg/ml of blood. Fifteen fruit flies were assigned at random to three treatments, five to each treatment. The minutes of rest measured over a 12-hour period were recorded; the data follow.  Minitab was used to obtain 95% simultaneous confidence intervals for the differences in means among the three treatments using Tukey's procedure; the results follow.
 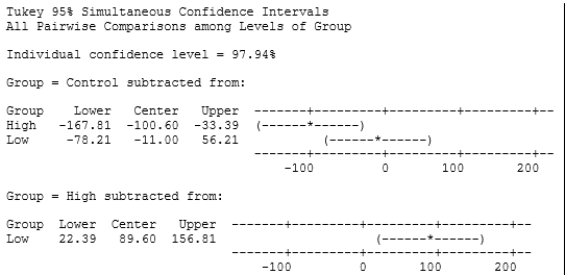 From these intervals:
A)there is not sufficient evidence to conclude that control low.
B)there is sufficient evidence to conclude that control high.
C)there is sufficient evidence to conclude that high low.
D)All of the answer options are correct.
Minitab was used to obtain 95% simultaneous confidence intervals for the differences in means among the three treatments using Tukey's procedure; the results follow. From these intervals:A)there is not sufficient evidence to conclude that control low.
B)there is sufficient evidence to conclude that control high.
C)there is sufficient evidence to conclude that high low.
D)All of the answer options are correct.
Question
A marketing researcher was studying the effect of a supermarket display on sales of a new product. There were two designs for the display: the first had greater visual appeal and the second contained more factual information about the product. Each type of display could be made in three sizes: small, medium, or large. Eighteen supermarkets were available for the study, and three supermarkets were selected at random to display each combination of design and size. The number of units of the product sold over a two-week period was recorded for each supermarket. For the resulting data, a two-way ANOVA was run, with the partial ANOVA table given below. Analysis of variance for sales:  What conclusion should be drawn from this test?
A)Accept the null hypothesis.
B)Fail to reject the null hypothesis-there is no evidence to suggest that design is more or less likely to influence sales.
C)Reject the null hypothesis-there is some evidence that design influences sales.
D)Reject the null hypothesis-there is strong evidence that design influences sales.
What conclusion should be drawn from this test?A)Accept the null hypothesis.
B)Fail to reject the null hypothesis-there is no evidence to suggest that design is more or less likely to influence sales.
C)Reject the null hypothesis-there is some evidence that design influences sales.
D)Reject the null hypothesis-there is strong evidence that design influences sales.
Question
A marketing manager studied the effect of packaging on sales. Four designs were chosen: design 1 had three colors, design 2 had three colors and cartoons, design 3 had five colors, and design 4 had five colors and cartoons. The ANOVA table below analyzes the effects of varying the number of colors and adding cartoons on sales. This is an example of a two-factor factorial design. Analysis of Variance for Sales 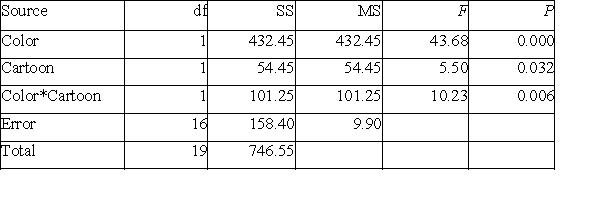 The estimate of the standard deviation is given by:
A)9.9.
B)3.15.
C)158.4.
D)10.23.
The estimate of the standard deviation is given by:A)9.9.
B)3.15.
C)158.4.
D)10.23.
Question
A researcher wished to compare the effect of the frequency of the rate of stepping on heart rate in a step-aerobics workout. A collection of 30 adult volunteers, 15 women and 15 men, was selected from a local gym. The men were randomly divided into three groups of five subjects each. Each group did a standard step-aerobics workout, with group 1 at a low rate of stepping, group 2 at a medium rate of stepping, and group 3 at a rapid rate. The women were also randomly divided into three groups of five subjects each. As with the men, each group did one of the three standard step-aerobics workouts. The mean heart rate at the end of the workout for all subjects was determined (in beats per minute). A partial ANOVA table for these data is given below. Analysis of variance for heart rate: 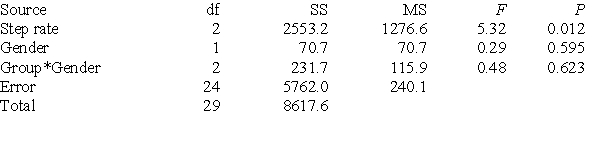 The factors in the experiment are:
A)rate of stepping and heart rate.
B)rate of stepping and gender.
C)heart rate and gender.
D)gym membership and gender.
The factors in the experiment are:A)rate of stepping and heart rate.
B)rate of stepping and gender.
C)heart rate and gender.
D)gym membership and gender.
Question
A population of flights can be classified according to two factors: duration (short, medium, or long) and purpose (vacation or business). We are interested in whether either of these factors has an effect on price. The table below gives mean prices for a balanced population.  A medium-distance business flight costs $300 more than a short-distance business flight. However, a medium-distance vacation flights is only $200 more than a short-distance vacation flight. This difference between business and vacation flights is called:
A)interference of effects.
B)confusion of effects.
C)difference of effects.
D)interaction.
A medium-distance business flight costs $300 more than a short-distance business flight. However, a medium-distance vacation flights is only $200 more than a short-distance vacation flight. This difference between business and vacation flights is called:A)interference of effects.
B)confusion of effects.
C)difference of effects.
D)interaction.
Question
A researcher wished to compare the effect of the frequency of the rate of stepping on heart rate in a step-aerobics workout. A collection of 30 adult volunteers, 15 women and 15 men, was selected from a local gym. The men were randomly divided into three groups of five subjects each. Each group did a standard step-aerobics workout, with group 1 at a low rate of stepping, group 2 at a medium rate of stepping, and group 3 at a rapid rate. The women were also randomly divided into three groups of five subjects each. As with the men, each group did one of the three standard step-aerobics workouts. The mean heart rate at the end of the workout for all subjects was determined (in beats per minute). A partial ANOVA table for these data is given below. Analysis of variance for heart rate:  The plots and the P-value for the test for interaction show little evidence of interaction, which means that:
A)there is little difference in the heart rates of men and women.
B)the change in heart rate due to the different stepping rates is similar for men and women.
C)changes in stepping rate are positively associated with heart rate.
D)step exercise is equally beneficial to men and women.
The plots and the P-value for the test for interaction show little evidence of interaction, which means that:A)there is little difference in the heart rates of men and women.
B)the change in heart rate due to the different stepping rates is similar for men and women.
C)changes in stepping rate are positively associated with heart rate.
D)step exercise is equally beneficial to men and women.
Question
Instructors gave caffeine to fruit flies to see if it affected their rest. The three treatments were a control, a low caffeine dose of 1 mg/ml of blood, and a higher caffeine dose of 5 mg/ml of blood. Fifteen fruit flies were assigned at random to three treatments, five to each treatment. The minutes of rest measured over a 12-hour period were recorded; the data follow.  Minitab was used to obtain 95% simultaneous confidence intervals for the differences in means among the three treatments using Tukey's procedure; the results follow.
  The average minutes of rest for the five fruit flies assigned to the low-dose group was:
A)11 minutes higher than the average for the five fruit flies assigned to the control dose.
B)89.6 minutes lower than the average for the five fruit flies assigned to the high dose.
C)89.6 minutes higher than the average for the five fruit flies assigned to the high dose.
D)56.21 minutes higher than the average for the five fruit flies assigned to the control dose.
Minitab was used to obtain 95% simultaneous confidence intervals for the differences in means among the three treatments using Tukey's procedure; the results follow. The average minutes of rest for the five fruit flies assigned to the low-dose group was:A)11 minutes higher than the average for the five fruit flies assigned to the control dose.
B)89.6 minutes lower than the average for the five fruit flies assigned to the high dose.
C)89.6 minutes higher than the average for the five fruit flies assigned to the high dose.
D)56.21 minutes higher than the average for the five fruit flies assigned to the control dose.
Question
A marketing researcher was studying the effect of a supermarket display on sales of a new product. There were two designs for the display: the first had greater visual appeal and the second contained more factual information about the product. Each type of display could be made in three sizes: small, medium, or large. Eighteen supermarkets were available for the study, and three supermarkets were selected at random to display each combination of design and size. The number of units of the product sold over a two-week period was recorded for each supermarket. For the resulting data, a two-way ANOVA was run, with the partial ANOVA table given below. Analysis of variance for sales:  The numerical value of the F statistic used for testing for the main effect of size is:
A)0.59.
B)1.69.
C)3.4.
D)202.33.
The numerical value of the F statistic used for testing for the main effect of size is:A)0.59.
B)1.69.
C)3.4.
D)202.33.
Question
A researcher wished to compare the effect of the frequency of the rate of stepping on heart rate in a step-aerobics workout. A collection of 30 adult volunteers, 15 women and 15 men, was selected from a local gym. The men were randomly divided into three groups of five subjects each. Each group did a standard step-aerobics workout, with group 1 at a low rate of stepping, group 2 at a medium rate of stepping, and group 3 at a rapid rate. The women were also randomly divided into three groups of five subjects each. As with the men, each group did one of the three standard step-aerobics workouts. The mean heart rate at the end of the workout for all subjects was determined (in beats per minute). A partial ANOVA table for these data is given below. Analysis of variance for heart rate: 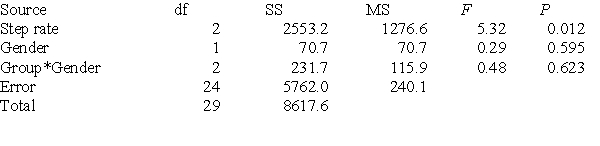 Since there is little evidence of interaction and the main effect of stepping is significant, we can conclude that:
A)the population mean heart rate for the rapid-rate group is higher than the other two groups.
B)the population mean heart rate for the low-rate group is lower than the other two groups.
C)the population mean heart rate for the low-rate group is lower than that of the medium-rate group.
D)None of the answer options is correct.
Since there is little evidence of interaction and the main effect of stepping is significant, we can conclude that:A)the population mean heart rate for the rapid-rate group is higher than the other two groups.
B)the population mean heart rate for the low-rate group is lower than the other two groups.
C)the population mean heart rate for the low-rate group is lower than that of the medium-rate group.
D)None of the answer options is correct.
Question
A researcher wished to compare the effect of the frequency of the rate of stepping on heart rate in a step-aerobics workout. A collection of 30 adult volunteers, 15 women and 15 men, was selected from a local gym. The men were randomly divided into three groups of five subjects each. Each group did a standard step-aerobics workout, with group 1 at a low rate of stepping, group 2 at a medium rate of stepping, and group 3 at a rapid rate. The women were also randomly divided into three groups of five subjects each. As with the men, each group did one of the three standard step-aerobics workouts. The mean heart rate at the end of the workout for all subjects was determined (in beats per minute). A partial ANOVA table for these data is given below. Analysis of variance for heart rate:  Which test was used to explore this problem?
A)a one-way ANOVA
B)a two-way ANOVA
C)multiple comparisons procedures (without contrasts)
D)multiple comparisons procedures (with contrasts)
Which test was used to explore this problem?A)a one-way ANOVA
B)a two-way ANOVA
C)multiple comparisons procedures (without contrasts)
D)multiple comparisons procedures (with contrasts)
Question
A population of flights can be classified according to two factors: duration (short, medium, or long) and purpose (vacation or business). We are interested in whether either of these factors has an effect on price. The table below gives mean prices for a balanced population.  The average cost of a business flight is:
A)$400.
B)$2600.
C)$650.
D)$866.67.
The average cost of a business flight is:A)$400.
B)$2600.
C)$650.
D)$866.67.
Question
A marketing manager studied the effect of packaging on sales. Four designs were chosen: design 1 had three colors, design 2 had three colors and cartoons, design 3 had five colors, and design 4 had five colors and cartoons. The plot below provides means at all four levels of color and cartoon combinations. 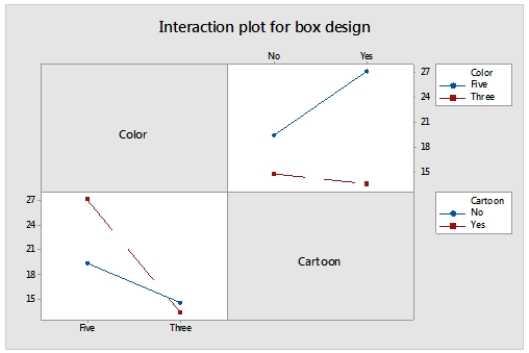 Based on the plot, what can we conclude?
A)Adding cartoons to three colors does not increase sales.
B)Adding cartoons to five colors increases sales.
C)Going from three to five colors increases sales.
D)All of the answer options are correct.
Based on the plot, what can we conclude?A)Adding cartoons to three colors does not increase sales.
B)Adding cartoons to five colors increases sales.
C)Going from three to five colors increases sales.
D)All of the answer options are correct.
Question
A marketing researcher was studying the effect of a supermarket display on sales of a new product. There were two designs for the display: the first had greater visual appeal and the second contained more factual information about the product. Each type of display could be made in three sizes: small, medium, or large. Eighteen supermarkets were available for the study, and three supermarkets were selected at random to display each combination of design and size. The number of units of the product sold over a two-week period was recorded for each supermarket. For the resulting data, a two-way ANOVA was run, with the partial ANOVA table given below. Analysis of variance for sales: 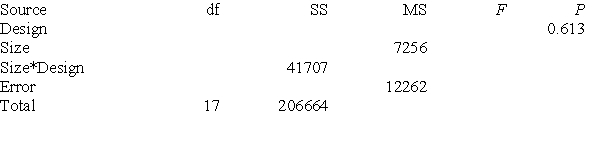 In the ANOVA table, the test for the main effect of design has a P-value of 0.613, which indicates that:
A)sales probably vary considerably for the different designs.
B)for about 61.3% of the samples, there was a difference in the effect of design.
C)for about 61.3% of the samples, there was no difference in the effect of design.
D)None of the answer options is correct.
In the ANOVA table, the test for the main effect of design has a P-value of 0.613, which indicates that:A)sales probably vary considerably for the different designs.
B)for about 61.3% of the samples, there was a difference in the effect of design.
C)for about 61.3% of the samples, there was no difference in the effect of design.
D)None of the answer options is correct.
Question
A population of flights can be classified according to two factors: duration (short, medium, or long) and purpose (vacation or business). We are interested in whether either of these factors has an effect on price. The table below gives mean prices for a balanced population.  The difference between the cost of a business flight and the cost of a vacation flight:
A)is constant across distance.
B)differs by distance.
C)depends on the time of day.
D)cannot be determined with the information given.
The difference between the cost of a business flight and the cost of a vacation flight:A)is constant across distance.
B)differs by distance.
C)depends on the time of day.
D)cannot be determined with the information given.
Question
Question
A marketing manager studied the effect of packaging on sales. Four designs were chosen: design 1 three colors, design 2 had three colors and cartoons, design 3 had five colors, and design 4 had five colors and cartoons. The ANOVA table below analyzes the effects of varying the number of colors and adding cartoons on sales. There were 20 stores where the boxes with the new designs were sold. Analysis of Variance for Sales 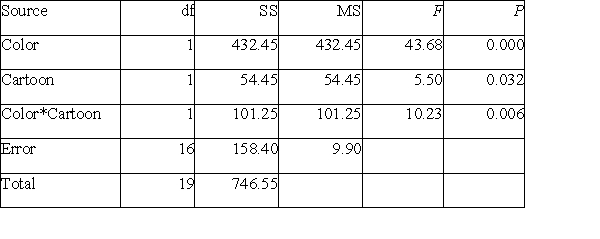 The F statistic for testing that there is no interaction is:
A)10.23.
B)5.5.
C)43.68.
D)None of the answer options is correct.
The F statistic for testing that there is no interaction is:A)10.23.
B)5.5.
C)43.68.
D)None of the answer options is correct.
Question
A marketing researcher was studying the effect of a supermarket display on sales of a new product. There were two designs for the display: the first had greater visual appeal and the second contained more factual information about the product. Each type of display could be made in three sizes: small, medium, or large. Eighteen supermarkets were available for the study, and three supermarkets were selected at random to display each combination of design and size. The number of units of the product sold over a two-week period was recorded for each supermarket. For the resulting data, a two-way ANOVA was run, with the partial ANOVA table given below. Analysis of variance for sales: 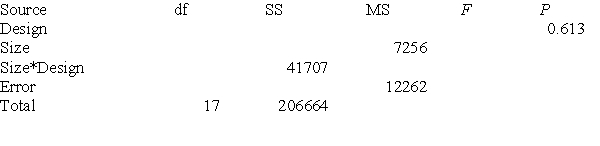 Which statement best describes the type of experiment being run?
A)This is a two-factor experiment-each factor is at three levels.
B)This is a six-level experiment-each level has three observations.
C)This is a two-factor experiment-one factor is at two levels and the other factor is at three levels.
D)None of the answer options is correct.
Which statement best describes the type of experiment being run?A)This is a two-factor experiment-each factor is at three levels.
B)This is a six-level experiment-each level has three observations.
C)This is a two-factor experiment-one factor is at two levels and the other factor is at three levels.
D)None of the answer options is correct.
Question
A population of flights can be classified according to two factors: duration (short, medium, or long) and purpose (vacation or business). We are interested in whether either of these factors has an effect on price. The table below gives mean prices for a balanced population.  The average price for short flights is:
A)$400.
B)$300.
C)$200.
D)None of the answer options is correct.
The average price for short flights is:A)$400.
B)$300.
C)$200.
D)None of the answer options is correct.
Question
Question
A researcher wished to compare the effect of the frequency of the rate of stepping on heart rate in a step-aerobics workout. A collection of 30 adult volunteers, 15 women and 15 men, was selected from a local gym. The men were randomly divided into three groups of five subjects each. Each group did a standard step-aerobics workout, with group 1 at a low rate of stepping, group 2 at a medium rate of stepping, and group 3 at a rapid rate. The women were also randomly divided into three groups of five subjects each. As with the men, each group did one of the three standard step-aerobics workouts. The mean heart rate at the end of the workout for all subjects was determined (in beats per minute). A partial ANOVA table for these data is given below. Analysis of variance for heart rate:  The pooled standard error is:
A)15.5.
B)75.9.
C)240.1.
D)5762.
The pooled standard error is:A)15.5.
B)75.9.
C)240.1.
D)5762.
Question
A population of flights can be classified according to two factors: duration (short, medium, or long) and purpose (vacation or business). We are interested in whether either of these factors has an effect on price. The table below gives mean prices for a balanced population and shows the presence of interactions.  If a study is conducted and we think there may be interactions, we should:
A)find the F test for interaction first and, if the P-value is small enough to reject the null hypothesis of no interaction, assess the effects of distance separately for business and vacation flights.
B)test for effects of distance first and, if there is no distance effect, ignore the interactions.
C)find the F tests for distance effects and for type of trip and, if there is no effect for either, declare that all the means are the same.
D)drop observations that cause the interaction and repeat the analysis.
If a study is conducted and we think there may be interactions, we should:A)find the F test for interaction first and, if the P-value is small enough to reject the null hypothesis of no interaction, assess the effects of distance separately for business and vacation flights.
B)test for effects of distance first and, if there is no distance effect, ignore the interactions.
C)find the F tests for distance effects and for type of trip and, if there is no effect for either, declare that all the means are the same.
D)drop observations that cause the interaction and repeat the analysis.
Question
A study compared dry matter intake (dmi) in mature cows (C) and heifers (H) receiving no treatment (control), treatment A, or treatment B. The two factors are type of animal and treatment. Each factor combination had eight animals. A partial ANOVA table is given below.  The F test for interaction is:
A)83.2.
B)20.3.
C)3.02.
D)0.85.
The F test for interaction is:A)83.2.
B)20.3.
C)3.02.
D)0.85.
Question
A study compared dry matter intake (dmi) in mature cows (C) and heifers (H) receiving no treatment (control), treatment A, or treatment B. The two factors are type of animal and treatment. Each factor combination has eight animals. 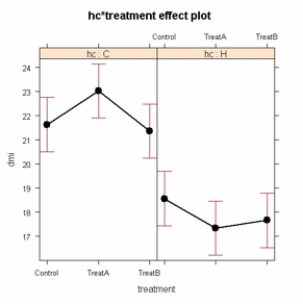 The above plot of the means, which is derived from a two-factor analysis of variance, is called:
A)an interaction plot.
B)a parallel means plot.
C)a nonparallel means plot.
D)a crossover plot.
The above plot of the means, which is derived from a two-factor analysis of variance, is called:A)an interaction plot.
B)a parallel means plot.
C)a nonparallel means plot.
D)a crossover plot.

Unlock Deck
Sign up to unlock the cards in this deck!
Unlock Deck
Unlock Deck
1/23
Play
Full screen (f)
Deck 16: More on Analysis of Variance
1
Instructors gave caffeine to fruit flies to see if it affected their rest. The three treatments were a control, a low caffeine dose of 1 mg/ml of blood, and a higher caffeine dose of 5 mg/ml of blood. Fifteen fruit flies were assigned at random to three treatments, five to each treatment. The minutes of rest measured over a 12-hour period were recorded; the data follow. Minitab was used to obtain 95% simultaneous confidence intervals for the differences in means among the three treatments using Tukey's procedure; the results follow. From these intervals:
A)there is not sufficient evidence to conclude that control low.
B)there is sufficient evidence to conclude that control high.
C)there is sufficient evidence to conclude that high low.
D)All of the answer options are correct.
Minitab was used to obtain 95% simultaneous confidence intervals for the differences in means among the three treatments using Tukey's procedure; the results follow. From these intervals:A)there is not sufficient evidence to conclude that control low.
B)there is sufficient evidence to conclude that control high.
C)there is sufficient evidence to conclude that high low.
D)All of the answer options are correct.
All of the answer options are correct.
2
A marketing researcher was studying the effect of a supermarket display on sales of a new product. There were two designs for the display: the first had greater visual appeal and the second contained more factual information about the product. Each type of display could be made in three sizes: small, medium, or large. Eighteen supermarkets were available for the study, and three supermarkets were selected at random to display each combination of design and size. The number of units of the product sold over a two-week period was recorded for each supermarket. For the resulting data, a two-way ANOVA was run, with the partial ANOVA table given below. Analysis of variance for sales: What conclusion should be drawn from this test?
A)Accept the null hypothesis.
B)Fail to reject the null hypothesis-there is no evidence to suggest that design is more or less likely to influence sales.
C)Reject the null hypothesis-there is some evidence that design influences sales.
D)Reject the null hypothesis-there is strong evidence that design influences sales.
What conclusion should be drawn from this test?A)Accept the null hypothesis.
B)Fail to reject the null hypothesis-there is no evidence to suggest that design is more or less likely to influence sales.
C)Reject the null hypothesis-there is some evidence that design influences sales.
D)Reject the null hypothesis-there is strong evidence that design influences sales.
Fail to reject the null hypothesis-there is no evidence to suggest that design is more or less likely to influence sales.
3
A marketing manager studied the effect of packaging on sales. Four designs were chosen: design 1 had three colors, design 2 had three colors and cartoons, design 3 had five colors, and design 4 had five colors and cartoons. The ANOVA table below analyzes the effects of varying the number of colors and adding cartoons on sales. This is an example of a two-factor factorial design. Analysis of Variance for Sales The estimate of the standard deviation is given by:
A)9.9.
B)3.15.
C)158.4.
D)10.23.
The estimate of the standard deviation is given by:A)9.9.
B)3.15.
C)158.4.
D)10.23.
3.15.
4
A researcher wished to compare the effect of the frequency of the rate of stepping on heart rate in a step-aerobics workout. A collection of 30 adult volunteers, 15 women and 15 men, was selected from a local gym. The men were randomly divided into three groups of five subjects each. Each group did a standard step-aerobics workout, with group 1 at a low rate of stepping, group 2 at a medium rate of stepping, and group 3 at a rapid rate. The women were also randomly divided into three groups of five subjects each. As with the men, each group did one of the three standard step-aerobics workouts. The mean heart rate at the end of the workout for all subjects was determined (in beats per minute). A partial ANOVA table for these data is given below. Analysis of variance for heart rate: The factors in the experiment are:
A)rate of stepping and heart rate.
B)rate of stepping and gender.
C)heart rate and gender.
D)gym membership and gender.
The factors in the experiment are:A)rate of stepping and heart rate.
B)rate of stepping and gender.
C)heart rate and gender.
D)gym membership and gender.
Unlock Deck
Unlock for access to all 23 flashcards in this deck.
Unlock Deck
k this deck
5
A population of flights can be classified according to two factors: duration (short, medium, or long) and purpose (vacation or business). We are interested in whether either of these factors has an effect on price. The table below gives mean prices for a balanced population. A medium-distance business flight costs $300 more than a short-distance business flight. However, a medium-distance vacation flights is only $200 more than a short-distance vacation flight. This difference between business and vacation flights is called:
A)interference of effects.
B)confusion of effects.
C)difference of effects.
D)interaction.
A medium-distance business flight costs $300 more than a short-distance business flight. However, a medium-distance vacation flights is only $200 more than a short-distance vacation flight. This difference between business and vacation flights is called:A)interference of effects.
B)confusion of effects.
C)difference of effects.
D)interaction.
Unlock Deck
Unlock for access to all 23 flashcards in this deck.
Unlock Deck
k this deck
6
A researcher wished to compare the effect of the frequency of the rate of stepping on heart rate in a step-aerobics workout. A collection of 30 adult volunteers, 15 women and 15 men, was selected from a local gym. The men were randomly divided into three groups of five subjects each. Each group did a standard step-aerobics workout, with group 1 at a low rate of stepping, group 2 at a medium rate of stepping, and group 3 at a rapid rate. The women were also randomly divided into three groups of five subjects each. As with the men, each group did one of the three standard step-aerobics workouts. The mean heart rate at the end of the workout for all subjects was determined (in beats per minute). A partial ANOVA table for these data is given below. Analysis of variance for heart rate: The plots and the P-value for the test for interaction show little evidence of interaction, which means that:
A)there is little difference in the heart rates of men and women.
B)the change in heart rate due to the different stepping rates is similar for men and women.
C)changes in stepping rate are positively associated with heart rate.
D)step exercise is equally beneficial to men and women.
The plots and the P-value for the test for interaction show little evidence of interaction, which means that:A)there is little difference in the heart rates of men and women.
B)the change in heart rate due to the different stepping rates is similar for men and women.
C)changes in stepping rate are positively associated with heart rate.
D)step exercise is equally beneficial to men and women.
Unlock Deck
Unlock for access to all 23 flashcards in this deck.
Unlock Deck
k this deck
7
Instructors gave caffeine to fruit flies to see if it affected their rest. The three treatments were a control, a low caffeine dose of 1 mg/ml of blood, and a higher caffeine dose of 5 mg/ml of blood. Fifteen fruit flies were assigned at random to three treatments, five to each treatment. The minutes of rest measured over a 12-hour period were recorded; the data follow. Minitab was used to obtain 95% simultaneous confidence intervals for the differences in means among the three treatments using Tukey's procedure; the results follow. The average minutes of rest for the five fruit flies assigned to the low-dose group was:
A)11 minutes higher than the average for the five fruit flies assigned to the control dose.
B)89.6 minutes lower than the average for the five fruit flies assigned to the high dose.
C)89.6 minutes higher than the average for the five fruit flies assigned to the high dose.
D)56.21 minutes higher than the average for the five fruit flies assigned to the control dose.
Minitab was used to obtain 95% simultaneous confidence intervals for the differences in means among the three treatments using Tukey's procedure; the results follow. The average minutes of rest for the five fruit flies assigned to the low-dose group was:A)11 minutes higher than the average for the five fruit flies assigned to the control dose.
B)89.6 minutes lower than the average for the five fruit flies assigned to the high dose.
C)89.6 minutes higher than the average for the five fruit flies assigned to the high dose.
D)56.21 minutes higher than the average for the five fruit flies assigned to the control dose.
Unlock Deck
Unlock for access to all 23 flashcards in this deck.
Unlock Deck
k this deck
8
A marketing researcher was studying the effect of a supermarket display on sales of a new product. There were two designs for the display: the first had greater visual appeal and the second contained more factual information about the product. Each type of display could be made in three sizes: small, medium, or large. Eighteen supermarkets were available for the study, and three supermarkets were selected at random to display each combination of design and size. The number of units of the product sold over a two-week period was recorded for each supermarket. For the resulting data, a two-way ANOVA was run, with the partial ANOVA table given below. Analysis of variance for sales: The numerical value of the F statistic used for testing for the main effect of size is:
A)0.59.
B)1.69.
C)3.4.
D)202.33.
The numerical value of the F statistic used for testing for the main effect of size is:A)0.59.
B)1.69.
C)3.4.
D)202.33.
Unlock Deck
Unlock for access to all 23 flashcards in this deck.
Unlock Deck
k this deck
9
A researcher wished to compare the effect of the frequency of the rate of stepping on heart rate in a step-aerobics workout. A collection of 30 adult volunteers, 15 women and 15 men, was selected from a local gym. The men were randomly divided into three groups of five subjects each. Each group did a standard step-aerobics workout, with group 1 at a low rate of stepping, group 2 at a medium rate of stepping, and group 3 at a rapid rate. The women were also randomly divided into three groups of five subjects each. As with the men, each group did one of the three standard step-aerobics workouts. The mean heart rate at the end of the workout for all subjects was determined (in beats per minute). A partial ANOVA table for these data is given below. Analysis of variance for heart rate: Since there is little evidence of interaction and the main effect of stepping is significant, we can conclude that:
A)the population mean heart rate for the rapid-rate group is higher than the other two groups.
B)the population mean heart rate for the low-rate group is lower than the other two groups.
C)the population mean heart rate for the low-rate group is lower than that of the medium-rate group.
D)None of the answer options is correct.
Since there is little evidence of interaction and the main effect of stepping is significant, we can conclude that:A)the population mean heart rate for the rapid-rate group is higher than the other two groups.
B)the population mean heart rate for the low-rate group is lower than the other two groups.
C)the population mean heart rate for the low-rate group is lower than that of the medium-rate group.
D)None of the answer options is correct.
Unlock Deck
Unlock for access to all 23 flashcards in this deck.
Unlock Deck
k this deck
10
A researcher wished to compare the effect of the frequency of the rate of stepping on heart rate in a step-aerobics workout. A collection of 30 adult volunteers, 15 women and 15 men, was selected from a local gym. The men were randomly divided into three groups of five subjects each. Each group did a standard step-aerobics workout, with group 1 at a low rate of stepping, group 2 at a medium rate of stepping, and group 3 at a rapid rate. The women were also randomly divided into three groups of five subjects each. As with the men, each group did one of the three standard step-aerobics workouts. The mean heart rate at the end of the workout for all subjects was determined (in beats per minute). A partial ANOVA table for these data is given below. Analysis of variance for heart rate: Which test was used to explore this problem?
A)a one-way ANOVA
B)a two-way ANOVA
C)multiple comparisons procedures (without contrasts)
D)multiple comparisons procedures (with contrasts)
Which test was used to explore this problem?A)a one-way ANOVA
B)a two-way ANOVA
C)multiple comparisons procedures (without contrasts)
D)multiple comparisons procedures (with contrasts)
Unlock Deck
Unlock for access to all 23 flashcards in this deck.
Unlock Deck
k this deck
11
A population of flights can be classified according to two factors: duration (short, medium, or long) and purpose (vacation or business). We are interested in whether either of these factors has an effect on price. The table below gives mean prices for a balanced population. The average cost of a business flight is:
A)$400.
B)$2600.
C)$650.
D)$866.67.
The average cost of a business flight is:A)$400.
B)$2600.
C)$650.
D)$866.67.
Unlock Deck
Unlock for access to all 23 flashcards in this deck.
Unlock Deck
k this deck
12
A marketing manager studied the effect of packaging on sales. Four designs were chosen: design 1 had three colors, design 2 had three colors and cartoons, design 3 had five colors, and design 4 had five colors and cartoons. The plot below provides means at all four levels of color and cartoon combinations. Based on the plot, what can we conclude?
A)Adding cartoons to three colors does not increase sales.
B)Adding cartoons to five colors increases sales.
C)Going from three to five colors increases sales.
D)All of the answer options are correct.
Based on the plot, what can we conclude?A)Adding cartoons to three colors does not increase sales.
B)Adding cartoons to five colors increases sales.
C)Going from three to five colors increases sales.
D)All of the answer options are correct.
Unlock Deck
Unlock for access to all 23 flashcards in this deck.
Unlock Deck
k this deck
13
A marketing researcher was studying the effect of a supermarket display on sales of a new product. There were two designs for the display: the first had greater visual appeal and the second contained more factual information about the product. Each type of display could be made in three sizes: small, medium, or large. Eighteen supermarkets were available for the study, and three supermarkets were selected at random to display each combination of design and size. The number of units of the product sold over a two-week period was recorded for each supermarket. For the resulting data, a two-way ANOVA was run, with the partial ANOVA table given below. Analysis of variance for sales: In the ANOVA table, the test for the main effect of design has a P-value of 0.613, which indicates that:
A)sales probably vary considerably for the different designs.
B)for about 61.3% of the samples, there was a difference in the effect of design.
C)for about 61.3% of the samples, there was no difference in the effect of design.
D)None of the answer options is correct.
In the ANOVA table, the test for the main effect of design has a P-value of 0.613, which indicates that:A)sales probably vary considerably for the different designs.
B)for about 61.3% of the samples, there was a difference in the effect of design.
C)for about 61.3% of the samples, there was no difference in the effect of design.
D)None of the answer options is correct.
Unlock Deck
Unlock for access to all 23 flashcards in this deck.
Unlock Deck
k this deck
14
A population of flights can be classified according to two factors: duration (short, medium, or long) and purpose (vacation or business). We are interested in whether either of these factors has an effect on price. The table below gives mean prices for a balanced population. The difference between the cost of a business flight and the cost of a vacation flight:
A)is constant across distance.
B)differs by distance.
C)depends on the time of day.
D)cannot be determined with the information given.
The difference between the cost of a business flight and the cost of a vacation flight:A)is constant across distance.
B)differs by distance.
C)depends on the time of day.
D)cannot be determined with the information given.
Unlock Deck
Unlock for access to all 23 flashcards in this deck.
Unlock Deck
k this deck
15
Which test should be used to determine whether there are differences between the means of several groups that can be segmented according to two different explanatory variables?
A)a one-way ANOVA
B)a two-way ANOVA
C)multiple comparisons procedures (without contrasts)
D)multiple comparisons procedures (with contrasts)
A)a one-way ANOVA
B)a two-way ANOVA
C)multiple comparisons procedures (without contrasts)
D)multiple comparisons procedures (with contrasts)
Unlock Deck
Unlock for access to all 23 flashcards in this deck.
Unlock Deck
k this deck
16
A marketing manager studied the effect of packaging on sales. Four designs were chosen: design 1 three colors, design 2 had three colors and cartoons, design 3 had five colors, and design 4 had five colors and cartoons. The ANOVA table below analyzes the effects of varying the number of colors and adding cartoons on sales. There were 20 stores where the boxes with the new designs were sold. Analysis of Variance for Sales The F statistic for testing that there is no interaction is:
A)10.23.
B)5.5.
C)43.68.
D)None of the answer options is correct.
The F statistic for testing that there is no interaction is:A)10.23.
B)5.5.
C)43.68.
D)None of the answer options is correct.
Unlock Deck
Unlock for access to all 23 flashcards in this deck.
Unlock Deck
k this deck
17
A marketing researcher was studying the effect of a supermarket display on sales of a new product. There were two designs for the display: the first had greater visual appeal and the second contained more factual information about the product. Each type of display could be made in three sizes: small, medium, or large. Eighteen supermarkets were available for the study, and three supermarkets were selected at random to display each combination of design and size. The number of units of the product sold over a two-week period was recorded for each supermarket. For the resulting data, a two-way ANOVA was run, with the partial ANOVA table given below. Analysis of variance for sales: Which statement best describes the type of experiment being run?
A)This is a two-factor experiment-each factor is at three levels.
B)This is a six-level experiment-each level has three observations.
C)This is a two-factor experiment-one factor is at two levels and the other factor is at three levels.
D)None of the answer options is correct.
Which statement best describes the type of experiment being run?A)This is a two-factor experiment-each factor is at three levels.
B)This is a six-level experiment-each level has three observations.
C)This is a two-factor experiment-one factor is at two levels and the other factor is at three levels.
D)None of the answer options is correct.
Unlock Deck
Unlock for access to all 23 flashcards in this deck.
Unlock Deck
k this deck
18
A population of flights can be classified according to two factors: duration (short, medium, or long) and purpose (vacation or business). We are interested in whether either of these factors has an effect on price. The table below gives mean prices for a balanced population. The average price for short flights is:
A)$400.
B)$300.
C)$200.
D)None of the answer options is correct.
The average price for short flights is:A)$400.
B)$300.
C)$200.
D)None of the answer options is correct.
Unlock Deck
Unlock for access to all 23 flashcards in this deck.
Unlock Deck
k this deck
19
Which test should be used to determine whether there are differences between the means of several groups that cannot be segmented according to two different explanatory variables?
A)a one-way ANOVA
B)a two-way ANOVA
C)multiple comparisons procedures (without contrasts)
D)multiple comparisons procedures (with contrasts)
A)a one-way ANOVA
B)a two-way ANOVA
C)multiple comparisons procedures (without contrasts)
D)multiple comparisons procedures (with contrasts)
Unlock Deck
Unlock for access to all 23 flashcards in this deck.
Unlock Deck
k this deck
20
A researcher wished to compare the effect of the frequency of the rate of stepping on heart rate in a step-aerobics workout. A collection of 30 adult volunteers, 15 women and 15 men, was selected from a local gym. The men were randomly divided into three groups of five subjects each. Each group did a standard step-aerobics workout, with group 1 at a low rate of stepping, group 2 at a medium rate of stepping, and group 3 at a rapid rate. The women were also randomly divided into three groups of five subjects each. As with the men, each group did one of the three standard step-aerobics workouts. The mean heart rate at the end of the workout for all subjects was determined (in beats per minute). A partial ANOVA table for these data is given below. Analysis of variance for heart rate: The pooled standard error is:
A)15.5.
B)75.9.
C)240.1.
D)5762.
The pooled standard error is:A)15.5.
B)75.9.
C)240.1.
D)5762.
Unlock Deck
Unlock for access to all 23 flashcards in this deck.
Unlock Deck
k this deck
21
A population of flights can be classified according to two factors: duration (short, medium, or long) and purpose (vacation or business). We are interested in whether either of these factors has an effect on price. The table below gives mean prices for a balanced population and shows the presence of interactions. If a study is conducted and we think there may be interactions, we should:
A)find the F test for interaction first and, if the P-value is small enough to reject the null hypothesis of no interaction, assess the effects of distance separately for business and vacation flights.
B)test for effects of distance first and, if there is no distance effect, ignore the interactions.
C)find the F tests for distance effects and for type of trip and, if there is no effect for either, declare that all the means are the same.
D)drop observations that cause the interaction and repeat the analysis.
If a study is conducted and we think there may be interactions, we should:A)find the F test for interaction first and, if the P-value is small enough to reject the null hypothesis of no interaction, assess the effects of distance separately for business and vacation flights.
B)test for effects of distance first and, if there is no distance effect, ignore the interactions.
C)find the F tests for distance effects and for type of trip and, if there is no effect for either, declare that all the means are the same.
D)drop observations that cause the interaction and repeat the analysis.
Unlock Deck
Unlock for access to all 23 flashcards in this deck.
Unlock Deck
k this deck
22
A study compared dry matter intake (dmi) in mature cows (C) and heifers (H) receiving no treatment (control), treatment A, or treatment B. The two factors are type of animal and treatment. Each factor combination had eight animals. A partial ANOVA table is given below. The F test for interaction is:
A)83.2.
B)20.3.
C)3.02.
D)0.85.
The F test for interaction is:A)83.2.
B)20.3.
C)3.02.
D)0.85.
Unlock Deck
Unlock for access to all 23 flashcards in this deck.
Unlock Deck
k this deck
23
A study compared dry matter intake (dmi) in mature cows (C) and heifers (H) receiving no treatment (control), treatment A, or treatment B. The two factors are type of animal and treatment. Each factor combination has eight animals. The above plot of the means, which is derived from a two-factor analysis of variance, is called:
A)an interaction plot.
B)a parallel means plot.
C)a nonparallel means plot.
D)a crossover plot.
The above plot of the means, which is derived from a two-factor analysis of variance, is called:A)an interaction plot.
B)a parallel means plot.
C)a nonparallel means plot.
D)a crossover plot.
Unlock Deck
Unlock for access to all 23 flashcards in this deck.
Unlock Deck
k this deck
Unlock Deck
Unlock for access to all 23 flashcards in this deck.


