Deck 4: Section 5: Applications of Differentiation
Full screen (f)
Question
Sketch the graph of the function  using any extrema, intercepts, symmetry, and asymptotes.
A)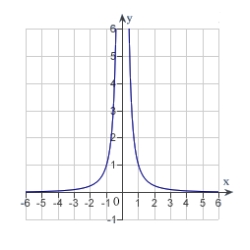
B)
C)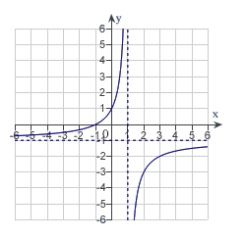
D)
E)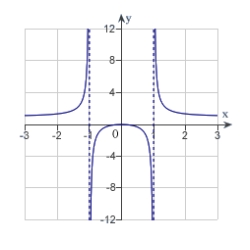
using any extrema, intercepts, symmetry, and asymptotes.A)
B)
C)
D)
E)
Question
Find the limit. 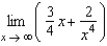
A)
B) 2
C) 0
D)
E)
A)
B) 2
C) 0
D)
E)
Question
Find the limit. 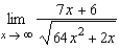
A)
B)
C) 1
D) 7
E)
A)
B)
C) 1
D) 7
E)
Question
A container holds 3 liters of a 25% brine solution. A model for the concentration C of the mixture after adding x liters of a 0.67 % brine solution to the container and then draining x liters of the well-mixed solution is given as  . Find
  . Round your answer to two decimal places.
A) 1.00 %
B) 0.17 %
C) 0.70 %
D) 0.67 %
E) 0.25 %
. Find . Round your answer to two decimal places.A) 1.00 %
B) 0.17 %
C) 0.70 %
D) 0.67 %
E) 0.25 %
Question
Find the limit. 
A)
B) 1
C) 0
D)
E)
A)
B) 1
C) 0
D)
E)
Question
Find the limit. 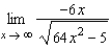
A)
B)
C) 1
D) -6
E)
A)
B)
C) 1
D) -6
E)
Question
The graph shows the temperature T, in degrees Fahrenheit, of molten glass t seconds after it is removed from a kiln. 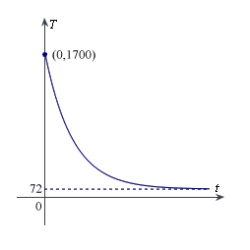 Find
Find  .
.
A)
B)
C)
D)
E)
Find .A)
B)
C)
D)
E)
Question
A heat probe is attached to the heat exchanger of a heating system. The temperature T (in degrees Celsius) is recorded t seconds after the furnace is started. A model for the data recorded for the first two minutes is given by  . Find
  .
.
A)
B)
C)
D)
E)
. Find .A)
B)
C)
D)
E)
Question
Sketch the graph of the relation  using any extrema, intercepts, symmetry, and asymptotes.
A)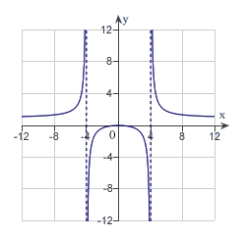
B)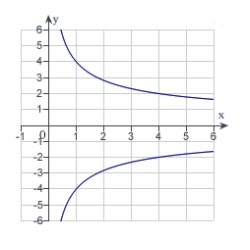
C)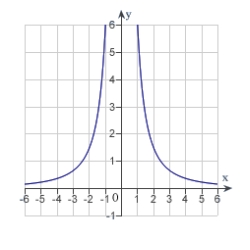
D)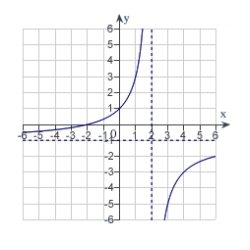
E)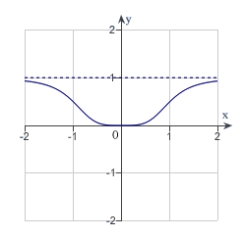
using any extrema, intercepts, symmetry, and asymptotes.A)
B)
C)
D)
E)
Question
For the function  , use a graphing utility to complete the table and estimate the limit as x approaches infinity.
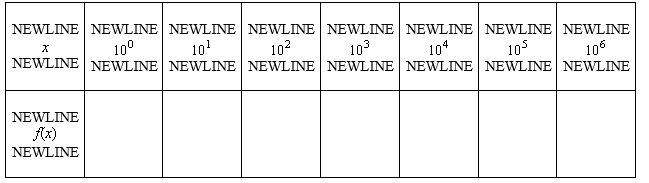
A) 0.8000
B) 1.8000
C) 1.2500
D) 2.2500
E) 0.2500
, use a graphing utility to complete the table and estimate the limit as x approaches infinity. A) 0.8000
B) 1.8000
C) 1.2500
D) 2.2500
E) 0.2500
Question
Match the function  with one of the following graphs.
A)
B)
C)
D)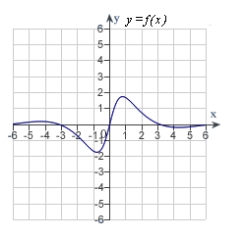
E)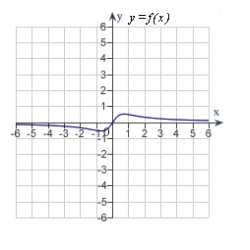
with one of the following graphs.A)
B)
C)
D)
E)
Question
Find the limit. 
A)
B) 3
C)
D) -3
E) 5
A)
B) 3
C)
D) -3
E) 5
Question
Sketch the graph of the relation  using any extrema, intercepts, symmetry, and asymptotes.
A)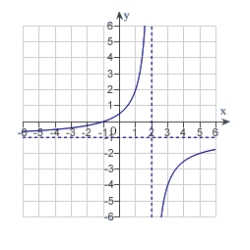
B)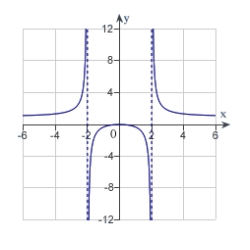
C)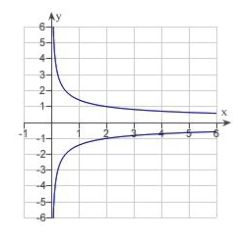
D)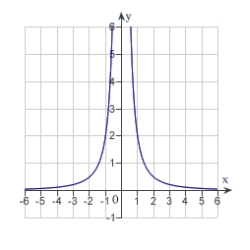
E)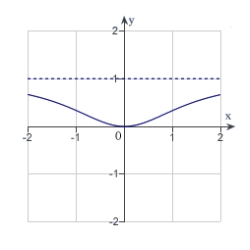
using any extrema, intercepts, symmetry, and asymptotes.A)
B)
C)
D)
E)
Question
Match the function  with one of the following graphs.
A)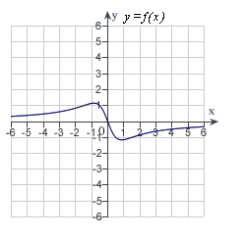
B)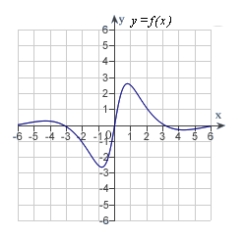
C)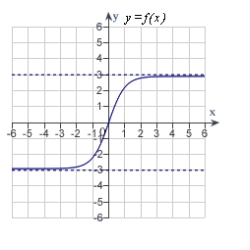
D)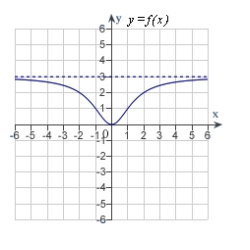
E)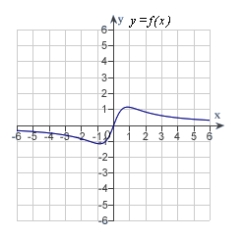
with one of the following graphs.A)
B)
C)
D)
E)
Question
A business has a cost of  for producing x units. The average cost per unit is
  Find the limit of
  as x approaches infinity.
A) 333.3
B) 1
C) 500
D) 0
E) 1.5
for producing x units. The average cost per unit is Find the limit of as x approaches infinity.A) 333.3
B) 1
C) 500
D) 0
E) 1.5
Question
Match the function  with one of the following graphs.
A)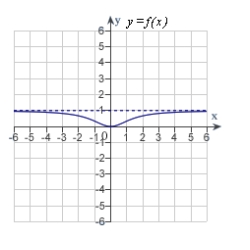
B)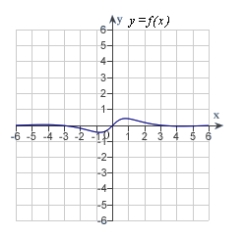
C)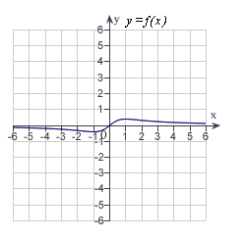
D)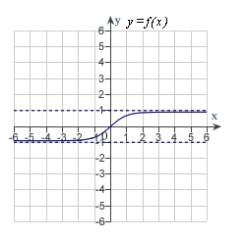
E)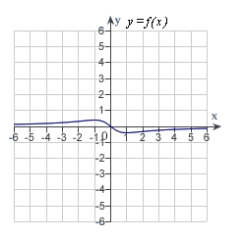
with one of the following graphs.A)
B)
C)
D)
E)
Question
Find the limit. 
A) 1
B) 0
C)
D)
E) does not exist
A) 1
B) 0
C)
D)
E) does not exist
Question
For the function 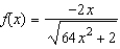 , use a graphing utility to complete the table and estimate the limit as x approaches infinity.
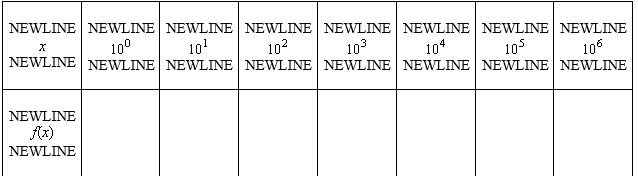
A) -0.2500
B) 1.0000
C) 2.1800
D) -0.9000
E) does not exist
, use a graphing utility to complete the table and estimate the limit as x approaches infinity. A) -0.2500
B) 1.0000
C) 2.1800
D) -0.9000
E) does not exist
Question
For the function 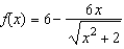 , use a graphing utility to complete the table and estimate the limit as x approaches infinity.
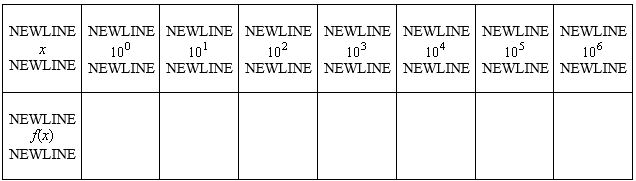
A) -6
B) 2
C) 6
D) 0
E) None of the above
, use a graphing utility to complete the table and estimate the limit as x approaches infinity. A) -6
B) 2
C) 6
D) 0
E) None of the above
Question
Sketch the graph of the function  using any extrema, intercepts, symmetry, and asymptotes.
A)
B)
C)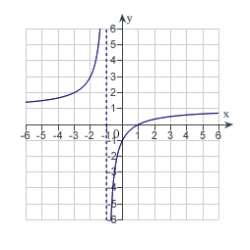
D)
E)
using any extrema, intercepts, symmetry, and asymptotes.A)
B)
C)
D)
E)
Question
Find the point on the graph of the function  that is closest to the point
  . Round all numerical values in your answer to four decimal places.
A)
B)
C)
D)
E)
that is closest to the point . Round all numerical values in your answer to four decimal places.A)
B)
C)
D)
E)
Question
Find the point on the graph of the function  that is closest to the point
  .
.
A)
B)
C)
D)
E)
that is closest to the point .A)
B)
C)
D)
E)
Question
A rectangular page is to contain  square inches of print. The margins on each side are 1 inch. Find the dimensions of the page such that the least amount of paper is used.
A)
B)
C)
D)
E)
square inches of print. The margins on each side are 1 inch. Find the dimensions of the page such that the least amount of paper is used.A)
B)
C)
D)
E)

Unlock Deck
Sign up to unlock the cards in this deck!
Unlock Deck
Unlock Deck
1/23
Play
Full screen (f)
Deck 4: Section 5: Applications of Differentiation
1
Sketch the graph of the function using any extrema, intercepts, symmetry, and asymptotes.
A)
B)
C)
D)
E)
using any extrema, intercepts, symmetry, and asymptotes.A)
B)
C)
D)
E)
2
Find the limit.
A)
B) 2
C) 0
D)
E)
A)
B) 2
C) 0
D)
E)
3
Find the limit.
A)
B)
C) 1
D) 7
E)
A)
B)
C) 1
D) 7
E)
4
A container holds 3 liters of a 25% brine solution. A model for the concentration C of the mixture after adding x liters of a 0.67 % brine solution to the container and then draining x liters of the well-mixed solution is given as . Find . Round your answer to two decimal places.
A) 1.00 %
B) 0.17 %
C) 0.70 %
D) 0.67 %
E) 0.25 %
. Find . Round your answer to two decimal places.A) 1.00 %
B) 0.17 %
C) 0.70 %
D) 0.67 %
E) 0.25 %
Unlock Deck
Unlock for access to all 23 flashcards in this deck.
Unlock Deck
k this deck
5
Find the limit.
A)
B) 1
C) 0
D)
E)
A)
B) 1
C) 0
D)
E)
Unlock Deck
Unlock for access to all 23 flashcards in this deck.
Unlock Deck
k this deck
6
Find the limit.
A)
B)
C) 1
D) -6
E)
A)
B)
C) 1
D) -6
E)
Unlock Deck
Unlock for access to all 23 flashcards in this deck.
Unlock Deck
k this deck
7
The graph shows the temperature T, in degrees Fahrenheit, of molten glass t seconds after it is removed from a kiln. Find .
A)
B)
C)
D)
E)
Find .A)
B)
C)
D)
E)
Unlock Deck
Unlock for access to all 23 flashcards in this deck.
Unlock Deck
k this deck
8
A heat probe is attached to the heat exchanger of a heating system. The temperature T (in degrees Celsius) is recorded t seconds after the furnace is started. A model for the data recorded for the first two minutes is given by . Find .
A)
B)
C)
D)
E)
. Find .A)
B)
C)
D)
E)
Unlock Deck
Unlock for access to all 23 flashcards in this deck.
Unlock Deck
k this deck
9
Sketch the graph of the relation using any extrema, intercepts, symmetry, and asymptotes.
A)
B)
C)
D)
E)
using any extrema, intercepts, symmetry, and asymptotes.A)
B)
C)
D)
E)
Unlock Deck
Unlock for access to all 23 flashcards in this deck.
Unlock Deck
k this deck
10
For the function , use a graphing utility to complete the table and estimate the limit as x approaches infinity.
A) 0.8000
B) 1.8000
C) 1.2500
D) 2.2500
E) 0.2500
, use a graphing utility to complete the table and estimate the limit as x approaches infinity. A) 0.8000
B) 1.8000
C) 1.2500
D) 2.2500
E) 0.2500
Unlock Deck
Unlock for access to all 23 flashcards in this deck.
Unlock Deck
k this deck
11
Match the function with one of the following graphs.
A)
B)
C)
D)
E)
with one of the following graphs.A)
B)
C)
D)
E)
Unlock Deck
Unlock for access to all 23 flashcards in this deck.
Unlock Deck
k this deck
12
Find the limit.
A)
B) 3
C)
D) -3
E) 5
A)
B) 3
C)
D) -3
E) 5
Unlock Deck
Unlock for access to all 23 flashcards in this deck.
Unlock Deck
k this deck
13
Sketch the graph of the relation using any extrema, intercepts, symmetry, and asymptotes.
A)
B)
C)
D)
E)
using any extrema, intercepts, symmetry, and asymptotes.A)
B)
C)
D)
E)
Unlock Deck
Unlock for access to all 23 flashcards in this deck.
Unlock Deck
k this deck
14
Match the function with one of the following graphs.
A)
B)
C)
D)
E)
with one of the following graphs.A)
B)
C)
D)
E)
Unlock Deck
Unlock for access to all 23 flashcards in this deck.
Unlock Deck
k this deck
15
A business has a cost of for producing x units. The average cost per unit is Find the limit of as x approaches infinity.
A) 333.3
B) 1
C) 500
D) 0
E) 1.5
for producing x units. The average cost per unit is Find the limit of as x approaches infinity.A) 333.3
B) 1
C) 500
D) 0
E) 1.5
Unlock Deck
Unlock for access to all 23 flashcards in this deck.
Unlock Deck
k this deck
16
Match the function with one of the following graphs.
A)
B)
C)
D)
E)
with one of the following graphs.A)
B)
C)
D)
E)
Unlock Deck
Unlock for access to all 23 flashcards in this deck.
Unlock Deck
k this deck
17
Find the limit.
A) 1
B) 0
C)
D)
E) does not exist
A) 1
B) 0
C)
D)
E) does not exist
Unlock Deck
Unlock for access to all 23 flashcards in this deck.
Unlock Deck
k this deck
18
For the function , use a graphing utility to complete the table and estimate the limit as x approaches infinity.
A) -0.2500
B) 1.0000
C) 2.1800
D) -0.9000
E) does not exist
, use a graphing utility to complete the table and estimate the limit as x approaches infinity. A) -0.2500
B) 1.0000
C) 2.1800
D) -0.9000
E) does not exist
Unlock Deck
Unlock for access to all 23 flashcards in this deck.
Unlock Deck
k this deck
19
For the function , use a graphing utility to complete the table and estimate the limit as x approaches infinity.
A) -6
B) 2
C) 6
D) 0
E) None of the above
, use a graphing utility to complete the table and estimate the limit as x approaches infinity. A) -6
B) 2
C) 6
D) 0
E) None of the above
Unlock Deck
Unlock for access to all 23 flashcards in this deck.
Unlock Deck
k this deck
20
Sketch the graph of the function using any extrema, intercepts, symmetry, and asymptotes.
A)
B)
C)
D)
E)
using any extrema, intercepts, symmetry, and asymptotes.A)
B)
C)
D)
E)
Unlock Deck
Unlock for access to all 23 flashcards in this deck.
Unlock Deck
k this deck
21
Find the point on the graph of the function that is closest to the point . Round all numerical values in your answer to four decimal places.
A)
B)
C)
D)
E)
that is closest to the point . Round all numerical values in your answer to four decimal places.A)
B)
C)
D)
E)
Unlock Deck
Unlock for access to all 23 flashcards in this deck.
Unlock Deck
k this deck
22
Find the point on the graph of the function that is closest to the point .
A)
B)
C)
D)
E)
that is closest to the point .A)
B)
C)
D)
E)
Unlock Deck
Unlock for access to all 23 flashcards in this deck.
Unlock Deck
k this deck
23
A rectangular page is to contain square inches of print. The margins on each side are 1 inch. Find the dimensions of the page such that the least amount of paper is used.
A)
B)
C)
D)
E)
square inches of print. The margins on each side are 1 inch. Find the dimensions of the page such that the least amount of paper is used.A)
B)
C)
D)
E)
Unlock Deck
Unlock for access to all 23 flashcards in this deck.
Unlock Deck
k this deck
Unlock Deck
Unlock for access to all 23 flashcards in this deck.


