Deck 26: Understanding Probability Distributions and Statistical Inference
Full screen (f)
Question
Question
Question
Question
Question
Question
Question
Question
Question
Question
Use the following to answer the question(s) below.
An advocacy group is investigating whether gender has an effect on job category in large investment firms. They surveyed a sample of firms with the following results:
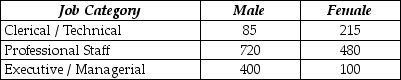
What is the probability that a randomly selected employee's job category is executive/managerial, given that the employee is female?
A) 0.13
B) 0.20
C) 0.80
D) 0.05
E) 0.45
An advocacy group is investigating whether gender has an effect on job category in large investment firms. They surveyed a sample of firms with the following results:
What is the probability that a randomly selected employee's job category is executive/managerial, given that the employee is female?
A) 0.13
B) 0.20
C) 0.80
D) 0.05
E) 0.45
Question
Question
Question
Question
Use the following to answer the question(s) below.
An advocacy group is investigating whether gender has an effect on job category in large investment firms. They surveyed a sample of firms with the following results:
Two events F = {a randomly selected employee is female} and S = {a randomly selected employee's job category is professional staff} are
A) independent.
B) not independent.
C) mutually exclusive.
D) independent and mutually exclusive.
E) disjoint.
Question
Question
Question
Question
Question
Use the following to answer the question(s) below.
An advocacy group is investigating whether gender has an effect on job category in large investment firms. They surveyed a sample of firms with the following results:
What is the probability that a randomly selected employee's job category is executive/managerial?
A) 0.20
B) 0.80
C) 0.13
D) 0.45
E) 0.25
Question
Question
Use the following to answer the question(s) below.
Three brands of AAA batteries are compared to determine if differences in lifetime exist. Each brand is tested in four devices (TV remote, hand-held game, flashlight and digital camera). The experiment is run once for each combination of brand and device. The twelve runs are ordered randomly. The time (in minutes) that each battery lasts under continuous usage is recorded. The partial ANOVA results are as follows: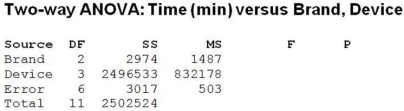
Which of the following statements is true about this design?
A) This is a completely randomized design in one factor.
B) The devices serve as blocks to account for the variability between the lengths of time batteries last in different devices.
C) We know that the interaction effect between brand of battery and type of device is significant.
D) This is no treatment in study.
E) This is a retrospective study.
Question
Use the following to answer the question(s) below.
Chris Columbus is responsible for controlling inventory levels for four types of sailboats sold by his company. Chris takes a sample of 48 boats sold over the past several months to determine if demand is the same for each type. His results are as follows:
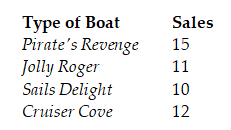
The calculated value of the Chi-square statistic is
A) 7.815.
B) 1.17.
C) 22.35.
D) -1.17.
E) 12.56.
Chris Columbus is responsible for controlling inventory levels for four types of sailboats sold by his company. Chris takes a sample of 48 boats sold over the past several months to determine if demand is the same for each type. His results are as follows:
The calculated value of the Chi-square statistic is
A) 7.815.
B) 1.17.
C) 22.35.
D) -1.17.
E) 12.56.
Question
Question
Based on the scatterplot shown below, what makes a nonparametric method more appropriate than the Pearson correlation for measuring the association between the two variables? 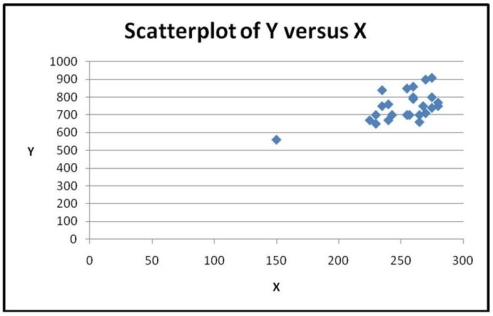
A) Nonlinearity
B) These variables are not quantitative.
C) The presence of an outlier
D) Violation of Linearity Condition and the fact that these variables are not quantitative
E) There is no unusual observation, but we have to deal with a bend in the data.
A) Nonlinearity
B) These variables are not quantitative.
C) The presence of an outlier
D) Violation of Linearity Condition and the fact that these variables are not quantitative
E) There is no unusual observation, but we have to deal with a bend in the data.
Question
Question
Use the following to answer the question(s) below.
Chris Columbus is responsible for controlling inventory levels for four types of sailboats sold by his company. Chris takes a sample of 48 boats sold over the past several months to determine if demand is the same for each type. His results are as follows:
At the 0.05 level of significance, the correct conclusion is
A) evidence suggests that the demand is the same for different types of boats.
B) evidence suggests that the demand is not the same for different types of boats.
C) reject the null hypothesis.
D) evidence suggests that the demand is dependent on the type of boat.
E) evidence suggests that type of boat affects the demand.
Question
Use the following to answer the question(s) below.
Three brands of AAA batteries are compared to determine if differences in lifetime exist. Each brand is tested in four devices (TV remote, hand-held game, flashlight and digital camera). The experiment is run once for each combination of brand and device. The twelve runs are ordered randomly. The time (in minutes) that each battery lasts under continuous usage is recorded. The partial ANOVA results are as follows:
The P-value associated with this F-statistic associated with the brands is 0.128. Based on this, we can conclude that
A) we should reject the null hypothesis.
B) there is a difference in the mean lifetimes among the different brands.
C) there is no significant difference in the mean lifetimes among the different devices.
D) we should support the alternative hypothesis.
E) there is no difference in the mean lifetimes among the different brands.
Question
Use the following to answer the question(s) below.
Chris Columbus is responsible for controlling inventory levels for four types of sailboats sold by his company. Chris takes a sample of 48 boats sold over the past several months to determine if demand is the same for each type. His results are as follows:
The correct null hypothesis to be tested is
A) type of boat and demand are related.
B) the demand differs for each type of boat.
C) the demand is the same for each type of boat.
D) the demand is dependent on the type of boat.
E) type of boat affects the demand.
Question
The following plot is the best for checking 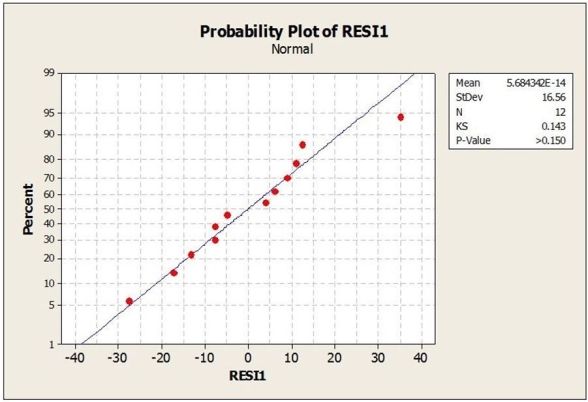
A) Equal Variance Assumption.
B) Linearity Assumption.
C) Nearly Normal Condition.
D) Non-linear Condition.
E) Dependence Condition.
A) Equal Variance Assumption.
B) Linearity Assumption.
C) Nearly Normal Condition.
D) Non-linear Condition.
E) Dependence Condition.
Question
Question
Suppose that 6 economists who work for the federal government and 7 university economists were asked to grade the effectiveness of an economic stimulus bill in terms of its ability to increase jobs over the next two years. The grades are shown in below. Using the appropriate nonparametric method, the calculated value of the test statistic is
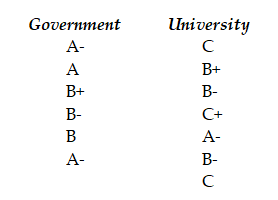
A) T = TGovernment = 55.5.
B) T= 30.
C) T = 54.
D) T = TUniversity = 35.5.
E) T = 91.
A) T = TGovernment = 55.5.
B) T= 30.
C) T = 54.
D) T = TUniversity = 35.5.
E) T = 91.
Question
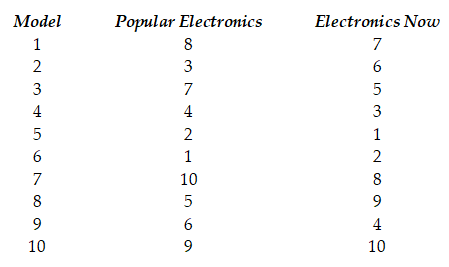
Suppose that ten new smart phone models were evaluated by two consumer electronics magazines (Popular Electronics and Electronics Now) from 1 (best) to 10 (worst) as shown below. Why is the Spearman's rho more appropriate than the correlation coefficient for these data?
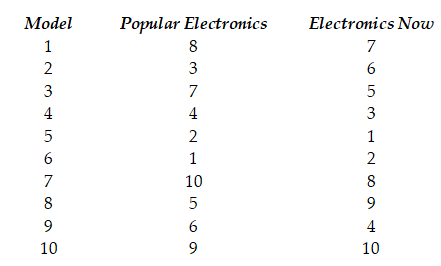
A) The relationship is nonlinear.
B) The data are ordinal.
C) The data are not paired.
D) There is one extreme outlier.
E) Both outliers and bends in the data make the correlation coefficient difficult to interpret.
A) The relationship is nonlinear.
B) The data are ordinal.
C) The data are not paired.
D) There is one extreme outlier.
E) Both outliers and bends in the data make the correlation coefficient difficult to interpret.
Question
Question
Question
Use the following to answer the question(s) below.
A sample of 30-year fixed mortgage rates at 12 randomly chosen credit unions yields a mean rate of 6.65 % and a sample standard deviation of 0.39%. A sample of 30-year fixed mortgage rates at 16 randomly selected banks yields a mean rate of 7.05% and a sample standard deviation of 0.22%. Are the mean rates different between credit unions and banks? Relevant output is shown below.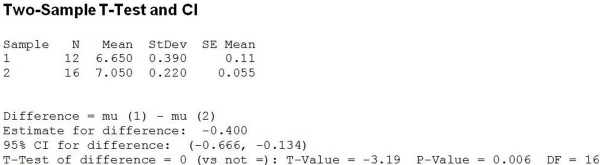
Which of the following is true?
A) This is a paired t-test.
B) This is a test for two means from independent samples.
C) This is a one-tailed test.
D) This is a paired design and one-tailed t-test.
E) This is a pooled t-test.
Question
Question
A professor was interested in determining whether the prices of new textbooks in the bookstore were higher than if purchased online. She selected 6 textbooks and priced each at the bookstore and online. Which statement is true at 5% significance level? 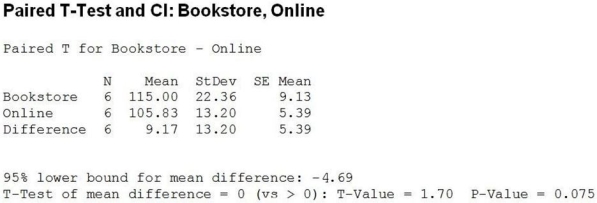
A) There is not enough evidence to suggest that the prices of new textbooks in the bookstore were higher than if purchased online, on average.
B) There is strong evidence that the prices are higher in the bookstore.
C) We are 95% sure that the prices are higher online.
D) There is strong evidence that the prices in the bookstore and online are different.
E) We are 95% sure that the prices in the bookstore and online are exactly the same.
Question
Use the following to answer the question(s) below.
Three brands of AAA batteries are compared to determine if differences in lifetime exist. Each brand is tested in four devices (TV remote, hand-held game, flashlight and digital camera). The experiment is run once for each combination of brand and device. The twelve runs are ordered randomly. The time (in minutes) that each battery lasts under continuous usage is recorded. The partial ANOVA results are as follows:
The F-statistic for testing whether the three brands of AAA batteries have equal mean lifetimes is
A) 2.96.
B) 1654.89.
C) 0.98.
D) 827.49.
E) 54.67.
Question
Use the following to answer the question(s) below.
A sample of 30-year fixed mortgage rates at 12 randomly chosen credit unions yields a mean rate of 6.65 % and a sample standard deviation of 0.39%. A sample of 30-year fixed mortgage rates at 16 randomly selected banks yields a mean rate of 7.05% and a sample standard deviation of 0.22%. Are the mean rates different between credit unions and banks? Relevant output is shown below.
At the 0.05 level of significance, the correct conclusion is
A) reject the alternative hypothesis.
B) fail to reject the null hypothesis.
C) evidence suggests that there is no significant difference in mean mortgage rates between credit unions and banks.
D) reject the null hypothesis; evidence suggests that there is a significant difference in mean mortgage rates between credit unions and banks.
E) fail to reject the null hypothesis; evidence suggests that the mortgage rates at credit unions are lower than at banks, on average.
Question
Question
Use the following to answer the question(s) below.
A government agency has 6000 employees. As an alternative to the traditional five day work week, employees were asked whether they preferred a four-day work week (10 hours per day) or flexible hours. The table below shows the results by age category.
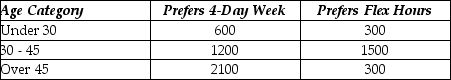
What is the probability that an employee prefers flex hours given that he/she is in the 30-45 age group?
A) 0.90
B) 0.56
C) 0.31
D) 0.80
E) 0.67
A government agency has 6000 employees. As an alternative to the traditional five day work week, employees were asked whether they preferred a four-day work week (10 hours per day) or flexible hours. The table below shows the results by age category.
What is the probability that an employee prefers flex hours given that he/she is in the 30-45 age group?
A) 0.90
B) 0.56
C) 0.31
D) 0.80
E) 0.67
Question
Use the following to answer the question(s) below.
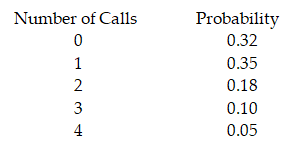
IT staff for a large corporation has developed the following probability distribution for the number of calls requiring troubleshooting problems per day.
After computing a confidence interval, the investigator believes that the results are meaningless because the width of the interval is too large. In reconstructing the interval, the investigator should
A) decrease the sample size.
B) increase the level of confidence.
C) increase the sample size.
D) reduce the population variance.
E) increase the margin of error.
Question
Use the following to answer the question(s) below.
A government agency has 6000 employees. As an alternative to the traditional five day work week, employees were asked whether they preferred a four-day work week (10 hours per day) or flexible hours. The table below shows the results by age category.
What is the probability that an employee at this government agency prefers a four-day work week?
A) 0.54
B) 0.15
C) 0.50
D) 0.35
E) 0.65
Question
Question
Question
Use the following to answer the question(s) below.
IT staff for a large corporation has developed the following probability distribution for the number of calls requiring troubleshooting problems per day.
The expected number of calls per day is
A) 2.77.
B) 1.56.
C) 1.21.
D) 1.31.
E) 1.0.
IT staff for a large corporation has developed the following probability distribution for the number of calls requiring troubleshooting problems per day.
The expected number of calls per day is
A) 2.77.
B) 1.56.
C) 1.21.
D) 1.31.
E) 1.0.
Question
Question
Question
Use the following to answer the question(s) below.
Shape-Up-By-Susie claims that participating in her exercise program will result in guaranteed weight loss in just 6 weeks. Five clients weighed themselves before and then again after participating in her program and the differences "weight after - weight before" were analyzed. Below is the relevant computer output.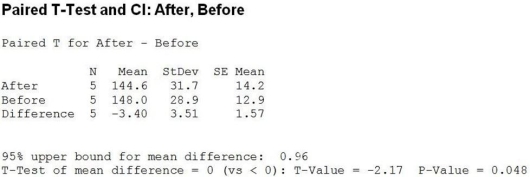
Which of the following statement is true?
A) This is a pooled t-test.
B) This is a two-tailed test.
C) This is a two-sample t-test for independent groups.
D) This is a pooled and two-tailed t-test.
E) This is a paired t-test, and it is also one-tailed.
Question
Question
Use the following to answer the question(s) below.
IT staff for a large corporation has developed the following probability distribution for the number of calls requiring troubleshooting problems per day.
The standard deviation of the sampling distribution of mean times is
A) 0.4 minutes.
B) 2 minutes.
C) 0.08 minutes.
D) 1.6 minutes.
E) 0.12 minutes.
Question
Use the following to answer the question(s) below.
IT staff for a large corporation has developed the following probability distribution for the number of calls requiring troubleshooting problems per day.
If a population is normally distributed with µ = 500 and σ = 50, and a sample of size 20 is selected, the probability that the sample mean falls between 450 and 550 will be ________ the probability that an individual value falls between 450 and 550.
A) the same as
B) less than
C) greater than
D) less than or the same as
E) approximately the same as
Question
Question
Question
Question
Use the following to answer the question(s) below.
IT staff for a large corporation has developed the following probability distribution for the number of calls requiring troubleshooting problems per day.
The standard deviation of the number of calls per day is
A) 1.31.
B) 1.14.
C) 2.77.
D) 1.56.
E) 1.21.
IT staff for a large corporation has developed the following probability distribution for the number of calls requiring troubleshooting problems per day.
The standard deviation of the number of calls per day is
A) 1.31.
B) 1.14.
C) 2.77.
D) 1.56.
E) 1.21.
Question
Use the following to answer the question(s) below.
A government agency has 6000 employees. As an alternative to the traditional five day work week, employees were asked whether they preferred a four-day work week (10 hours per day) or flexible hours. The table below shows the results by age category.
Two events F = {a randomly selected employee prefers flex hours} and O = {a randomly selected employee is over 45 years old} are
A) independent.
B) mutually exclusive.
C) not independent.
D) independent and mutually exclusive.
E) disjoint.
Question
Use the following to answer the question(s) below.
IT staff for a large corporation has developed the following probability distribution for the number of calls requiring troubleshooting problems per day.
Which is true about a 99% confidence interval based on a given sample?
A) If we increase the sample size, the width of the interval will increase.
B) The interval contains 99% of the population.
C) Results from 99% of all samples will lie in this interval.
D) The interval is wider than a 95% confidence interval would be.
E) The interval is narrower than a 95% confidence interval would be.
Question
Question
Use the following to answer the question(s) below.
IT staff for a large corporation has developed the following probability distribution for the number of calls requiring troubleshooting problems per day.
What is the probability that the sample mean will be less than 7.5 minutes?
A) 0.3944
B) 0.1056
C) 0.2114
D) 0.4013
E) 0.8944
IT staff for a large corporation has developed the following probability distribution for the number of calls requiring troubleshooting problems per day.
What is the probability that the sample mean will be less than 7.5 minutes?
A) 0.3944
B) 0.1056
C) 0.2114
D) 0.4013
E) 0.8944
Question
Use the following to answer the question(s) below.
Preparing wheat for use in bread and pasta products generally involves both milling and bleaching. A company that processes wheat is interested in determining the best combination of milling and bleaching that results in a desirable wheat product without sacrificing fibre content. They vary the milling time (short, medium and long) and bleaching (no bleaching and bleaching) and measure fibre content (gms/100 grams) of the resulting wheat product. The partial ANOVA results apply.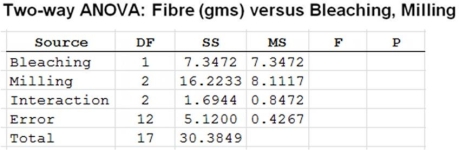
The P-value associated with the F-statistic for the interaction effect is 0.18. Based on this we can conclude that
A) there is a significant interaction effect.
B) since there is a significant interaction effect, bleaching and milling have no effect on fibre content.
C) the significance of the interaction effect will not influence the interpretation of the main effects on fibre content due to milling and bleaching.
D) there is a significant interaction effect, and it is not appropriate to interpret the main effects on fibre content due to milling and bleaching separately.
E) there is no significant interaction effect, and it is appropriate to interpret the main effects on fibre content due to milling and bleaching separately.
Question
The best tasting ice creams are generally high in fat content, which gives them a creamy texture. Four brands of ice cream (two national and two local) were tested by consumers who graded their level of creaminess (A = very creamy to F = not creamy). Each brand was rated by a different group of consumers (the data are shown below).  Using the Kruskal-Wallis test, at α = 0.10 we would conclude that
A) the alternative hypothesis should be rejected.
B) the null hypothesis should be accepted.
C) there is no difference in creaminess among the brands.
D) the null hypothesis should be rejected and at least one of the brands has a different distribution from the others.
E) as H = 14.514 > χ2 = 6.251, the level of creaminess is the same for all brands.
Using the Kruskal-Wallis test, at α = 0.10 we would conclude thatA) the alternative hypothesis should be rejected.
B) the null hypothesis should be accepted.
C) there is no difference in creaminess among the brands.
D) the null hypothesis should be rejected and at least one of the brands has a different distribution from the others.
E) as H = 14.514 > χ2 = 6.251, the level of creaminess is the same for all brands.
Question
Use the following to answer the question(s) below.
A local politician was interested in determining whether income level affects opinion regarding the governments' bailout bill of the auto industry during the 2008 financial crisis. He surveyed a sample of his constituents and got the following results.
Opinion
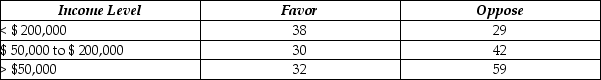
At the 0.01 level of significance, the correct conclusion is
A) income level affects opinion.
B) there is a relationship between income level and opinion.
C) since P-value = 0.024 > 0.01, we fail to reject the null hypothesis. Opinion and income level are independent.
D) reject the null hypothesis.
E) as χ2 = 7.433 < χcr2 = 9.210, we support the alternative hypothesis and find that there is an association between income level and opinion.
A local politician was interested in determining whether income level affects opinion regarding the governments' bailout bill of the auto industry during the 2008 financial crisis. He surveyed a sample of his constituents and got the following results.
Opinion
At the 0.01 level of significance, the correct conclusion is
A) income level affects opinion.
B) there is a relationship between income level and opinion.
C) since P-value = 0.024 > 0.01, we fail to reject the null hypothesis. Opinion and income level are independent.
D) reject the null hypothesis.
E) as χ2 = 7.433 < χcr2 = 9.210, we support the alternative hypothesis and find that there is an association between income level and opinion.
Question
Use the following to answer the question(s) below.
Shape-Up-By-Susie claims that participating in her exercise program will result in guaranteed weight loss in just 6 weeks. Five clients weighed themselves before and then again after participating in her program and the differences "weight after - weight before" were analyzed. Below is the relevant computer output.
At the 0.05 level of significance, the correct conclusion is
A) reject the alternative hypothesis.
B) fail to reject the null hypothesis.
C) Susie's claim is not supported by the sample evidence.
D) reject the null hypothesis and find that Susie's claim is supported by the sample evidence.
E) fail to reject the null hypothesis and support the alternative hypothesis. There is strong evidence that participating in Susie's exercise program will result in guaranteed weight gain in just 6 weeks.
Question
Use the following to answer the question(s) below.
Preparing wheat for use in bread and pasta products generally involves both milling and bleaching. A company that processes wheat is interested in determining the best combination of milling and bleaching that results in a desirable wheat product without sacrificing fibre content. They vary the milling time (short, medium and long) and bleaching (no bleaching and bleaching) and measure fibre content (gms/100 grams) of the resulting wheat product. The partial ANOVA results apply.
The F-statistic for testing whether milling has an effect on fibre content is
A) 17.22.
B) 19.01.
C) 1.99.
D) 1.43.
E) 45.22.
Question
Use the following to answer the question(s) below.
Preparing wheat for use in bread and pasta products generally involves both milling and bleaching. A company that processes wheat is interested in determining the best combination of milling and bleaching that results in a desirable wheat product without sacrificing fibre content. They vary the milling time (short, medium and long) and bleaching (no bleaching and bleaching) and measure fibre content (gms/100 grams) of the resulting wheat product. The partial ANOVA results apply.
Which of the following is true about this study?
A) It is an observational study.
B) It is a completely randomized design in one factor.
C) We use the one-way analysis of variance.
D) It is an experimental study.
E) This is a retrospective study.
Question
Use the following to answer the question(s) below.
A local politician was interested in determining whether income level affects opinion regarding the governments' bailout bill of the auto industry during the 2008 financial crisis. He surveyed a sample of his constituents and got the following results.
Opinion
The calculated value of the Chi-square statistic is
A) 7.433.
B) 29.13.
C) 40.70.
D) 5.999.
E) 2.347.
Question
The best tasting ice creams are generally high in fat content, which gives them a creamy texture. Four brands of ice cream were tested by consumers who graded their level of creaminess (A = very creamy to F = not creamy). Each brand was rated by a different group of consumers (the data are shown below). 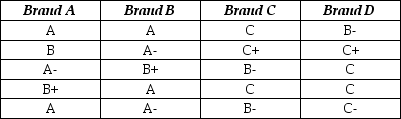 Using the Kruskal-Wallis test, the value of H is
A) 14.51.
B) 22.10.
C) 6.351.
D) 5.999.
E) 1022.
Using the Kruskal-Wallis test, the value of H isA) 14.51.
B) 22.10.
C) 6.351.
D) 5.999.
E) 1022.
Question
Question
Question
Use the following to answer the question(s) below.
Preparing wheat for use in bread and pasta products generally involves both milling and bleaching. A company that processes wheat is interested in determining the best combination of milling and bleaching that results in a desirable wheat product without sacrificing fibre content. They vary the milling time (short, medium and long) and bleaching (no bleaching and bleaching) and measure fibre content (gms/100 grams) of the resulting wheat product. The partial ANOVA results apply.
The F-statistic for testing whether bleaching has an effect on fibre content is
A) 17.22.
B) 19.01.
C) 1.99.
D) 1.43.
E) 45.22.
Question
Suppose that ten new smart phone models were evaluated by two consumer electronics magazines (Popular Electronics and Electronics Now) from 1 (best) to 10 (worst) as shown below. To determine if there is a difference in the rankings between the two magazines, the appropriate nonparametric method is
A) Wilcoxon rank-sum test.
B) Wilcoxon signed-rank test.
C) Spearman's rho test.
D) Kruskal-Wallis test.
E) Kendall's tau test.
A) Wilcoxon rank-sum test.
B) Wilcoxon signed-rank test.
C) Spearman's rho test.
D) Kruskal-Wallis test.
E) Kendall's tau test.
Question
Use the following to answer the question(s) below.
A local politician was interested in determining whether income level affects opinion regarding the governments' bailout bill of the auto industry during the 2008 financial crisis. He surveyed a sample of his constituents and got the following results.
Opinion
The correct null hypothesis to be tested is
A) opinion regarding the governments' bailout bill of the auto industry is independent of income level.
B) there is a relationship between income level and opinion.
C) opinion depends on income level.
D) opinion and income level are not independent.
E) there is a association between income level and opinion.

Unlock Deck
Sign up to unlock the cards in this deck!
Unlock Deck
Unlock Deck
1/73
Play
Full screen (f)
Deck 26: Understanding Probability Distributions and Statistical Inference
1
Use the following to answer the question(s) below.
A survey of investors finds that 60% use a full service brokerage firm to invest in stocks, 30% trade stocks online and 24% do both.
The probability that an investor selected at random neither uses a full service brokerage firm to invest in stocks nor trades stocks online is
A) 90%.
B) 66%.
C) 34%.
D) 10%.
E) 60%.
34%.
2
Use the following to answer the question(s) below.
A survey of investors finds that 60% use a full service brokerage firm to invest in stocks, 30% trade stocks online and 24% do both.
The probability that an investor selected at random uses a full service brokerage firm to invest in stocks or trades stocks online is
A) 90%.
B) 66%.
C) 34%.
D) 54%.
E) 60%.
66%.
3
A P-value indicates
A) the probability that the null hypothesis is true.
B) the probability that the alternative hypothesis is true.
C) the probability of the observed statistic given that the null hypothesis is true.
D) the probability of the observed statistic given that the alternative hypothesis is true.
E) the probability of the null hypothesis.
the probability of the observed statistic given that the null hypothesis is true.
4
Use the following to answer the question(s) below.
In economic downturns companies attempt to downsize their workforces by offering early retirement incentives to older employees. A survey of 723 companies found that 195 engage in such downsizing practices.
The 99% confidence interval for the proportion of companies that downsize their workforces by offering early retirement incentives is
A) 0.19 to 0.35.
B) 0.65 to 0.81.
C) 0.19 to 0.47.
D) 0.69 to 0.77.
E) 0.23 to 0.31.
Unlock Deck
Unlock for access to all 73 flashcards in this deck.
Unlock Deck
k this deck
5
Suppose that a manufacturer is testing one of its machines to make sure that the machine is producing more than 97% good parts (H0: p = 0.97 and HA: p > 0.97). The test results in a P-value of 0.102. In reality, the machine is producing 99% good parts. What probably happens as a result of our testing?
A) We correctly fail to reject H0.
B) We correctly reject H0.
C) We reject H0, making a Type I error.
D) We fail to reject H0, making a Type I error.
E) We fail to reject H0, making a Type II error.
A) We correctly fail to reject H0.
B) We correctly reject H0.
C) We reject H0, making a Type I error.
D) We fail to reject H0, making a Type I error.
E) We fail to reject H0, making a Type II error.
Unlock Deck
Unlock for access to all 73 flashcards in this deck.
Unlock Deck
k this deck
6
Use the following to answer the question(s) below.
The weights of soy patties sold by Veggie Burgers Delight are normally distributed. A random sample of 15 patties yields a mean weight of 108 grams with a sample standard deviation of 14 grams. At the 0.05 level of significance, perform a hypothesis test to see if the true mean weight is less than 113 grams.
The correct null and alternative hypotheses are
A) H0: µ = 113; HA: µ > 113.
B) H0: µ = 113; HA: µ < 113.
C) H0: µ > 113; HA: µ = 113.
D) H0: µ < 113; HA: µ = 113.
E) H0: µ = 113; HA: µ ≠ 113.
Unlock Deck
Unlock for access to all 73 flashcards in this deck.
Unlock Deck
k this deck
7
Use the following to answer the question(s) below.
A men's clothing store has determined the following probability distribution for the number of special size orders placed per month. The distribution is as follows:
Number Ordered Probability
0 0.10
5 0.10
10 0.12
15 0.30
20 0.38
The number of special size orders this men's clothing store can expect per month is
A) 13.8.
B) 20.
C) 15.
D) 14.2.
E) 12.5.
Unlock Deck
Unlock for access to all 73 flashcards in this deck.
Unlock Deck
k this deck
8
A quality assurance manager is interested in determining the likelihood that more than 20 calls come in to a particular customer service centre per hour. What method would be most appropriate for assigning this probability?
A) Personal
B) Judgmental
C) Subjective
D) Relative Frequency (Empirical)
E) Classical (Theoretical)
A) Personal
B) Judgmental
C) Subjective
D) Relative Frequency (Empirical)
E) Classical (Theoretical)
Unlock Deck
Unlock for access to all 73 flashcards in this deck.
Unlock Deck
k this deck
9
We have created a 95% confidence interval for the true proportion with the result (0.10, 0.15). What conclusion will we make if we test H0: p = 0.16 versus HA: p ≠ 0.16 at α = 0.05?
A) Reject the null hypothesis.
B) Accept the null hypothesis.
C) Fail to reject the null hypothesis.
D) Reject the alternative hypothesis.
E) Support the null hypothesis and accept the alternative hypothesis.
A) Reject the null hypothesis.
B) Accept the null hypothesis.
C) Fail to reject the null hypothesis.
D) Reject the alternative hypothesis.
E) Support the null hypothesis and accept the alternative hypothesis.
Unlock Deck
Unlock for access to all 73 flashcards in this deck.
Unlock Deck
k this deck
10
Use the following to answer the question(s) below.
An advocacy group is investigating whether gender has an effect on job category in large investment firms. They surveyed a sample of firms with the following results:
What is the probability that a randomly selected employee's job category is executive/managerial, given that the employee is female?
A) 0.13
B) 0.20
C) 0.80
D) 0.05
E) 0.45
Unlock Deck
Unlock for access to all 73 flashcards in this deck.
Unlock Deck
k this deck
11
A truck company wants on-time delivery for at least 98% of the parts they order from a metal manufacturing plant. They have been ordering from Hudson Manufacturing but will switch to a new, cheaper manufacturer (Steel-R-Us) unless there is evidence that this new manufacturer cannot meet the 98% on-time goal. As a test the truck company purchases a random sample of metal parts from Steel-R-Us, and then determines if these parts were delivered on-time. Which hypotheses should they test?
A) H0: p < 0.98 HA: p > 0.98
B) H0: p > 0.98 HA: p = 0.98
C) H0: p = 0.98 HA: p < 0.98
D) H0: p < 0.98 HA: p ≠ 0.98
E) H0: p = 0.98 HA: p > 0.98
A) H0: p < 0.98 HA: p > 0.98
B) H0: p > 0.98 HA: p = 0.98
C) H0: p = 0.98 HA: p < 0.98
D) H0: p < 0.98 HA: p ≠ 0.98
E) H0: p = 0.98 HA: p > 0.98
Unlock Deck
Unlock for access to all 73 flashcards in this deck.
Unlock Deck
k this deck
12
Use the following to answer the question(s) below.
Insurance company records indicate that 10% of its policyholders file claims involving theft or robbery of personal property from their homes. Suppose a random sample of 400 policyholders is selected.
The standard deviation of the sampling distribution of the sample proportion of policyholders filing claims involving theft or robbery of personal property from their homes is
A) 0.000225.
B) 0.25.
C) 0.0455.
D) 0.1667.
E) 0.015.
Unlock Deck
Unlock for access to all 73 flashcards in this deck.
Unlock Deck
k this deck
13
Use the following to answer the question(s) below.
Insurance company records indicate that 10% of its policyholders file claims involving theft or robbery of personal property from their homes. Suppose a random sample of 400 policyholders is selected.
What is probability that the sample proportion of policyholders filing claims involving theft or robbery of personal property from their homes exceeds 15%?
A) 99.96%
B) 0.04%
C) 42.07%
D) 57.93%
E) 38.21%
Unlock Deck
Unlock for access to all 73 flashcards in this deck.
Unlock Deck
k this deck
14
Use the following to answer the question(s) below.
An advocacy group is investigating whether gender has an effect on job category in large investment firms. They surveyed a sample of firms with the following results:
Two events F = {a randomly selected employee is female} and S = {a randomly selected employee's job category is professional staff} are
A) independent.
B) not independent.
C) mutually exclusive.
D) independent and mutually exclusive.
E) disjoint.
Unlock Deck
Unlock for access to all 73 flashcards in this deck.
Unlock Deck
k this deck
15
Use the following to answer the question(s) below.
Insurance company records indicate that 10% of its policyholders file claims involving theft or robbery of personal property from their homes. Suppose a random sample of 400 policyholders is selected.
The probability that the sample proportion of policyholders filing claims involving theft or robbery of personal property from their homes is less than 8% is
A) 0.0918.
B) 0.1333.
C) 0.4082.
D) 0.0517.
E) 0.7892.
Unlock Deck
Unlock for access to all 73 flashcards in this deck.
Unlock Deck
k this deck
16
Use the following to answer the question(s) below.
The weights of soy patties sold by Veggie Burgers Delight are normally distributed. A random sample of 15 patties yields a mean weight of 108 grams with a sample standard deviation of 14 grams. At the 0.05 level of significance, perform a hypothesis test to see if the true mean weight is less than 113 grams.
The correct value of the test statistic is
A) -0.4.
B) 0.4.
C) -1.38.
D) 1.38.
E) 2.79.
Unlock Deck
Unlock for access to all 73 flashcards in this deck.
Unlock Deck
k this deck
17
Use the following to answer the question(s) below.
In economic downturns companies attempt to downsize their workforces by offering early retirement incentives to older employees. A survey of 723 companies found that 195 engage in such downsizing practices.
The estimated proportion of companies that downsize their workforces by offering early retirement incentives is
A) 0.50.
B) 0.73.
C) 0.195.
D) 0.27.
E) 0.67.
Unlock Deck
Unlock for access to all 73 flashcards in this deck.
Unlock Deck
k this deck
18
We have calculated a 95% confidence interval and would like our next confidence interval to have a smaller margin of error without losing any confidence. In order to do this, we can
A) change the z* value to a smaller number.
B) take a larger sample.
C) take a smaller sample.
D) use z* = 2.576.
E) use z* = 1.645 and decrease size of sample.
A) change the z* value to a smaller number.
B) take a larger sample.
C) take a smaller sample.
D) use z* = 2.576.
E) use z* = 1.645 and decrease size of sample.
Unlock Deck
Unlock for access to all 73 flashcards in this deck.
Unlock Deck
k this deck
19
Use the following to answer the question(s) below.
An advocacy group is investigating whether gender has an effect on job category in large investment firms. They surveyed a sample of firms with the following results:
What is the probability that a randomly selected employee's job category is executive/managerial?
A) 0.20
B) 0.80
C) 0.13
D) 0.45
E) 0.25
Unlock Deck
Unlock for access to all 73 flashcards in this deck.
Unlock Deck
k this deck
20
Use the following to answer the question(s) below.
A men's clothing store has determined the following probability distribution for the number of special size orders placed per month. The distribution is as follows:
Number Ordered Probability
0 0.10
5 0.10
10 0.12
15 0.30
20 0.38
The standard deviation of the number of special size orders placed per month is
A) 24.516.
B) 4.95.
C) 15.345.
D) 6.60.
E) 3.88.
Unlock Deck
Unlock for access to all 73 flashcards in this deck.
Unlock Deck
k this deck
21
Use the following to answer the question(s) below.
Three brands of AAA batteries are compared to determine if differences in lifetime exist. Each brand is tested in four devices (TV remote, hand-held game, flashlight and digital camera). The experiment is run once for each combination of brand and device. The twelve runs are ordered randomly. The time (in minutes) that each battery lasts under continuous usage is recorded. The partial ANOVA results are as follows:
Which of the following statements is true about this design?
A) This is a completely randomized design in one factor.
B) The devices serve as blocks to account for the variability between the lengths of time batteries last in different devices.
C) We know that the interaction effect between brand of battery and type of device is significant.
D) This is no treatment in study.
E) This is a retrospective study.
Unlock Deck
Unlock for access to all 73 flashcards in this deck.
Unlock Deck
k this deck
22
Use the following to answer the question(s) below.
Chris Columbus is responsible for controlling inventory levels for four types of sailboats sold by his company. Chris takes a sample of 48 boats sold over the past several months to determine if demand is the same for each type. His results are as follows:
The calculated value of the Chi-square statistic is
A) 7.815.
B) 1.17.
C) 22.35.
D) -1.17.
E) 12.56.
Unlock Deck
Unlock for access to all 73 flashcards in this deck.
Unlock Deck
k this deck
23
Absorption rates into the body are important factors when manufacturing a generic version of a brand-name drug. A pharmacist read that the absorption rate into the body of a new generic drug (G) is the same as its brand-name counterpart (B). She has a researcher friend of hers run a small experiment to test H0: μG - μB = 0 against the alternative HA: μG - μB ≠ 0. Which of the following would be a Type I error?
A) Deciding that the absorption rates of G are higher, when in fact they are not.
B) Deciding that the absorption rates of G are lower, when in fact they are not.
C) Deciding that the absorption rates are the same, when in fact they are not.
D) Deciding that the absorption rates are different, when in fact they are not.
E) Deciding that the absorption rates are the same, when in fact the absorption rates of G are higher.
Unlock Deck
Unlock for access to all 73 flashcards in this deck.
Unlock Deck
k this deck
24
Based on the scatterplot shown below, what makes a nonparametric method more appropriate than the Pearson correlation for measuring the association between the two variables?
A) Nonlinearity
B) These variables are not quantitative.
C) The presence of an outlier
D) Violation of Linearity Condition and the fact that these variables are not quantitative
E) There is no unusual observation, but we have to deal with a bend in the data.
A) Nonlinearity
B) These variables are not quantitative.
C) The presence of an outlier
D) Violation of Linearity Condition and the fact that these variables are not quantitative
E) There is no unusual observation, but we have to deal with a bend in the data.
Unlock Deck
Unlock for access to all 73 flashcards in this deck.
Unlock Deck
k this deck
25
Use the following to answer the question(s) below.
A publishing company conducted a survey of its readership and found that 60% subscribed to Food & Wine, 30% subscribed to Wine Spectator, and 25% subscribed to both.
The probability that a reader does not subscribe to either is
A) 0.10.
B) 0.65.
C) 0.50.
D) 0.45.
E) 0.35.
A publishing company conducted a survey of its readership and found that 60% subscribed to Food & Wine, 30% subscribed to Wine Spectator, and 25% subscribed to both.
The probability that a reader does not subscribe to either is
A) 0.10.
B) 0.65.
C) 0.50.
D) 0.45.
E) 0.35.
Unlock Deck
Unlock for access to all 73 flashcards in this deck.
Unlock Deck
k this deck
26
Use the following to answer the question(s) below.
Chris Columbus is responsible for controlling inventory levels for four types of sailboats sold by his company. Chris takes a sample of 48 boats sold over the past several months to determine if demand is the same for each type. His results are as follows:
At the 0.05 level of significance, the correct conclusion is
A) evidence suggests that the demand is the same for different types of boats.
B) evidence suggests that the demand is not the same for different types of boats.
C) reject the null hypothesis.
D) evidence suggests that the demand is dependent on the type of boat.
E) evidence suggests that type of boat affects the demand.
Unlock Deck
Unlock for access to all 73 flashcards in this deck.
Unlock Deck
k this deck
27
Use the following to answer the question(s) below.
Three brands of AAA batteries are compared to determine if differences in lifetime exist. Each brand is tested in four devices (TV remote, hand-held game, flashlight and digital camera). The experiment is run once for each combination of brand and device. The twelve runs are ordered randomly. The time (in minutes) that each battery lasts under continuous usage is recorded. The partial ANOVA results are as follows:
The P-value associated with this F-statistic associated with the brands is 0.128. Based on this, we can conclude that
A) we should reject the null hypothesis.
B) there is a difference in the mean lifetimes among the different brands.
C) there is no significant difference in the mean lifetimes among the different devices.
D) we should support the alternative hypothesis.
E) there is no difference in the mean lifetimes among the different brands.
Unlock Deck
Unlock for access to all 73 flashcards in this deck.
Unlock Deck
k this deck
28
Use the following to answer the question(s) below.
Chris Columbus is responsible for controlling inventory levels for four types of sailboats sold by his company. Chris takes a sample of 48 boats sold over the past several months to determine if demand is the same for each type. His results are as follows:
The correct null hypothesis to be tested is
A) type of boat and demand are related.
B) the demand differs for each type of boat.
C) the demand is the same for each type of boat.
D) the demand is dependent on the type of boat.
E) type of boat affects the demand.
Unlock Deck
Unlock for access to all 73 flashcards in this deck.
Unlock Deck
k this deck
29
The following plot is the best for checking
A) Equal Variance Assumption.
B) Linearity Assumption.
C) Nearly Normal Condition.
D) Non-linear Condition.
E) Dependence Condition.
A) Equal Variance Assumption.
B) Linearity Assumption.
C) Nearly Normal Condition.
D) Non-linear Condition.
E) Dependence Condition.
Unlock Deck
Unlock for access to all 73 flashcards in this deck.
Unlock Deck
k this deck
30
Use the following to answer the question(s) below.
A publishing company conducted a survey of its readership and found that 60% subscribed to Food & Wine, 30% subscribed to Wine Spectator, and 25% subscribed to both.
The probability that a reader subscribes to Food & Wine or Wine Spectator is
A) 0.90.
B) 0.65.
C) 0.25.
D) 0.50.
E) 0.85.
A publishing company conducted a survey of its readership and found that 60% subscribed to Food & Wine, 30% subscribed to Wine Spectator, and 25% subscribed to both.
The probability that a reader subscribes to Food & Wine or Wine Spectator is
A) 0.90.
B) 0.65.
C) 0.25.
D) 0.50.
E) 0.85.
Unlock Deck
Unlock for access to all 73 flashcards in this deck.
Unlock Deck
k this deck
31
Suppose that 6 economists who work for the federal government and 7 university economists were asked to grade the effectiveness of an economic stimulus bill in terms of its ability to increase jobs over the next two years. The grades are shown in below. Using the appropriate nonparametric method, the calculated value of the test statistic is
A) T = TGovernment = 55.5.
B) T= 30.
C) T = 54.
D) T = TUniversity = 35.5.
E) T = 91.
A) T = TGovernment = 55.5.
B) T= 30.
C) T = 54.
D) T = TUniversity = 35.5.
E) T = 91.
Unlock Deck
Unlock for access to all 73 flashcards in this deck.
Unlock Deck
k this deck
32
Suppose that ten new smart phone models were evaluated by two consumer electronics magazines (Popular Electronics and Electronics Now) from 1 (best) to 10 (worst) as shown below. Why is the Spearman's rho more appropriate than the correlation coefficient for these data?
A) The relationship is nonlinear.
B) The data are ordinal.
C) The data are not paired.
D) There is one extreme outlier.
E) Both outliers and bends in the data make the correlation coefficient difficult to interpret.
A) The relationship is nonlinear.
B) The data are ordinal.
C) The data are not paired.
D) There is one extreme outlier.
E) Both outliers and bends in the data make the correlation coefficient difficult to interpret.
Unlock Deck
Unlock for access to all 73 flashcards in this deck.
Unlock Deck
k this deck
33
A telecommunications company is interested in determining the likelihood of a new breakthrough technology being developed in the next ten years. What type of probability would they use to estimate the likelihood?
A) Relative Frequency
B) Classical (Theoretical)
C) Personal (Subjective)
D) Model-Based
E) Empirical
A) Relative Frequency
B) Classical (Theoretical)
C) Personal (Subjective)
D) Model-Based
E) Empirical
Unlock Deck
Unlock for access to all 73 flashcards in this deck.
Unlock Deck
k this deck
34
Suppose that 6 economists who work for the federal government and 7 university economists were asked to grade the effectiveness of an economic stimulus bill in terms of its ability to increase jobs over the next two years. What nonparametric method is appropriate for testing if the two groups differ in terms of their opinion?
A) Wilcoxon rank-sum test
B) Wilcoxon signed-rank test
C) Spearman's rho test
D) Kruskal-Wallis Test
E) Kendall's tau test
A) Wilcoxon rank-sum test
B) Wilcoxon signed-rank test
C) Spearman's rho test
D) Kruskal-Wallis Test
E) Kendall's tau test
Unlock Deck
Unlock for access to all 73 flashcards in this deck.
Unlock Deck
k this deck
35
Use the following to answer the question(s) below.
A sample of 30-year fixed mortgage rates at 12 randomly chosen credit unions yields a mean rate of 6.65 % and a sample standard deviation of 0.39%. A sample of 30-year fixed mortgage rates at 16 randomly selected banks yields a mean rate of 7.05% and a sample standard deviation of 0.22%. Are the mean rates different between credit unions and banks? Relevant output is shown below.
Which of the following is true?
A) This is a paired t-test.
B) This is a test for two means from independent samples.
C) This is a one-tailed test.
D) This is a paired design and one-tailed t-test.
E) This is a pooled t-test.
Unlock Deck
Unlock for access to all 73 flashcards in this deck.
Unlock Deck
k this deck
36
Which of the following is not an assumption or condition that needs to be checked for a paired t-interval?
A) Paired Data Assumption
B) Independent Groups Assumption
C) Randomization Condition
D) 10% Condition
E) Normal Population Assumption
A) Paired Data Assumption
B) Independent Groups Assumption
C) Randomization Condition
D) 10% Condition
E) Normal Population Assumption
Unlock Deck
Unlock for access to all 73 flashcards in this deck.
Unlock Deck
k this deck
37
A professor was interested in determining whether the prices of new textbooks in the bookstore were higher than if purchased online. She selected 6 textbooks and priced each at the bookstore and online. Which statement is true at 5% significance level?
A) There is not enough evidence to suggest that the prices of new textbooks in the bookstore were higher than if purchased online, on average.
B) There is strong evidence that the prices are higher in the bookstore.
C) We are 95% sure that the prices are higher online.
D) There is strong evidence that the prices in the bookstore and online are different.
E) We are 95% sure that the prices in the bookstore and online are exactly the same.
Unlock Deck
Unlock for access to all 73 flashcards in this deck.
Unlock Deck
k this deck
38
Use the following to answer the question(s) below.
Three brands of AAA batteries are compared to determine if differences in lifetime exist. Each brand is tested in four devices (TV remote, hand-held game, flashlight and digital camera). The experiment is run once for each combination of brand and device. The twelve runs are ordered randomly. The time (in minutes) that each battery lasts under continuous usage is recorded. The partial ANOVA results are as follows:
The F-statistic for testing whether the three brands of AAA batteries have equal mean lifetimes is
A) 2.96.
B) 1654.89.
C) 0.98.
D) 827.49.
E) 54.67.
Unlock Deck
Unlock for access to all 73 flashcards in this deck.
Unlock Deck
k this deck
39
Use the following to answer the question(s) below.
A sample of 30-year fixed mortgage rates at 12 randomly chosen credit unions yields a mean rate of 6.65 % and a sample standard deviation of 0.39%. A sample of 30-year fixed mortgage rates at 16 randomly selected banks yields a mean rate of 7.05% and a sample standard deviation of 0.22%. Are the mean rates different between credit unions and banks? Relevant output is shown below.
At the 0.05 level of significance, the correct conclusion is
A) reject the alternative hypothesis.
B) fail to reject the null hypothesis.
C) evidence suggests that there is no significant difference in mean mortgage rates between credit unions and banks.
D) reject the null hypothesis; evidence suggests that there is a significant difference in mean mortgage rates between credit unions and banks.
E) fail to reject the null hypothesis; evidence suggests that the mortgage rates at credit unions are lower than at banks, on average.
Unlock Deck
Unlock for access to all 73 flashcards in this deck.
Unlock Deck
k this deck
40
Use the following to answer the question(s) below.
The weights of soy patties sold by Veggie Burgers Delight are normally distributed. A random sample of 15 patties yields a mean weight of 108 grams with a sample standard deviation of 14 grams. At the 0.05 level of significance, perform a hypothesis test to see if the true mean weight is less than 113 grams.
The correct conclusion at the 0.05 level of significance is
A) fail to reject the null hypothesis, and there is no evidence that the true mean weight is less than 113 grams.
B) reject the null hypothesis.
C) evidence suggests that the mean weight is less than 113 grams.
D) do not reject the null hypothesis, as evidence suggests that the mean weight is less than 113 grams.
E) reject the null hypothesis, as evidence suggests that the mean weight is less than 113 grams.
Unlock Deck
Unlock for access to all 73 flashcards in this deck.
Unlock Deck
k this deck
41
Use the following to answer the question(s) below.
A government agency has 6000 employees. As an alternative to the traditional five day work week, employees were asked whether they preferred a four-day work week (10 hours per day) or flexible hours. The table below shows the results by age category.
What is the probability that an employee prefers flex hours given that he/she is in the 30-45 age group?
A) 0.90
B) 0.56
C) 0.31
D) 0.80
E) 0.67
Unlock Deck
Unlock for access to all 73 flashcards in this deck.
Unlock Deck
k this deck
42
Use the following to answer the question(s) below.
IT staff for a large corporation has developed the following probability distribution for the number of calls requiring troubleshooting problems per day.
After computing a confidence interval, the investigator believes that the results are meaningless because the width of the interval is too large. In reconstructing the interval, the investigator should
A) decrease the sample size.
B) increase the level of confidence.
C) increase the sample size.
D) reduce the population variance.
E) increase the margin of error.
Unlock Deck
Unlock for access to all 73 flashcards in this deck.
Unlock Deck
k this deck
43
Use the following to answer the question(s) below.
A government agency has 6000 employees. As an alternative to the traditional five day work week, employees were asked whether they preferred a four-day work week (10 hours per day) or flexible hours. The table below shows the results by age category.
What is the probability that an employee at this government agency prefers a four-day work week?
A) 0.54
B) 0.15
C) 0.50
D) 0.35
E) 0.65
Unlock Deck
Unlock for access to all 73 flashcards in this deck.
Unlock Deck
k this deck
44
A type I error is committed when
A) we don't reject a null hypothesis that is true.
B) we reject a null hypothesis that is false.
C) we reject a null hypothesis that is true.
D) we don't reject a null hypothesis that is false.
E) the null hypothesis is not properly constructed.
A) we don't reject a null hypothesis that is true.
B) we reject a null hypothesis that is false.
C) we reject a null hypothesis that is true.
D) we don't reject a null hypothesis that is false.
E) the null hypothesis is not properly constructed.
Unlock Deck
Unlock for access to all 73 flashcards in this deck.
Unlock Deck
k this deck
45
Use the following to answer the question(s) below.
A newspaper poll asked respondents if they trusted "eco friendly" labels on cleaning products. Out of 1000 adults surveyed, 498 responded "yes." We would like to test if the proportion of respondents that trust these labels is at least 50%.
At the 0.01 level of significance, the correct conclusion is
A) do not reject the alternative hypothesis.
B) reject the null hypothesis.
C) there is no evidence that at least 50% of respondents trust "eco-friendly" labels.
D) fail to reject the null hypothesis. There is no evidence that the proportion of respondents that trust "eco-friendly" labels is less than 50%.
E) reject the null hypothesis. There is strong evidence that the proportion of respondents that trust "eco-friendly" labels is less than 50%.
Unlock Deck
Unlock for access to all 73 flashcards in this deck.
Unlock Deck
k this deck
46
Use the following to answer the question(s) below.
IT staff for a large corporation has developed the following probability distribution for the number of calls requiring troubleshooting problems per day.
The expected number of calls per day is
A) 2.77.
B) 1.56.
C) 1.21.
D) 1.31.
E) 1.0.
IT staff for a large corporation has developed the following probability distribution for the number of calls requiring troubleshooting problems per day.
The expected number of calls per day is
A) 2.77.
B) 1.56.
C) 1.21.
D) 1.31.
E) 1.0.
Unlock Deck
Unlock for access to all 73 flashcards in this deck.
Unlock Deck
k this deck
47
Use the following to answer the question(s) below.
A newspaper poll asked respondents if they trusted "eco friendly" labels on cleaning products. Out of 1000 adults surveyed, 498 responded "yes." We would like to test if the proportion of respondents that trust these labels is at least 50%.
The calculated test statistic value is
A) -0.126.
B) -2.45.
C) 1.27.
D) -1.89.
E) 0.139.
Unlock Deck
Unlock for access to all 73 flashcards in this deck.
Unlock Deck
k this deck
48
An urban planning group is interested in estimating the difference in mean household income between two neighbourhoods. They obtain the following 95% confidence interval: (-5693, -4107)
Which of the following is true?
A) This is a pooled t-confidence interval.
B) There is no significant difference in the mean household incomes between the two neighbourhoods.
C) There is a significant difference in the mean household incomes between the two neighbourhoods.
D) This is a paired t-confidence interval and there is no significant difference in the mean household incomes between the two neighbourhoods.
E) This is a paired t-confidence interval and the mean household income of the first neighbourhood is higher than in the second.
Unlock Deck
Unlock for access to all 73 flashcards in this deck.
Unlock Deck
k this deck
49
Use the following to answer the question(s) below.
Shape-Up-By-Susie claims that participating in her exercise program will result in guaranteed weight loss in just 6 weeks. Five clients weighed themselves before and then again after participating in her program and the differences "weight after - weight before" were analyzed. Below is the relevant computer output.
Which of the following statement is true?
A) This is a pooled t-test.
B) This is a two-tailed test.
C) This is a two-sample t-test for independent groups.
D) This is a pooled and two-tailed t-test.
E) This is a paired t-test, and it is also one-tailed.
Unlock Deck
Unlock for access to all 73 flashcards in this deck.
Unlock Deck
k this deck
50
Use the following to answer the question(s) below.
A manufacturer of cordless electric shavers sampled 13 from a day's production and found the mean time of continuous usage without recharging to be 410 minutes with a sample standard deviation of 30 minutes. We can assume that times are normally distributed. We wish to test if the true mean operating time without recharging is more than 400 minutes.
The correct value of the test statistic is
A) 1.20.
B) -0.333.
C) -2.52.
D) -1.20.
E) 2.79.
Unlock Deck
Unlock for access to all 73 flashcards in this deck.
Unlock Deck
k this deck
51
Use the following to answer the question(s) below.
IT staff for a large corporation has developed the following probability distribution for the number of calls requiring troubleshooting problems per day.
The standard deviation of the sampling distribution of mean times is
A) 0.4 minutes.
B) 2 minutes.
C) 0.08 minutes.
D) 1.6 minutes.
E) 0.12 minutes.
Unlock Deck
Unlock for access to all 73 flashcards in this deck.
Unlock Deck
k this deck
52
Use the following to answer the question(s) below.
IT staff for a large corporation has developed the following probability distribution for the number of calls requiring troubleshooting problems per day.
If a population is normally distributed with µ = 500 and σ = 50, and a sample of size 20 is selected, the probability that the sample mean falls between 450 and 550 will be ________ the probability that an individual value falls between 450 and 550.
A) the same as
B) less than
C) greater than
D) less than or the same as
E) approximately the same as
Unlock Deck
Unlock for access to all 73 flashcards in this deck.
Unlock Deck
k this deck
53
A human resources manager at a large company wants to estimate the proportion of employees that would be interested in reimbursement for college courses. If she wishes to be 95% confident that her estimate is within 5% of the true proportion, how many employees would need to be sampled?
A) 271
B) 385
C) 543
D) 646
E) 1234
A) 271
B) 385
C) 543
D) 646
E) 1234
Unlock Deck
Unlock for access to all 73 flashcards in this deck.
Unlock Deck
k this deck
54
Use the following to answer the question(s) below.
A manufacturer of cordless electric shavers sampled 13 from a day's production and found the mean time of continuous usage without recharging to be 410 minutes with a sample standard deviation of 30 minutes. We can assume that times are normally distributed. We wish to test if the true mean operating time without recharging is more than 400 minutes.
The correct null and alternative hypotheses are
A) H0: µ = 400; HA: µ < 400.
B) H0: µ = 400; HA: µ > 400.
C) H0: µ > 400; HA: µ = 400.
D) H0: µ < 400; HA: µ = 400.
E) H0: µ = 400; HA: µ ≠ 400.
Unlock Deck
Unlock for access to all 73 flashcards in this deck.
Unlock Deck
k this deck
55
Use the following to answer the question(s) below.
A manufacturer of cordless electric shavers sampled 13 from a day's production and found the mean time of continuous usage without recharging to be 410 minutes with a sample standard deviation of 30 minutes. We can assume that times are normally distributed. We wish to test if the true mean operating time without recharging is more than 400 minutes.
The correct conclusion at the 0.05 level of significance is
A) reject the null hypothesis.
B) fail to reject the null hypothesis, and there is no evidence that true mean operating time without recharging is more than 400 minutes.
C) evidence suggests that the mean operating time is more than 400 minutes.
D) reject the null hypothesis and find that evidence suggests that the mean operating time is more than 400 minutes.
E) do not reject the alternative hypothesis and find that evidence suggests that the mean operating time is more than 400 minutes.
Unlock Deck
Unlock for access to all 73 flashcards in this deck.
Unlock Deck
k this deck
56
Use the following to answer the question(s) below.
IT staff for a large corporation has developed the following probability distribution for the number of calls requiring troubleshooting problems per day.
The standard deviation of the number of calls per day is
A) 1.31.
B) 1.14.
C) 2.77.
D) 1.56.
E) 1.21.
IT staff for a large corporation has developed the following probability distribution for the number of calls requiring troubleshooting problems per day.
The standard deviation of the number of calls per day is
A) 1.31.
B) 1.14.
C) 2.77.
D) 1.56.
E) 1.21.
Unlock Deck
Unlock for access to all 73 flashcards in this deck.
Unlock Deck
k this deck
57
Use the following to answer the question(s) below.
A government agency has 6000 employees. As an alternative to the traditional five day work week, employees were asked whether they preferred a four-day work week (10 hours per day) or flexible hours. The table below shows the results by age category.
Two events F = {a randomly selected employee prefers flex hours} and O = {a randomly selected employee is over 45 years old} are
A) independent.
B) mutually exclusive.
C) not independent.
D) independent and mutually exclusive.
E) disjoint.
Unlock Deck
Unlock for access to all 73 flashcards in this deck.
Unlock Deck
k this deck
58
Use the following to answer the question(s) below.
IT staff for a large corporation has developed the following probability distribution for the number of calls requiring troubleshooting problems per day.
Which is true about a 99% confidence interval based on a given sample?
A) If we increase the sample size, the width of the interval will increase.
B) The interval contains 99% of the population.
C) Results from 99% of all samples will lie in this interval.
D) The interval is wider than a 95% confidence interval would be.
E) The interval is narrower than a 95% confidence interval would be.
Unlock Deck
Unlock for access to all 73 flashcards in this deck.
Unlock Deck
k this deck
59
Use the following to answer the question(s) below.
A newspaper poll asked respondents if they trusted "eco friendly" labels on cleaning products. Out of 1000 adults surveyed, 498 responded "yes." We would like to test if the proportion of respondents that trust these labels is at least 50%.
The correct alternative hypothesis is
A) p = 0.50.
B) p ≤ 0.50.
C) p ≥ 0.50.
D) p > 0.50.
E) p < 0.50.
Unlock Deck
Unlock for access to all 73 flashcards in this deck.
Unlock Deck
k this deck
60
Use the following to answer the question(s) below.
IT staff for a large corporation has developed the following probability distribution for the number of calls requiring troubleshooting problems per day.
What is the probability that the sample mean will be less than 7.5 minutes?
A) 0.3944
B) 0.1056
C) 0.2114
D) 0.4013
E) 0.8944
IT staff for a large corporation has developed the following probability distribution for the number of calls requiring troubleshooting problems per day.
What is the probability that the sample mean will be less than 7.5 minutes?
A) 0.3944
B) 0.1056
C) 0.2114
D) 0.4013
E) 0.8944
Unlock Deck
Unlock for access to all 73 flashcards in this deck.
Unlock Deck
k this deck
61
Use the following to answer the question(s) below.
Preparing wheat for use in bread and pasta products generally involves both milling and bleaching. A company that processes wheat is interested in determining the best combination of milling and bleaching that results in a desirable wheat product without sacrificing fibre content. They vary the milling time (short, medium and long) and bleaching (no bleaching and bleaching) and measure fibre content (gms/100 grams) of the resulting wheat product. The partial ANOVA results apply.
The P-value associated with the F-statistic for the interaction effect is 0.18. Based on this we can conclude that
A) there is a significant interaction effect.
B) since there is a significant interaction effect, bleaching and milling have no effect on fibre content.
C) the significance of the interaction effect will not influence the interpretation of the main effects on fibre content due to milling and bleaching.
D) there is a significant interaction effect, and it is not appropriate to interpret the main effects on fibre content due to milling and bleaching separately.
E) there is no significant interaction effect, and it is appropriate to interpret the main effects on fibre content due to milling and bleaching separately.
Unlock Deck
Unlock for access to all 73 flashcards in this deck.
Unlock Deck
k this deck
62
The best tasting ice creams are generally high in fat content, which gives them a creamy texture. Four brands of ice cream (two national and two local) were tested by consumers who graded their level of creaminess (A = very creamy to F = not creamy). Each brand was rated by a different group of consumers (the data are shown below). Using the Kruskal-Wallis test, at α = 0.10 we would conclude that
A) the alternative hypothesis should be rejected.
B) the null hypothesis should be accepted.
C) there is no difference in creaminess among the brands.
D) the null hypothesis should be rejected and at least one of the brands has a different distribution from the others.
E) as H = 14.514 > χ2 = 6.251, the level of creaminess is the same for all brands.
Using the Kruskal-Wallis test, at α = 0.10 we would conclude thatA) the alternative hypothesis should be rejected.
B) the null hypothesis should be accepted.
C) there is no difference in creaminess among the brands.
D) the null hypothesis should be rejected and at least one of the brands has a different distribution from the others.
E) as H = 14.514 > χ2 = 6.251, the level of creaminess is the same for all brands.
Unlock Deck
Unlock for access to all 73 flashcards in this deck.
Unlock Deck
k this deck
63
Use the following to answer the question(s) below.
A local politician was interested in determining whether income level affects opinion regarding the governments' bailout bill of the auto industry during the 2008 financial crisis. He surveyed a sample of his constituents and got the following results.
Opinion
At the 0.01 level of significance, the correct conclusion is
A) income level affects opinion.
B) there is a relationship between income level and opinion.
C) since P-value = 0.024 > 0.01, we fail to reject the null hypothesis. Opinion and income level are independent.
D) reject the null hypothesis.
E) as χ2 = 7.433 < χcr2 = 9.210, we support the alternative hypothesis and find that there is an association between income level and opinion.
Unlock Deck
Unlock for access to all 73 flashcards in this deck.
Unlock Deck
k this deck
64
Use the following to answer the question(s) below.
Shape-Up-By-Susie claims that participating in her exercise program will result in guaranteed weight loss in just 6 weeks. Five clients weighed themselves before and then again after participating in her program and the differences "weight after - weight before" were analyzed. Below is the relevant computer output.
At the 0.05 level of significance, the correct conclusion is
A) reject the alternative hypothesis.
B) fail to reject the null hypothesis.
C) Susie's claim is not supported by the sample evidence.
D) reject the null hypothesis and find that Susie's claim is supported by the sample evidence.
E) fail to reject the null hypothesis and support the alternative hypothesis. There is strong evidence that participating in Susie's exercise program will result in guaranteed weight gain in just 6 weeks.
Unlock Deck
Unlock for access to all 73 flashcards in this deck.
Unlock Deck
k this deck
65
Use the following to answer the question(s) below.
Preparing wheat for use in bread and pasta products generally involves both milling and bleaching. A company that processes wheat is interested in determining the best combination of milling and bleaching that results in a desirable wheat product without sacrificing fibre content. They vary the milling time (short, medium and long) and bleaching (no bleaching and bleaching) and measure fibre content (gms/100 grams) of the resulting wheat product. The partial ANOVA results apply.
The F-statistic for testing whether milling has an effect on fibre content is
A) 17.22.
B) 19.01.
C) 1.99.
D) 1.43.
E) 45.22.
Unlock Deck
Unlock for access to all 73 flashcards in this deck.
Unlock Deck
k this deck
66
Use the following to answer the question(s) below.
Preparing wheat for use in bread and pasta products generally involves both milling and bleaching. A company that processes wheat is interested in determining the best combination of milling and bleaching that results in a desirable wheat product without sacrificing fibre content. They vary the milling time (short, medium and long) and bleaching (no bleaching and bleaching) and measure fibre content (gms/100 grams) of the resulting wheat product. The partial ANOVA results apply.
Which of the following is true about this study?
A) It is an observational study.
B) It is a completely randomized design in one factor.
C) We use the one-way analysis of variance.
D) It is an experimental study.
E) This is a retrospective study.
Unlock Deck
Unlock for access to all 73 flashcards in this deck.
Unlock Deck
k this deck
67
Use the following to answer the question(s) below.
A local politician was interested in determining whether income level affects opinion regarding the governments' bailout bill of the auto industry during the 2008 financial crisis. He surveyed a sample of his constituents and got the following results.
Opinion
The calculated value of the Chi-square statistic is
A) 7.433.
B) 29.13.
C) 40.70.
D) 5.999.
E) 2.347.
Unlock Deck
Unlock for access to all 73 flashcards in this deck.
Unlock Deck
k this deck
68
The best tasting ice creams are generally high in fat content, which gives them a creamy texture. Four brands of ice cream were tested by consumers who graded their level of creaminess (A = very creamy to F = not creamy). Each brand was rated by a different group of consumers (the data are shown below). Using the Kruskal-Wallis test, the value of H is
A) 14.51.
B) 22.10.
C) 6.351.
D) 5.999.
E) 1022.
Using the Kruskal-Wallis test, the value of H isA) 14.51.
B) 22.10.
C) 6.351.
D) 5.999.
E) 1022.
Unlock Deck
Unlock for access to all 73 flashcards in this deck.
Unlock Deck
k this deck
69
A contact lens wearer read that the producer of a new contact lens boasts that their lenses are cheaper than contact lenses from another popular company. The null hypothesis H0: μold - μnew = 0 is tested against the alternative HA: μold - μnew > 0. Which of the following would be a Type II error?
A) Deciding that the new lenses are more expensive, when in fact they are cheaper.
B) Deciding that, on average, the new lenses are cheaper, when in fact they are not.
C) Deciding that, on average, the new lenses are not really cheaper, when in fact they are.
D) Deciding that the prices of new lenses are exactly the same as the old ones, when in fact they are not.
E) Deciding that the prices of old lenses are exactly the same as the new ones, when in fact they are not.
Unlock Deck
Unlock for access to all 73 flashcards in this deck.
Unlock Deck
k this deck
70
Which of the following is not an assumption or condition that needs to be checked for a two-sample t-test for the difference between two means?
A) Independence Assumption
B) Randomization Condition
C) 10% Condition
D) Nearly Normal Condition
E) 90% Condition
A) Independence Assumption
B) Randomization Condition
C) 10% Condition
D) Nearly Normal Condition
E) 90% Condition
Unlock Deck
Unlock for access to all 73 flashcards in this deck.
Unlock Deck
k this deck
71
Use the following to answer the question(s) below.
Preparing wheat for use in bread and pasta products generally involves both milling and bleaching. A company that processes wheat is interested in determining the best combination of milling and bleaching that results in a desirable wheat product without sacrificing fibre content. They vary the milling time (short, medium and long) and bleaching (no bleaching and bleaching) and measure fibre content (gms/100 grams) of the resulting wheat product. The partial ANOVA results apply.
The F-statistic for testing whether bleaching has an effect on fibre content is
A) 17.22.
B) 19.01.
C) 1.99.
D) 1.43.
E) 45.22.
Unlock Deck
Unlock for access to all 73 flashcards in this deck.
Unlock Deck
k this deck
72
Suppose that ten new smart phone models were evaluated by two consumer electronics magazines (Popular Electronics and Electronics Now) from 1 (best) to 10 (worst) as shown below. To determine if there is a difference in the rankings between the two magazines, the appropriate nonparametric method is
A) Wilcoxon rank-sum test.
B) Wilcoxon signed-rank test.
C) Spearman's rho test.
D) Kruskal-Wallis test.
E) Kendall's tau test.
A) Wilcoxon rank-sum test.
B) Wilcoxon signed-rank test.
C) Spearman's rho test.
D) Kruskal-Wallis test.
E) Kendall's tau test.
Unlock Deck
Unlock for access to all 73 flashcards in this deck.
Unlock Deck
k this deck
73
Use the following to answer the question(s) below.
A local politician was interested in determining whether income level affects opinion regarding the governments' bailout bill of the auto industry during the 2008 financial crisis. He surveyed a sample of his constituents and got the following results.
Opinion
The correct null hypothesis to be tested is
A) opinion regarding the governments' bailout bill of the auto industry is independent of income level.
B) there is a relationship between income level and opinion.
C) opinion depends on income level.
D) opinion and income level are not independent.
E) there is a association between income level and opinion.
Unlock Deck
Unlock for access to all 73 flashcards in this deck.
Unlock Deck
k this deck
Unlock Deck
Unlock for access to all 73 flashcards in this deck.


